Research Journal
Volume 9, No. 26, June 2015, pages 57–65
DOI: 10.12913/22998624/2365 Research Article
Received: 2015.04.16 Accepted: 2015.05.08 Published: 2015.06.01
DIAGNOSTICS OF WORKPIECE SURFACE CONDITION BASED ON CUTTING
TOOL VIBRATIONS DURING MACHINING
Jerzy Józwik1, Dariusz Mika2
1 Department of Production Engineering, Mechanical Engineering Faculty, Lublin University of Technology, Nadbystrzycka 36, 20-816 Lublin, Poland, e-mail: [email protected]
2 Center for the Study of Engineering, Institute of Technical Sciences and Aviation, The State School of Higher Education in Chelm, Depułtycze Królewskie 55, 22-100 Chelm, Poland, e-mail: [email protected]
ABSTRACT
The paper presents functional relationships between surface geometry parameters, feedrate and vibrations level in the radial direction of the workpiece. Time charac-teristics of the acceleration of cutting tool vibration registered during C45 steel and stainless steel machining for separate axes (X, Y, Z) were presented as a function of feedrate f. During the tests surface geometric accuracy assessment was performed and 3D surface roughness parameters were determined. The Sz parameter was selected for the analysis, which was then collated with RMS vibration acceleration and feedrate
f. The Sz parameter indirectly provides information on peak to valley height and is characterised by high generalising potential i.e. it is highly correlated to other surface and volume parameters of surface roughness. Test results presented in this paper may
constitute a valuable source of information considering the influence of vibrations on
geometric accuracy of elements for engineers designing technological processes.
Keywords: vibration, diagnostics, machining, turning, surface geometric structure, roughness parameters.
INTRODUCTION
Despite tremendous progress in the construc-tion of both machine tools and cutting tools, ef-fective methods of eliminating (minimising) vi-bration in machining are yet to be found [1, 3, 4, 7, 11, 12]. It particularly concerns the process
of machining flexible objects and those suscep -tible to heat (i.e. thin-walled parts and long, slen-der rollers) [4–6, 8, 9, 15] as well as machining
with the use of highly flexible tools (mainly of
high overhang) [1, 10]. The analysis of literature [4, 5, 12, 15] shows that defects caused by elas-tic strains are of high importance, as far as the accuracy of machining is concerned, and they constitute from 20 to 80% of total machining er-ror. While machined, low-stiffness parts generate vibration, their machining, however, cannot be
avoided [5, 8, 15]. A significant group of parts
used in the aviation industry can serve as an
ex-ample of such objects. Irrespective of increasing
stiffness of machine tools and modern materials used for main bodies and other parts of machine tools (having high capacity for dampening vibra-tion) as well as precise tools and holders, still,
vibration has a considerable influence on consti -tuting the dimensional and shape characteristics manufactured parts [2, 3]. The necessity to avoid vibration, especially self-induced one, usually enforces reduction of technological parameters of machining, which does not always seem the solu-tion to a problem and is not economically viable [15]. In the process of machining, vibration has a number of sources, the principal of which are the force input, kinematic input and inertial in-put [3, 4, 7, 11, 12]. As a result of self-induced vibration while machining, almost periodic shape defects occur. This kind of vibration in the
ma-chine tool-clamp-object-tool system results from
force values as well as forces responsible for transferring energy from propulsion into the
ma-chine tool-clamp-object-tool system. Vibration
occurrence can be an outcome of multiple factors such as machining parameters, type of material
and shape of machined object, the structure of a
tool and its fastening as well as the steadiness of a
machine tool itself. It has a negative influence on
metal machining and seems particularly
undesir-able while finishing surfaces. What occurs as a
result is high surface roughness, faster wear of a cutting blade and a high frequency noise which
can be harmful to workers. Vibration occurs as
a result of: inaccurate balancing of machine tool
rotary parts or a revolving object being machined,
intermittent character of the process of machin-ing (i.e. consecutive use of a cuttmachin-ing blade while milling or a broach while broaching), kinematic transmission defects (i.e. graduation errors or ec-centric performance of cutting blades in relation to the wheel rotation axis which trigger the ap-pearance of periodic forces being transferred to machine tool bearings and guideways), external vibration (i.e. when another machine generating strong vibration works nearby). One more source of vibration can be a physical process of machin-ing itself [1–12].
Vibration identification can be carried out
with the use of contact sensors (i.e. accelerom-eters <acceleration sensors>), non-contact laser techniques (i.e. laser vibrometers, laser sensors) as well as vision methods facilitating movement analysis (i.e. using fast vision cameras and a PONTOS system belonging to GOM). Examples of such measurement systems and their
practi-cal application can often be found in scientific
literature [13–16].
METHODOLOGY
Diagnostic assessment of surface geometry after machining medium carbon steel C45 and stainless steel based on tool vibration measured
during the machining process was the subject
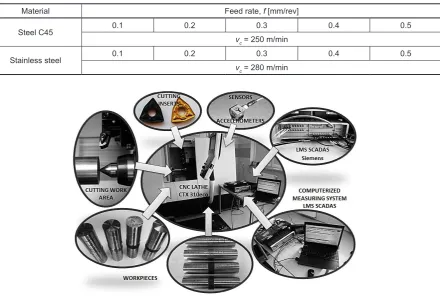
of this study. Rollers dw = 50 mm in diameter and l = 200 mm in length served as workpiece. The research was conducted in The Center for the Study of Engineering in The State School of Higher Education in Chelm with the use of a CNC CTX 310 eco machine. The tests were conducted for several machining parameters collated in Table 1 and the test bed setup is pre-sented in Figure 1.
Table 1. Technological machining parameters
Material Feed rate, f [mm/rev]
Steel C45 0.1 0.2 0.3 0.4 0.5
vc = 250 m/min
Stainless steel 0.1 0.2 0.3 0.4 0.5
vc = 280 m/min
Tools used for the study were turning tools with interchangeable inserts dedicated to materi-als used as samples in the tests. A WNMG 08 04 08-PM 4225 insert was used in the case of C45 steel and for the stainless steel a WNMG 08 04 08-MR 2025 insert was applied. The inserts were placed in a Coro Turn RC DWLNL 2020K08 rigid clamp. Siemens MS Scadas data acquisition hard-ware was used for recording vibration in the pro-cess. Piezo-electric tri-axis vibration sensor PCB Piezotronic was used in the research. Experimen-tal tests were repeated four times for each set of machining parameters with the aim of assessing repeatability of measurements. The surface anal-ysis was conducted using the Sz parameter for 3D
surface roughness analysis, which is defined as
10-point surface height. The surface geometry of the machined workpiece is rather complex, there-fore, its analysis requires advanced measurement tools. An example of 3D surface structure after machining is shown in Figure 2.
Additionally, the Sz parameter was included in the tests due to a distinct connection to the re-maining parameters measured. The Sz parameter
provides information on the height of irregular-ity of surface and is resistant to random peaks and valleys along the sample. The parameter also demonstrated a clear correlation with Sa and Sq
parameters based on the character of surface or-dinates distribution. Sz parameter seems to be characterised by great generalising properties (is strongly correlated with other surface and volu-metric parameters). Alicona IF was used for the measurement of 3D surface roughness parameters.
RESULTS AND ANALYSIS
Vibration levels and their influence on stereometry during C45 steel machining
In the course of the conducted tests, time his-tory of cutting tool vibration acceleration during machining in three perpendicular directions (X,
Y, Z) defined in Figure 3 were registered. A co -ordinate system oriented in this manner applies to vibration measurement and results from the position of the sensor and the tool in the turret.
Fig. 2. An example of 3D surface structure after machining [17]
Fig. 3. Cutting stand: a) CNC working space, b) vibration directions measurement during turning
The system is independent of commonly applied numerically controlled axis positioning system of the analysed machine.
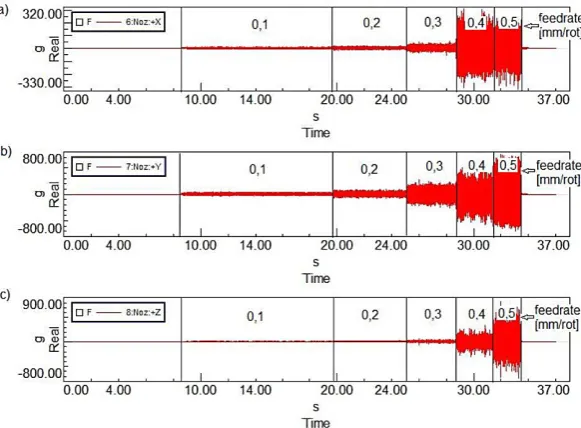
Figures 4–6 are a graphic representation of selected test results. Exceptionally interesting results were obtained in the Z axis direction (thrust force direction), where increasing values of the force should result in decreasing vibra-tions. Figure 4 shows time history of the cut-ting tool vibration acceleration during C45 steel
machining in axes X, Y, Z defined in Figure 3.
Based on the registered vibrations time history, it was found that feedrate demonstrates repeated,
unequivocal influence on vibrations amplitude. Vibration increase has been observed both during
machining high-quality constructional steel C45
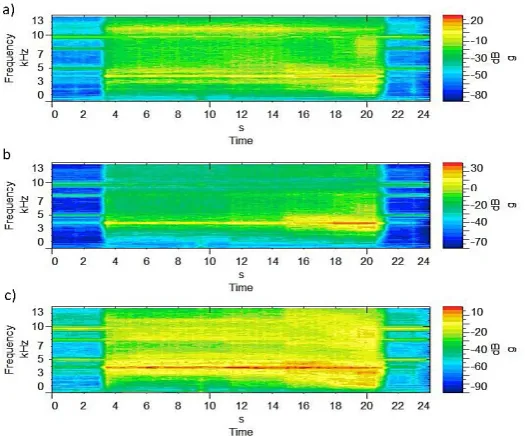
(Figs. 4–5) and stainless steel (Figs. 8–9). Figure 5 presents results of cutting tool vibration time-frequency analysis in the form of spectrograms, for the X, Y and Z axes respectively. The spec-trograms presented in the form of coloured maps
display areas of accelerated vibrations of specific amplitudes at specific frequencies, derived from
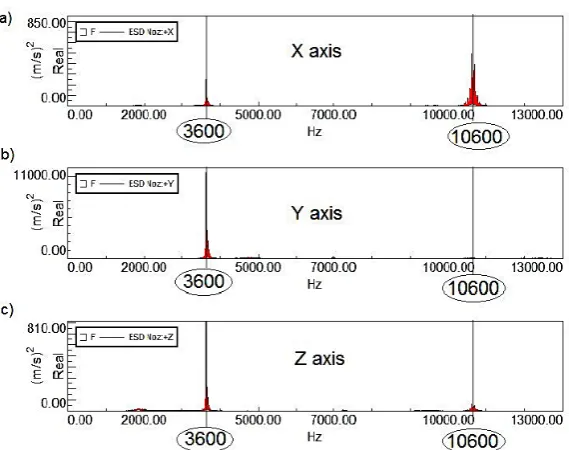
time history of vibration acceleration registered in tests. Figure 6 depicts distribution of energy density of the cutting tool vibration signal during C45 steel machining, with a characteristic peak of vibration energy concentration at approximately 3.7 kHz. The peak (Fig. 6) was detected for all measured axes and equals to maximum vibra-tions value 30 dB. The characteristic peaks at 3.7 kHz are a result of self-induced vibrations.
Fig. 4. Time history of cutting tool vibration during C45 steel machining for: a) X axis spectrogram, b) Y axis spectrogram, c) Z axis spectrogram
Fig. 6. Distribution of energy density of cutting tool vibration signal during C45 steel machining: a) for X axis, b) for Y axis, c) for Z axis
All conducted tests indicate that the Y axis, which is parallel to the cutting speed vector, is characterised by highest vibration values. This is caused by the highest value of the cut-ting force main component accut-ting in that direc-tion. The force function of the main component caused the highest value of the registered am-plitude. In the case of C45 steel comparable vi-bration values were observed for both X (along the feedrate direction) and Z axis (thrust force
direction). Vibrations in the Z axis (thrust force)
direction seem interesting with regards to post machining surface condition. In the case of C45 steel vibrations in this axis are concentrated mainly at 3.7 kHz and are equal to 10 dB (with highest federate value f = 0.5 mm/rev). Table 2 collates the surface stereometry
measure-ment results described with the 3D roughness parameter Sz. Vibrations were expressed using
the RMS vibration acceleration expressed in g
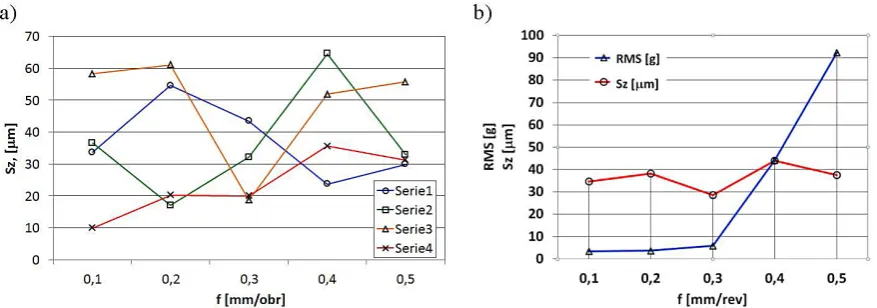
(grams). Table 2 indicates that in the case of C45 steel, surface roughness Sz increases as a function of feedrate from 14.98 mm (with f = 0.1 mm/rev) up to 37.81 mm (with f = 0.5 mm/ rev) (Fig. 7a). An almost linear RMS vibration acceleration increase 14.98 g to 37.81 g implies an increase in surface roughness. It needs to be emphasised that increasing federate f values
significantly influence roughness values.
Figure 7b implies various Sz surface rough-ness increase rates as a function of feedrate and RMS vibration acceleration. Test results have demonstrated a linear correlation of the analysed parameters as a function of feedrate f.
Table 2. Measurement results for specified machining parameters of C45 steel machining
Machining parameters C45 steel
Feedrate, f [mm/rev] 0.1 0.2 0.3 0.4 0.5
RMS vibration acceleration, [g] 5.3 7.6 9.2 9.6 11
Roughness, Sz [μm] 14.98 20.05 23.23 30.39 37.81
Cutting speed, vc[m/min] vc= 250 m/min
Stainless steel
Feedrate, f [mm/rev] 0.1 0.2 0.3 0.4 0.5
RMS vibration acceleration, [g] 3.4 3.6 5.8 44.1 92.3
Roughness, Sz [μm] 34.61 38.23 28.58 43.95 37.45
ing stainless steel machining, whereas Figure 10 shows distribution of energy density of the cut-ting tool vibration acceleration signal. In the case of stainless steel the vibration acceleration am-plitude in the Z axis direction was clearly higher compared with the X axis direction and compa-rable with the vibration acceleration across the Y axis. Based on the stainless steel tests, distinctly higher level of vibration was measured compared to high-quality steel C45 (Fig. 8). Maximum val-ues were observed across the Y axis and equalled approximately 50 dB at 3.6 kHz and f = 0.5 mm/ rev. The conducted time-frequency analysis of the cutting tool vibration signal during stainless steel machining revealed a characteristic peak at 3.6 kHz and for 10.6–10.7 kHz of the X axis.
Compared with C45, the peak found during stainless steel tests occurs at slightly lower
fre-Evaluation of vibration values and their influence on surface stereometry during stainless steel machining
Contrary to the results presented in literary sources, also stainless steel (similarly to C45) demonstrated growing changes in vibration accel-eration amplitude as a function of feedrate, for all
measurement axes defined in Figure 3, namely X,
Y and Z (Figs. 8–9). Figure 8 shows time history of cutting tool vibration acceleration registered dur-ing stainless steel machindur-ing in three analysed axes X, Y and Z. During the tests it was discovered that vibrations in the direction (Z) of the thrust force
prove to influence the surface geometric structure
after machining to the largest extent.
Figure 9 presents results of time-frequency analysis of cutting tool vibration acceleration
dur-Fig. 7.Sz and RMS vibration acceleration parameters during C45 steel machining as a function of feedrate f: a) Sz value changes over 4 measurements, b) comparison of Sz and RSM vibration acceleration
quency equal 3.6 kHz (presenting highest val-ue for the Y axis at 50 dB). In the X axis (along the feedrate direction) an additional peak can be observed at approximately 10.6–10.7 kHz which equals 40 dB, also visible for the Z axis (the thrust force direction) mainly with f = 0.4 equal to approximately 20 dB. In the case of stainless steel, the main peak was observed at
3.5 kHz and is equal to 40 dB (f = 0.5) and
10.6–10.7 kHz amounting to 20 dB (f = 0.4).
The observed peaks are most likely a result of self-induced vibration.
In the surface stereometry tests, the obtained surface roughness parameters presented consider-ably higher values than in the case of C45 steel (comparison of Fig. 7a and Fig. 11a). The Sz spa-tial roughness adopted maximum values amount-ing to 50–60 mm (Fig. 11a) in partial tests. Figure 11a indicates a great scatter of Sz values and a lack of a distinct tendency in each test run, which
Fig. 9. Results of cutting tool vibration time-frequency a nalysis during machining stainless steel: a) X axis spectrogram, b) Y axis spectrogram, c) Z axis spectrogram
is completely different from the one observed for C45 steel (Fig. 7a). Lack of roughness change ten-dency is partly a result of slight changes in RMS cutting tool vibration acceleration within a range of feed values f (0.1–0.3 mm/rev). The vibration system is also relatively insensitive to changes in feed rate. Only highest values f = 0.4–0.5 mm/rev induced a sudden surge in RMS vibration accel-eration values (Fig. 11b).
CONCLUSIONS
Based on conducted experimental tests a lin-ear dependence of RMS vibration acceleration and Sz roughness of the C45 constructional car-bon steel workpiece as a function of f feed can be observed. A changing intensity in roughness and RSM vibration acceleration increase as a function of f (different slopes of a curve depicting the dis-cussed parameters – different slopes of a straight line) was found. Nevertheless, the obtained characteristics are unambiguous, linear and eas-ily forecasted. Simultaneously, a strong scatter of results was observed for 3D structure of the workpiece surface Sz in stainless steel samples (as opposed to C45 steel). A lack of an increasing trend for RMS vibration acceleration as a func-tion of f was identified for the f range amounting to f = 0.4–0.5 mm/rev and a significant increase
in RMS vibration acceleration for higher f values (f = 0.4–0.5 mm/rev). The analysis of energy den-sity distribution of the cutting tool vibrations sig-nal during C45 steel machining and stainless steel demonstrated characteristic peaks at frequencies equal to 3.7 kHz (for C45 steel) and 3.6 kHz and 10.6–10.7 kHz (for stainless steel), which are a re-sult of self-induced vibrations. Much higher
val-ues of vibration amplitude were revealed during stainless steel machining, which seems to result from material properties (mainly strength) as well as stainless steel machining resistance. This work presents graphic representation of the time-fre-quency analysis of cutting tool vibrations during C45 steel and stainless steel machining, which
al-low easy identification of amplitude and frequen -cy vibration components dominant in the time history. Workpiece surface condition diagnostics based on cutting tool vibration is a relatively ef-fective method when active machining process monitoring is concerned. However, it requires advanced measuring tools and programmes for the analysis of the obtained vibrations spectra and for estimating reliable parameters. Collect-ing and storCollect-ing the data in a knowledge base may allow a quick and precise measurement of the surface state at the stage of production system design. Consequently, it would allow effective development of a technology which would mi-nimise the number of defective units in produc-tion. The conducted tests prove a dependence of geometric characteristics of surface parameters on vibrations level. The conducted tests also in-dicate the need of further analysis of other
fac-tors influencing surface roughness, which need
to be taken into consideration in modelling and developing diagnostic systems with the aim of
separating their influence on surface geometry
and vibration levels.
REFERENCES
1. Galewski M., Nadzorowanie drgań podczas frezo-wania szybkościowego smukłymi narzędziami z wykorzystaniem zmiennej prędkości obrotowej wrzeciona. Rozprawa doktorska, Gdańsk, 2007.
2. Józwik J., Kobyłka M., Badanie wpływu parametrów geometrycznych kieSzeni prostokątnej oraz warunków realizacji procesu skrawania
na drgania podczas frezowania trochoidalnego.
Postępy Nauki i Techniki, 8, 2011, 37–44.
3. Jemielniak K., Wypysiński R., Symulacja num
-eryczna drgań samowzbudnych – przegląd metod, możliwości i potencjalnych korzyści, Mechanik
8-9, 2013, 43–56.
4. Józwik J., Modelowanie ugięć sprężystych przed -miotów obrabianych w procesie skrawania
tocze-niem, Postępy Nauki i Techniki, 8, 2011, 183–191.
5. Józwik J., Lipski J., Błędy obróbki skrawaniem i
ich prognozowanie z wykorzystaniem Sztucznych sieci neuronowych. Wyd. Politechnika Lubelska, Lublin 2014.
6. Józwik J., Filipiak P., Analysis of feedrate
correc-tion influence on corner radius errors of workpiec -es during milling, Journal of Machine Engineering, 9(1), 2009, 66–77.
7. Kęcik K., Rusinek R., Warminski J., Modelling of
high-speed milling process with frictional effect, Journal of Muti-body Dynamics, Proceedings of the Institution of Mechanical Engineers Part K, 1(1), 2013, 3–11.
8. Kuczmaszewski J., Pieśko P., Wear of milling cut-ters resulting from high silicon aluminium alloy cast AISi21 CuNi machining. Maintenance and Reliability, 1(16), 2014, 37–41.
9. Kuczmaszewski J., Pieśko P., Włodarczyk M.,
Milling of thin-walled aviation elements – analysis
of the model and verification tests, [In:] 6th
Inter-national Conference – Supply on the
Wings-Aero-space – the Global Innovation Driver, Frankfurt – Germany, 2011, 25–25.
10. Pieśko P., Zagórski I., Analiza dokładności obróbki frezami trzpieniowymi o zmiennej Sztywności tu
-lei cienkościennych wykonanych z stopu AlMn1. [W:] A. Świć (red.) Innowacyjne procesy techno -logiczne, Lublin 2011, 33–46.
11. Rusinek R., Vibrations in cutting process of tita -nium alloy. Maintenance and Reliability, 3, 2010, 48–55.
12. Rusinek R. Warmiński J., Szabelski K., Drga -nia nieliniowe w procesie skrawa-nia toczeniem.
Monografia. IZT Sp. z.o., Lublin 2006.
13. Słodki B., Zębala W., Stanowisko do rejestracji ob -razów szybkozmiennych w procesach skrawania.
[W:] H. Latoś (red.) Obróbka skrawaniem zaawa -nsowana technika. Wyd. Uczelniane Uniwersytetu Technologiczno-Przyrodniczego, Bydgoszcz 2009, 215–220.
14. Szydłowski M., Powałka B., Berczyński S., Stanowisko badawcze do wizyjnej inspekcji powi
-erzchni obrobionej. Mechanik 8-9, 2013, 439–446.
15. Zębala W., Minimalizacja błędów obróbki przed
-miotów cienkościennych. Inżynieria Maszyn,
15(3), 2010, 45–54.
16. Józwik J.: Analiza ruchu podczas obróbki
frezar-skiej przedmiotów cienkościennych z zastoso
-waniem wizyjnego systemu pomiarowego 3D.
Mechanik, 8-9, 2014, 551–562.
17. Kacalak W., Szafraniec F., Kunc R. Remelska H.: Zastosowanie teorii fraktali do tworzenia i
![Fig. 2. An example of 3D surface structure after machining [17]](https://thumb-us.123doks.com/thumbv2/123dok_us/8809473.1776447/3.595.97.504.601.756/fig-example-d-surface-structure-machining.webp)