Effect of marker density and trait heritability on the accuracy of genomic
prediction over three generations
N. Gorgani Firozjah, H. Atashi
*, M. Dadpasand and M. J. Zamiri
Department of Animal Science, Shiraz University, Shiraz, Iran.
* Corresponding author, E-mail address: [email protected]
Abstract The aim of this study was to determine the effect of marker density, level of heritability, number of QTLs, and size of training set on the genomic accuracy over three generations. Thereby, a trait was simulated with heritability of 0.10, 0.25 or 0.40. For each animal, a genome with 20 chro-mosomes, 1 Morgan each, was simulated. Different marker densities (2000, 4000 and 6000 markers) and 400 and 600 randomly distributed QTLs were simulated. Marker density, size of training set, and heritability level significantly affected the genomic accuracy (P< 0.05). Increasing the marker density from 4000 to 6000 did not affect the genomic accuracy, likewise there was no difference between genomic accuracy of the first, and second validation sets (generations 8 and 9). The results showed that 4000 markers may be appropriate for genomic evaluation, and that the estimated marker effects can be used for at least two subsequent generations although the marker effects should be re-esti-mated for the third generation.
Keywords: marker density, heritability, genomic breeding value
Received: 17 Aug. 2014, accepted: 3 Oct. 2014, published online: 12 Nov. 2014
Introduction
Genomic selection was first introduced in 1998 (Visscher and Haley, 1998), then its methods and prin-ciples were presented by Meuwissen et al.(2001). Ge-nomic evaluation is carried out in two steps: (a) estimat-ing the effect of marker on a particular trait in the train-ing set (population havtrain-ing phenotypic records); (b) pre-dicting the genomic breeding values for animals in the validation set (population without phenotypic records). This method relies on computing genomic estimated breeding values (GEBV) using a large number of single nucleotide polymorphism (SNP) markers. The accuracy of genomic predictions depends on the level of linkage disequilibrium (LD) between the markers and QTLs, number of animals in the reference population, herita-bility of the trait, and distribution of QTLs (Hayes et al., 2009). Marker density panel is one of the most im-portant factors affecting accuracy of genomic prediction (Solberg et al., 2008; Habier et al., 2009; Meuwissen, 2009; Weigel et al., 2009). In genomic selection, all ge-netic variance is explained by the markers which are scattered in the whole genome. Genomic selection can reduce the costs of genetic evaluation and increase ge-netic improvement by reducing the generation interval and increasing the accuracy of selection (Scheffer, 2006; Hayes et al., 2009). Even though the advancement inmoleculartechnologymakesitpossibleto use these
high-density SNP markers in genomic selection, the high cost of genotyping a large population prevents the broader implementation of genomic selection in many livestock species including the native cattle breeds. The solution is to reduce genomic evaluation costs through reducing the number of markers, reducing the number of animals that should be genotype (reducing the size of the reference population), using the estimated markers effects for two or more generations, and finally a com-bination of the items expressed. The present simulation study was carried out to investigate the effect of number of markers (2000, 4000, and 6000), level of heritability (0.10, 0.25, and 0.40), number of QTLs (400 and 600), and size of the training set (1000 and 2000) on the ge-nomic accuracy over three generations.
Materials and Methods
Simulation
54 ration 2020 to create the linkage disequilibrium(LD) in the historical population. The number of individuals of both sexes were remained the same and the mating sys-tem was based on random union of gametes randomly sampled from male and female gametes pools.
In the next step, a population (the expanded population) was generated using randomly selected 300 founders (150 males and 150 females) from the last generation of the historical population. To enlarge the population, 10 generations were simulated with five offspring per dam and an exponential growth of the number of dams. The mating system was based on the random union of gam-etes with no selection. Subsequently, 40 males and 2000 females from the last generation of the expanded popu-lation were randomly mated to generate another 10 gen-erations. Individuals of the training set (1000 and 2000 individuals) were randomly selected from the 6th and 7th generations. The validation set were all individuals from the generations eight, nine and ten.
For each animal, a genome with 20 chromosomes, 1 Morgan each, was simulated. Three marker density pan-els (2000, 4000, and 6000 markers) were simulated with equal allelic frequency in the first generation of the his-torical population. The markers were randomly scat-tered across the genome, and none of the markers di-rectly affected the trait. A total of 400 and 600 QTLs were randomly distributed among the markers. Effects at the QTLs were sampled from a gamma distribution with shape 0.4.The mutation rate of the markers and QTLs was assumed 2.5 × 10⁻⁵ per locus per generation
(Solberg et al., 2008).
A trait with heritability of 0.10, 0.25 or 0.40 and pheno-typic variance of 1.0 was simulated. The true breeding value (TBV) of each individual was equal to the sum of the QTL allele substitution effects, assuming only addi-tive QTL effects. Phenotypes were generated by adding residuals, randomly drawn from a normal distribution with mean equal to zero, to the TBVs. For all scenarios, 10 replicates were simulated.
Statistical model
Prediction of marker effects
The following ridge regression BLUP model which is a popular approach for estimating the marker effects in genomic evaluations (Meuwissen et al., 2001; Habier et al., 2007) was used to estimate SNP effects using a pro-gram written in the R software (R Development Core Team, 2011).
𝐲 = 𝟏µ + 𝐗`𝐠 + 𝐞
where, y is the vector of phenotypes values, μ is the overallmean, X isthe matrix of marker genotypes for
each animal (the SNP genotypes were coded as the num-ber of copies of one SNP allele, i.e. 0, 1 or 2), g is the vector of marker effects, and e is a vector of random er-rors with distribution of N(0, σe2). No additional infor-mation, such as marker location, polygenic effects, or pedigree was used in the model.The mixed model equa-tion used to estimate the markers effects was:
[𝟏𝐧
`𝟏
𝐧 𝟏𝐧`𝐗
𝐗`𝟏
𝐧 𝐗`𝐗 + 𝐈𝛌
] [𝛍̂ 𝐠̂] = [
𝟏𝐧`𝐲
𝐗`𝐲]
where, X is the matrix of marker genotypes for each an-imal, I is an identity matrix (total number of marker × total number of markers), λ is the ridge regression factor
= σe2 σg2, σe
2 is the residual variance, σ g
2 is variance common
to each marker effect = σa
2
2 ∑ni=1piqi
and n is the total
num-ber of markers (Meuwissen et al., 2001; Habier et al., 2007).
Once the marker effects were estimated, the GEBV was computed for the animals in the validation set as:
𝐆𝐄𝐁𝐕 = 𝐗𝐠̂, in which, X is the matrix of marker
geno-types for each animal, and 𝐠̂ is the vector of estimated marker effects. The accuracy of GEBV was calculated as the correlation between GEBVs and TBVs.
The effects of heritability levels, marker density panels, and the number of QTLs on the accuracy of genomic predictions over three subsequent generations were evaluated using PROC GLM, and the average accura-cies of GEBV were compared using the least squares means (LSM) procedure at P<0.05 (SAS, 2003).
Linkage Disequilibrium
The linkage disequilibrium (LD) measure r2, square of
the correlation of alleles at two loci, was used for meas-uring LD (Hill and Robertson 1968).
r2 = D
2
f(A) f(a) f(B) f(b)
where, D = f(AB) − f(A) f(B), and f(AB), f(A), f(a), f(B), f(b) are observed frequencies of haplotypes AB and of alleles A, a, B, b, respectively.
Results and Discussion
On average, 756 (37.8%) of 2000, 1506 (37.7%) of 4000, and 2260 (37.7%) of 6000 markers were polymor-phic (MAF > 0.05) in the recent generations, while the corresponding values for QTLs were 160.50 (40.1%) out of 400 and 241.60 (40.3%) out of 600.
55
Table 1. The estimated genomic accuracy (SE) for a training set of 1,000, three marker density panels, and two levels of QTLs over three subsequent generations
Generation 8 9 10
QTL 400 600 400 600 400 600
Marker density panels
2000 34.3(0.78)ab,B 36.7(0.78)a,A 31.3(0.78)bc,B 33.3(0.78)abc,A 30.1(0.78)c,B 31.1(0.78)bc,A
4000 38.0(0.78)ab,AB 39.3(0.78)a,A 34.8(0.78)bc,AB 35.9(0.78)abc,A 33.0(0.78)c,AB 33.8(0.78)c,A
6000 39.6(0.78)a,A 40.5(0.78)a,A 37.2(0.78)ab,A 37.0(0.78)ab,A 34.4(0.78)b,A 34.7(0.78)b,A
Different capital letters indicate significant differences (P < 0.05) within columns. Different small letters indicate significant differences (P < 0.05) within rows.
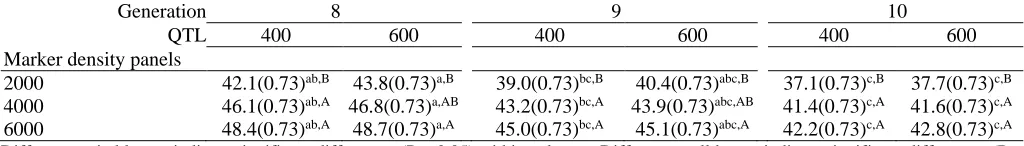
Table 2. The estimated genomic accuracy (SE) for a training set of 2,000, three marker density panels, and two levels of QTLs over three subsequent generations
Generation 8 9 10
QTL 400 600 400 600 400 600
Marker density panels
2000 42.1(0.73)ab,B 43.8(0.73)a,B 39.0(0.73)bc,B 40.4(0.73)abc,B 37.1(0.73)c,B 37.7(0.73)c,B
4000 46.1(0.73)ab,A 46.8(0.73)a,AB 43.2(0.73)bc,A 43.9(0.73)abc,AB 41.4(0.73)c,A 41.6(0.73)c,A
6000 48.4(0.73)ab,A 48.7(0.73)a,A 45.0(0.73)bc,A 45.1(0.73)abc,A 42.2(0.73)c,A 42.8(0.73)c,A
Different capital letters indicate significant differences (P < 0.05) within columns. Different small letters indicate significant differences (P < 0.05) within rows.
(2000, 4000 and 6000), different number of QTLs (400 and 600), different levels of heritability (0.10, 0.25, and 0.40), and different sizes of training sets (1000 and 2000), over three subsequent generations were investi-gated. With increasing size of the training set, from 1000 to 2,000 individuals (P<0.05), the average ge-nomic accuracy increased from 35.3 (0.19) to 43.1% (0.19) which is in a close agreement with previous re-ports (Meuwissen et al., 2001; Callus and Veerkamp 2007). Increasing the number of markers from 2,000 to 6000 increased the average genomic accuracy from 33.8 (0.32) to 37.3% (0.32) with a training set of 1000 indi-viduals,andfrom40 (0.30) to 45.4%(0.30) with a tra-
ining set of 2000 individuals. Solberg et al. (2008) re-ported that for population with an effective size of 100, training set of 1000 and a heritability of 0.50, the accu-racy of genomic predictions increased from 0.69 to 0.86 as marker density increased from 100 to 800 markers per Morgan. Although with increasing marker density from 2000 to 4000 the accuracy of genomic evaluation increased (P<0.05), but increasing marker density from 4000 to 6000, did not affect the genomic accuracy (P≥0.05).
Increasing the number of QTLs from 400 to 600 in-creased the average genomic accuracy from 34.7 (0.26) to35.8 %(0.26) withatraining set of 1000 individuals,
Table 3. The estimated genomic accuracy (SE) for a training set of 1,000, three marker density panels, and three levels of heritability over three subsequent generations
Generation 8 9 10
h2 0.10 0.25 0.40 0.10 0.25 0.40 0.10 0.25 0.40
Marker density panels
2000 29.0(0.96)cde,A 36.7(0.96)ab,B 40.7(0.96)a,B 27.4(0.96)de,A 33.8(0.96)bc,B 35.7(0.96)ab,B 26.3(0.96)e,A 32.0(0.96)bcd,B 33.6(0.96)bc,B
4000 31.6(0.96)de,A 40.3(0.96)ab,AB 44.0(0.96)a,AB 28.9(0.96)ef,A 37.3(0.96)bc,AB 39.9(0.96)ab,AB 26.3(0.96)f,A 34.2(0.96)cd,AB 39.7(0.96)ab,A
6000 31.6(0.96)d,A 42.6(0.96)ab,A 46.1(0.96)a,A 28.7(0.96)de,A 39.6(0.96)bc,A 43.0(0.96)ab,A 26.3(0.96)e,A 37.5(0.96)c,A 39.9(0.96)bc,A
Different capital letters indicate significant differences (P < 0.05) within columns. Different small letters indicate significant differences (P < 0.05) within rows.
Table 4. The estimated genomic accuracy (SE) for a training set of 2,000, three marker density panels, and three levels of heritability over three subsequent generations
Generation 8 9 10
h2 0.10 0.25 0.40 0.10 0.25 0.40 0.10 0.25 0.40
Marker density panels
2000 36.6(0.9)cde,A 43.5(0.9)b,B 48.7(0.9)a,B 34.4(0.9)de,A 41.0(0.9)bc,B 43.6(0.9)b,B 32.9(0.9)e,A 38.7(0.9)cd,B 40.6(0.9)bc,B
4000 39.6(0.9)de,A 48.1(0.9)ab,AB 51.7(0.9)a,AB 37.0(0.9)ef,A 46.0(0.9)bc,A 47.6(0.9)abc,AB 34.5(0.9)f,A 43.2(0.9)cd,AB 46.8(0.9)bc,A
6000 40.2(0.9)d,A 51.3(0.9)ab,A 54.1(0.9)a,A 36.9(0.9)de,A 47.4(0.9)bc,A 50.9(0.9)ab,A 34.8(0.9)e,A 45.4(0.9)c,A 47.5(0.9)bc,A
56
Table 5. The estimated genomic accuracy (SE) for atraining set of 1,000, two levels of QTLs and three levels of heritability over three subsequent generations
Generation 8 9 10
QTL 400 600 400 600 400 600
h2
0.10 29.2(0.78)ab,C 32.3(0.78)a,B 26.9(0.78)bc,B 29.7(0.78)ab,B 25.3(0.78)c,B 27.3(0.78)bc,B
0.25 39.2(0.78)a,B 40.5(0.78)a,A 36.7(0.78)ab,A 37.1(0.78)ab,A 34.5(0.78)b,A 34.6(0.78)b,A
0.40 43.5(0.78)ab,A 43.7(0.78)a,A 39.7(0.78)bc,A 39.5(0.78)c,A 37.7(0.78)c,A 37.7(0.78)c,A
Different capital letters indicate significant differences (P < 0.05) within columns. Different small letters indicate significant differences (P < 0.05) within rows.
and from 42.7 (0.24) to 43.4% (0.24) with a training set of 2000 individuals. According to Zhang et al. (2011), genomic accuracy increased slightly as the number of QTLs increased. There was a significant difference be-tween genomic accuracies of the eighth and tenth gen-erations (P< 0.05), but no differences were recorded be-tween the eighth and ninth generation, which is in close agreement with previous studies (Meuwissen et al., 2001; Habier et al., 2007). Increasing the level of herit-ability from 0.10 to 0.40 increased the average genomic accuracy from 36.3 (0.30) to 47.9% (0.30) with a train-ing set of 2000 individuals, and from 28.5 (0.32) to 40.3% (0.32) with a training set of 1000 individuals. For heritability values of 0.10 and 0.50, genomic accuracies of 48% and 67% (Callus et al., 2008) and 40% and 70% (Saatchi et al., 2010) were reported. Hayes et al. (2009) reported that with traits of low heritability, more pheno-typic records in the training setwere needed to obtain a certain level of genomic accuracy. The least squares means of genomic accuracy in different marker panels and different numbers of QTLs over three generations are presented in Table 1 (training set of 1000 individu-als) and Table 2 (training set of 2000 individuindividu-als). With the training set of 2000, and for both QTL densities, creasing the marker number from 2000 to 6000, in-creased the genomic accuracy, but not with the training set of 1000 and 600 QTLs (P ≥ 0.05). Goddard (2009) reported that with a large number of QTLs, each one having a small effect, a large number of individuals in the training set are required to estimate the marker ef-fects with high accuracy.
Theleastsquaresmeansofthe genomic accuracy under
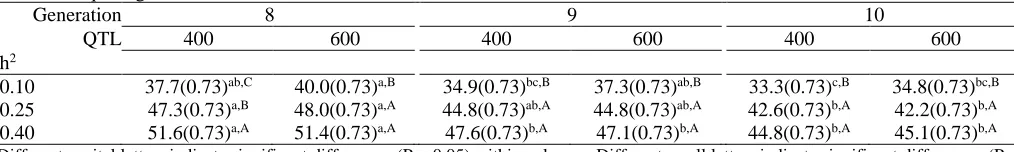
different marker density panels and heritability levels, and over three generations are presented in Table 3 (with a training set of 1000 individuals) and Table 4 (with a training set of 2000 individuals). Under all situ-ations, the average genomic accuracy increased when heritability values increased from 0.10 to 0.40, (P< 0.05). With heritability values of 0.25 and 0.40, but not 0.10, increasing the number of markers from 2000 to 6000, significantly increased the average genomic accu-racy. The least squares means of the genomic accuracy for different QTL number, different heritability level, and over three generations are presented in Table 5 (training set of 1000 individuals) and Table 6 (training set of 2000 individuals). Under different QTL densities, increasing the heritability increased the average ge-nomic accuracy (P<0.05) which is in a close agreement with Zhang et al. (2011).
The results of this study showed that increasing the marker density to 4000, improved the genomic accuracy for traits with high and moderate heritability, but not for low heritable traits. On the other hand, there was no dif-ference between the genomic accuracy estimates of the first and second validation sets (generations eight and nine). Therefore, it seems that 4000 markers maybe suf-ficient for genomic evaluation where the estimated marker effect scan be used for at least two subsequent generations; however, the marker effects needs to be re-estimated for the third generation.
References
Calus, M.P.L., Veerkamp, R.F. 2007. Accuracy of breeding values when using and ignoring the polygenic effect in
gen-Table 6. The estimated genomic accuracy (SE) for atraining set of 1,000, two levels of QTLs and three levels of heritability over three subsequent generations
Generation 8 9 10
QTL 400 600 400 600 400 600
h2
0.10 37.7(0.73)ab,C 40.0(0.73)a,B 34.9(0.73)bc,B 37.3(0.73)ab,B 33.3(0.73)c,B 34.8(0.73)bc,B
0.25 47.3(0.73)a,B 48.0(0.73)a,A 44.8(0.73)ab,A 44.8(0.73)ab,A 42.6(0.73)b,A 42.2(0.73)b,A
0.40 51.6(0.73)a,A 51.4(0.73)a,A 47.6(0.73)b,A 47.1(0.73)b,A 44.8(0.73)b,A 45.1(0.73)b,A
57
omic breeding value estimation with a marker density of one SNP per cM. Journal of Animal Breeding and Genetics 124, 362-368.
Calus, M.P.L., Meuwissen, T.H.E., De Roos, A. P. W., Veer-kamp, R. F. 2008. Accuracy of genomic selection using dif-ferent methods to define haplotypes. Genetics 178, 553-561.
Goddard, M.E. 2009. Genomic selection: Prediction of accu-racy and maximisation of long term response. Genetica 136, 245-257.
Habier, D., Fernando, R.L., Dekkers, J.C.M. 2007. The im-pact of genetic relationship information on genome-assisted breeding values. Genetics 177, 2389–2397.
Habier, D., Fernando, R.L., Dekkers, J. C. M. 2009. Genomic selection using low-density marker panels. Genetics 182, 343–353.
Hayes, B.J., Bowman, P.J., Chamberlain, A.J., Goddard, M.E. 2009. Invited review: Genomic selection in dairy cat-tle: Progress and challenges. Journal of Dairy Science 92, 433-443.
Hill, W.G., Robertson, A. 1968. Linkage disequilibrium in fi-nite populations. Theoretical and Applied Genetics 38, 226-231.
Meuwissen, T.H.E. 2009. Accuracy of breeding values of un-relatedindividuals predicted by dense SNP genotyping. Ge-netics Selection Evolution 41, 35.
Meuwissen, T.H.E., Hayes, B.J., Goddard, M.E. 2001. Pre-diction of total genetic value using genome-wide dense marker maps. Genetics 157, 1819-1829.
R Development Core Team. 2011. R: A Language and Envi-ronment for Statistical Computing. R Foundation for Statis- tical Computing, Vienna, Austria.
Saatchi, M., Miraei-Ashtiani, S.R., Nejati-Javaremi, A., Mo-radi-Shahrebabak, M., Mehrabani-Yeghaneh, H. 2010. The impact of information quantity and strength of relationship between training set and validation set on accuracy of ge-nomic estimated breeding values. African Journal of Bio-technology 9, 438-442.
Sargolzaei, M., Schenkel, F.S. 2009. QMSim: a large-scale genome simulator for livestock. Bioinformatics 25, 680-681.
SAS. 2003. User’s Guide: Statistics, Version 9.1 Edition. Inst., Inc., Cary, NC.
Schaeffer, L.R. 2006. Strategy for applying genome-wide se-lection in dairy cattle. Journal of Animal Breeding and Ge-netics 123, 218-223.
Solberg, T.R., Sonesson, A.K., Woolliams, J.A., Meuwissen, T.H.E. 2008. Genomic selection using different marker types and densities. Journal of Animal Science 86, 2447-2454.
Visscher, P.M., Haley, C.S., 1998. Strategies for marker-as-sisted selection in pig breeding programs. In: Proceedings of the 6thWorld Congress on Genetics Applied to Livestock Production. Australia 23, 503-510.
Weigel, K.A., de los Campos, G., Gonzalez-Recio, O., Naya, H., Wu, X.L., Long, N., Rosa, G.J.M., Gianola, D. 2009. Predictive ability of direct genomic values for lifetime net merit of Holsteinsires using selected subsets of single nu-cleotide polymorphism markers. Journal of Dairy Science 92, 5248-5257.
Zhang, Z., Zhang, Q., Ding, X. 2011. Advances in genomic selection in domestic animals. Chinese Science Bulletin 56, 2655-2663.
58
رگناشن مکارت رثا
و
تثارو
باختنا تحصرب یریذپ
یلاوتم لسن هس رد کیمونژ
ن
.
ه ،هاجزوریف یناگرگ
ـ
.
یشتآ
*م ،
.
دنسپداد
و
م
.
ج
یریمض .
:کینورتکلا تسپ ،لوئسم هدنسیون
هدیکچ ارث ر ریث تییسررب ،شهوژپ نیا فده
رارو تویفتم فتمییس ،ر،نیییشن تویفتم ییه هزادنا شیازفا ،یریذپ
ی
ارث ،ادیدنی ی عمج تویفتم ییه
QTL
یییص رب ، تپ یییپن سیییس رد ک متنژ تبییزرا
رد دتب تپ . یب فیییص کی
رارو یریذپ 01 ، 52 و 01 س یب دیصرد یزیس
دب . کی نات ح ره یارب متنژ
51 هزادنا یب و تمزتمور ی
51 نیگرتم ره(
س یب )نیگرتم کی مزتمور یزیس
.دب ریمب ر،نیشن ،متنژ رد یه 5111
، 0111 و 0111 و سلصیف نآ ن ب ی یه سب ب ثرث کی ،
2 / 1 و 33 / 1 تتنییس نیگرتم ریمیب .دتب
QTL
،یه 011 و 011 دب ستفرگ رظن رد ب س
س سنتگ ی تفدیصث متنژ لتط رد عیزتث
ییب د دن رارو ،یهر،نیییشن ارث . هزادنا و یریذپ
زرا دروآرب ییص تیعبرم نیرتم ن ،نی م رب عجرم عمج ی ییه
د تییباد ر ریث ک متنژ تحیییصا
(P < 0.05)
فیی . ست زا هدیفتییسا سیح رد یدتنا ییص س داد نیییشن شهوژپ نیا ییه
0111 یی 0111 یپن رد ن نمه و ر،نییشن پن( ادیدنی عمج مود و لوا ییه
ییه 8 و 9 ت عم تویفث ) ر،یدکی یب راد
تم نیاربی ب .د تیبادن زا ناتث
0111 زرا دروآرب یارب ،ر،نییشن ییسد یارب ک متنژ تحییصا ییه
ود عمج( پن