1. Introduction
Forestry includes different activities, such as estab -lishment of the stand, silviculture and maintenance ac-tivities, production of wood material or secondary products, marketing and sales, planning and construc-tion of forest buildings, control of forest fires and pests (i.e., insects, fungi) and recreational activities. One of the most important forestry activities is wood production, which is the main source of income for forest enterpris-es and requirenterpris-es periodic interventions in the forenterpris-est.
Wood production consists of three main stages: cutting/felling, extraction/primary transport and transportation/secondary transport. The process of extraction is technically difficult, ergonomically risky and expensive and includes heavy work that could lead to significant environmental damage (Ünver-Okan 2017). During log extraction, various machinery such as forwarders, skidders, tractors, harwarders, helicopters, balloons and tower yarders, are used (Ibrahimovic 2016). However, expensive machines
Modelling of Work Efficiency in Cable
Traction with Tractor Implementing
the Least-Squares Methods and Robust
Regression
Saliha Ünver-Okan
Abstract
Wood-harvesting activities are conducted by contractors through tendering based on prices determined by the amount of transported wood, land conditions and transport method param-eters. Managers should determine the average completion time of the work and the base price accurately to prevent both work and contractor losses prior to the tender and note the same in the tender contract. Thus, prediction of productivity in wood production is of great importance in the determination of the work duration and cost. In this context, the aim of the present study was to determine the most accurate estimation model that would predict productivity (Pe) based on log volume (Vt), route slope (P) and winching distance (D) in uphill cable skidding activities with a drum tractor. In the current study, estimation models were developed that use both linear regression through SPSS employing all data and the robust regression method that minimizes the effect of outliers. Harvesting units were selected among pure spruce (Picea orientalis (L.) Link) stands via the uphill cable-skidding method with a tractor in the North-East of Turkey. Route slope, winching distance, log volume and time-consumption data were collected in the chosen harvesting units and productivity prediction models were developed with these data. In this study, the productivity estimation was performed using linear regres-sion in SPSS and robust regresregres-sion methods prepared in MATLAB environment. The coef-ficients calculated by these methods were statistically tested, and it was determined that the winching distance coefficient was insignificant with both methods. Thus, the productivity estimation model was re-determined with both methods based on the slope and log volume parameters, and the findings were compared. Additionally, the standard errors of the coeffi -cients of both models were compared and it was concluded that the robust method was more sensitive than the SPSS regression method.
may not be used in countries with less favourable eco-nomic conditions (Blakeney 1992, Wang et al. 2005). In Turkey, where approximately half of the forests are dispersed in areas with a slope higher than 40%, the cable-skidding method with drummed forestry trac-tors is predominantly used uphill, while tower yarders are used occasionally (Acar et al. 2015).
When using the method of cable-skidding with a forestry tractor, the cable on the drum of the forestry tractor, which is fixed roadside, is pulled to the loca -tion of the logs by a worker, tied to a log, and the trac-tor engine pulls the cable to extract the log to the road-side. The utility of the cable-skidding method depends on the presence of a forest road; the maximum winch-ing distance of tractors is between 100 and 120 m (Erdas et al. 2014).
Certain studies report that the main limiting factors surrounding the decision to select the extraction meth-od with a harvesting unit as well as the prmeth-oductivity of the machine are the silviculture, forest operation management, terrain condition, winching distance, tree size and route slope (Akay et al. 2004, Ghaffariyan et al. 2012, Spinelli et al. 2010). These parameters have a negative effect on productivity, especially in uphill extraction operations. Kovácsová and Antalová (2010) emphasized that forests should be operated with op-timum productivity to meet the requirements of both present and future generations.
Wood-production activities are required to be com-pleted within a certain period of time owing to the fact that they are conducted in natural conditions and with living material. As per the forestry regulations in Turkey, wood-logging operations are tendered to contractors with the stumpage sale method or forest villagers based on the unit price. In both cases, the operators should make an accurate work plan, deter-mining the completion time of the work and the open tender price that should be specified accurately. Thus, it is of great importance to anticipate work productiv-ity and come up with an adequate plan in wood production. One of the most commonly used methods is working time studies to analyse productivity of harvesting systems (Gallis 2004, Gallis and Spyroglou 2012, Savelli et al. 2010).
Regression analysis is one of the most commonly used statistical methods of estimation models to estab-lish the correlation between two or more variables (Khamis and Razak 2017). As calculation with the LSM is rather easy, it is the preferred method for most re-gression applications (Wu and Yu 2018). However, it was demonstrated in various works that outlier or multi-polar/missing data within a data set may ad -versely affect regression results (Hekimoğlu and Berber 2003, Wen et al. 2013). In such cases, it is more
adequate to use the robust method, which could pro-vide more reliable results by limiting the weight of outliers (Al-Amleh 2015). With the robust regression method, the measurements are affected neither by the errors in these measurements nor the errors in others, hence the negative impact of measurement errors on the results are reduced. This method permits more ac-curate determination of rough erroneous measure-ments without dispersing the effect of outliers. There -fore, a model, where matching data produces reliable results, could be designed.
The objective of the study was to design a model to accurately estimate effective productivity (Pe), where log volume (Vt), route slope (P) and winching distance (D) were known in a harvesting unit, where uphill tractor cable skidding was carried out. For this pur-pose, the effective productivity estimation for cable skidding was modelled with two methods: 1) Statisti-cal Package for the Social Sciences (SPSS) linear regres-sion; and 2) robust regression, with a final comparison of both methods.
2. Material and Methods
The study was performed in the East Black Sea for-ests in North-East of Turkey during 2016–2017. Route slope, winching distance, log volume and winching time data were collected from harvesting units that utilize uphill cable winching with a forest tractor. All harvesting units were pure spruce (Picea orientalis (L.) Link) stands of a middle age class and these forests had a closure of 0.71 to 1.00. The slopes of the skidding routes between 40–80% were measured with an incli -nometer and winching distances between 38 and 115 m were evaluated with a steel tape measure.
In the study, 247 logs were extracted uphill using a MB-Track 900 model forest tractor. One log was skid -ded each time. Diameters (d) in cm and lengths (L) in m of the logs were measured. The volume of the trans-ported logs (Vt) in m3 was calculated with Huber’s formula (Castellanos et al. 2007, The Forest Service 1999):
Vt =p´d L2
4000 (1)
Time measurements were performed with a stop-watch and the winching times (t) in h for each log were determined by the reset time measurement technique. Effective productivity of the system (Pe) in m3/h was calculated as (Mederski 2006):
P V t
The regression equation for effective productivity (Pe) included skidded log volume (Vt), route slope (P) and winching distance (D):
Pe b b Vt b P b Di t i
i = 0+ 1 i + 2 + (3)
Where:
b0, b1, …, bt coefficients
i number of data (i=1, 2, …, 120).
The equation was solved with the SPSS linear re-gression and robust rere-gression methods. Significant coefficients were determined for each solution and regression equations were written with these coeffi -cients.
2.1 Regression Analysis
The regression is a popular method that deter-mines the correlation between one independent vari-able and one or more dependent varivari-ables with a mathematical function (Uyanık and Güler 2013). In the literature, there are statistical estimation methods such as, the least squares method (LSM) (Koch 1999), weighted least squares (Draper and Smith 1998), ro -bust regression (Chen and Pinar 1998, Gross 2003, Rousseeuw and Leroy 1987, Staudte and Sheater 1990), genetic algorithm (Pan et al. 1995) and artificial neural networks (Stern 1996).
The relationship between the inputs and outputs in a multivariate linear regression model was ex-pressed as:
y b= 0+b x b x1 1+ 2 2+ ××× +b xt t+e (4) Where:
y dependent variable
x1, x2, …, xt independent variables
ε random error
t number of unknown parameters. 2.1.1 The Least-Squares Method (LSM)
In the estimation of model parameters, the LSM was applied, and the objective function was written as:
(
)
n
2 0 1 1 2 2 t t i 1
.
i
y b b x b x b x min
=
− + + + ⋅⋅⋅ + →
∑
(5)As (e) was the opposite of correction (n), when er-ror was replaced by correction in Eq. 4, the following equation was obtained:
vi=b0+b x b x1 1+ 2 2+ ××× +b x yt t- i (6) This equation could be written as a matrix:
V = Ab – y
v v
v
x x x x x x
x x x
1 2 1 2 1 2 1 2 1 1 1 n t t t é ë ê ê ê ê ê ê ù û ú ú ú ú ú ú = ¼ ¼ ¼ é ë ê ê ê êê ê ê ù û ú ú ú ú ú ú é ë ê ê ê ê ê ê ê ê ê ù û ú ú ú ú ú ú ú ú ú b b b b 0 1 2 t – 1 2 n y y y
(7)
Where:
y output vector A coefficient matrix
b regression coefficient matrix V correction vector.
The regression coefficients were obtained with the LSM method as:
b=
(
A PAT)
-1A PyT (8) Where:P weight matrix of input variables
The reverse weight matrix of the coefficients (Qbb) was obtained with Eq. 8 as:
(
T)
1 bbQ = A PA − (9)
The average error (mo) of the unit measure was de-termined with the correction vector (V) calculated by the coefficients vector (b) put in Eq. 7 as:
T
o V PV
m
n u = ±
− (10)
Where:
n number of measurements
u number of unknowns.
The standard error (SE) for regression parameters (mb) was calculated as:
mbi m qo b b i i
=± (11)
Where:
qbibi i-diagonal of Qbb matrix
The reverse weight matrix of the corrections (Qvv) was calculated as:
1 T vv bb
Q =P− −AQ A (12)
The standard error of corrections was calculated as:
1 T vv bb
Q =P− −AQ A (13)
T b m
b m q t
bi i b
i b b f
i i i
= = ³
-0 ,1 2
a (14)
Where:
qb1b1 i-diagonal element in reverse weight matrix of corrections (Qbb)
f,1 2
t
−a table value for dom, f (Koch 1999)t distribution in degrees of
free-2.1.2 Robust Regression Method
Although normal distribution of errors is assumed in LSM, in most applications, the normal distribution of errors cannot be ensured. An incorrect measure-ment adversely affects the LSM estimator and estima -tion value. Outliers impair all LSM findings, and thus all test sizes owing to the spillover effect. These cause the regression curve obtained with LSM to shift to -wards the outliers. Therefore, outliers are a serious problem in LSM analysis. One of the methods to over -come this problem is the robust regression method (Gallegos and Ritter 2005, Maronna and Zamar 2002, Meer et al. 1991, Wilcox 1997).
The robust regression method categorizes the mea-surements into reliable data and outliers. Reliable data have random errors, while the outliers have gross er-rors. The robust regression method is different from the LSM method in that it is not affected by outliers. Specifically, the parameters are calculated by assign -ing iteratively smaller weights to the outliers (Caspary and Borutta 1987, Gao et al. 1992, Hampel et al. 1986, Yang 1994, Yang et al. 2002).
The objective function (r) was written in the robust estimation method as:
( )
n i i 1 . v min ρ = →∑
(15)The derivative of the objective function was taken to obtain the prediction function (y) as:
( )
i( )
i i v ∂ ′ = = ∂ rry n r n (16)
and weight function (W) as:
( ) ( )
i i ii
v
W v W
v ψ
= = (17)
The prediction was made iteratively by re-weight-ing the LSM method. In each iteration, standardized corrections were compared with a limit value and new weights of the data were determined based on the se-lected weight function. The iteration was maintained
until the desired convergence and the new weights of outliers were gradually reduced (Hekimoğlu and Berber 2003).
The iterated weight matrix was determined as:
Pi = PWi–1 (18)
Where:
i number of iteration
The robust weight matrix in the initial iteration ac-cepted as the unit matrix (W0=I).
The parameters were calculated with the LSM based on Eqs. (7) and (8) as:
T 1 T i ( i ) i
b = A P A A P y− (19)
Iteration was maintained until the difference be -tween the bi+1 and bi parameters were insignificant. It was observed that the weights of the outliers were di-minished after each iteration, and some were even observed to approach zero. The significance tests of the regression coefficients were conducted with Eq. 14. Then, the regression equation was obtained with the significant coefficients.
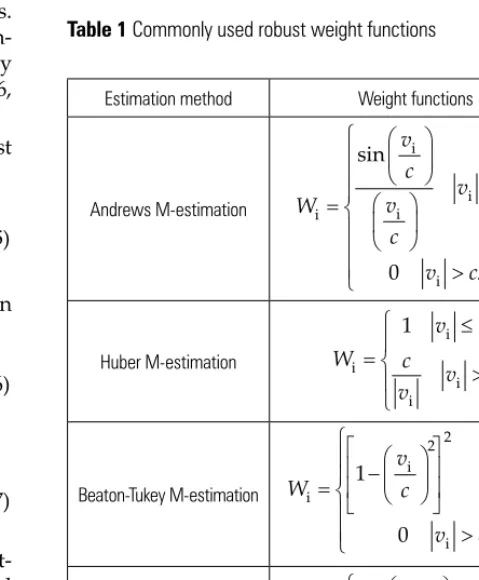
Various weight functions are used in robust regres -sion analysis (Gökalp et al. 2008) (Table 1).
Table 1 Commonly used robust weight functions
Estimation method Weight functions
Andrews M-estimation i i i i i sin 0 v c v c v W c v c π π ≤ = > Huber M-estimation i i i i
1 v c
W c v c
v
≤
= >
Beaton-Tukey M-estimation 2 2 i i i i 1 0
v v c
W c v c − ≤ = > Danimarc method 2 i i 2 i i 1 v
exp v c
W c
v c
− >
The limit value parameter (c) for the weight func-tions in Table 1 can be determined with various tech-niques. In order for robust methods to provide accu-rate and reliable results, the limit value parameters should be determined as accurately as possible. The limit value was based on the assumption that observa-tional errors would be scattered within the limits of ± c within a certain probability. The limit value could be assumed as:
c = ks0 (20)
Where:
s0 preliminary standard error for the measure-ment set
Instead of vi ≤c, standardized values of the cor-rections (
i i v v
k
m ≤ ) could be taken. The H0hypotheses could be constructed as:
( )
0: 0H E v = (21)
and test size (Ti) could be tested as:
i i i
i i
i f,1 v 0 v v 2
v v
T t
m m q −
= = ≤ a (22)
Where:
qnini ith diagonal element in the weight matrix of
corrections (Qvv) f,1
2
t
−a t-table value in degrees of freedom f
Using Eq. 22, the limit value was calculated for each correction as:
i i
i 0 v v f,1 2
c m q t
−
= a (23)
When the weights of the data were different, the limit value after the first iteration in Eq. 23 was:
i i
i 0 v v i f,1 2
c m q P t
−
= a (24)
A common limit value was calculated by taking the average of c values calculated as (Gökalp and Boz 2005):
n i i 1c
c n=
=
∑
(25)Based on empirical studies, statisticians suggest that the limit value c could be taken as 1.5 or 2 (Somogyi 1988). However, calculating the limit value c separately for each measure with Eq. 25 provides a more realistic decision.
3. Results and Discussion
3.1 SPSS RegressionThe correlation of several parameters of the har-vesting operations with productivity is generally de-termined by regression models (Gallis 2004). The lin-ear regression function was established according to Eq. 3 using the log volume, slope and transport dis-tance for effective productivity in the uphill tractor cable-skidding method. The coefficients of the param -eters and the significance levels of these coefficients were determined by SPSS from Eq. 3 (Table 2).
Table 2 The coefficients of slope, volume, distance and significance testing with SPSS
Model
Unstandardized Coefficients
Standardized
coefficients t Sig.
B SE Beta
(Constant) 4.397 .779 5.642 .000
Slope –2.357 .816 –.137 –2.887 .004
Distance –.004 .006 –.028 –.585 .559
Volume 5.383 .403 .655 13.368 .000
It was found that the distance coefficient was not significant at p> 0.05 (Table 2). Therefore, the regres-sion equation for effective productivity was recon -structed with log volume and slope as:
i i
e 0 1 t 2 i
P =b +b V +b P (26)
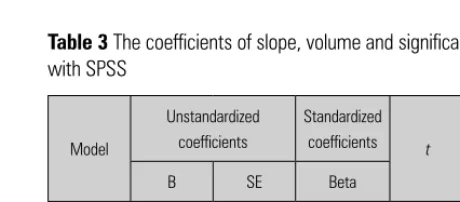
The coefficients of the parameters and the signifi -cance levels of these coefficients were re-calculated by SPSS from Eq. 26 (Table 3).
Table 3 The coefficients of slope, volume and significance testing with SPSS
Model
Unstandardized coefficients
Standardized
coefficients t Sig.
B SE Beta
(Constant) 4.188 .692 6.054 .000
Slope –2.392 .813 –.140 –2.943 .004
Volume 5.325 .390 .648 13.662 .000
was determined using significant coefficients with linear regression in SPSS as:
i i
e 4.188 5.325 t 2.392 i
P = + V − P
2
(R = 0.481, F= 113.065, p< 0.05) (27) Previous studies showed that productivity was generally affected by volume (Proto et al. 2018), dis -tance (Nikooy et al. 2013), slope (Gilanipoor et al. 2012), the number of logs in each cycle (Gholami and Majnounian 2008) and interaction between them (Mousavi 2009, Naghdi 2004, Pilevar 1996). While it was found that distance affected productivity in some studies (Nikooy 2007, Wang 2004), it was determined that distance had no effect on productivity by Mousavi and Nikooy (2014) similar to this study. On the other hand, Gilanipoor et al. (2012) determined that produc -tivity depended on slope and volume similar to the findings in this study.
3.2 Robust Regression
The regression coefficients in Eq. 3 were calculated by the robust regression method with iterations. These calculations were performed with the software written by the author in the MATLAB environment. The Huber M-Estimation was used as the estimation method (Table 1). In the Huber M-Estimation, the limit value (c) was determined by Eq. 25. Robust weights (W) were calculated from Eq. 17. The iterated weight matrix (Pi) was determined by Eq. 18. Regression equation coef-ficients in Eq. 3 were calculated by Eq. 19 after itera -tions. With this method, the significance of the coeffi -cients was tested by comparing the test size (Tbi) and
t-table value (Table 4).
Table 4 The coefficients of slope, volume, distance and significance testing with the robust regression method
Coefficients bi
Test size Tbi
t-table value
f,1 2
t −a
Decision
b f,1 2
T ≥t −a
b0= 3.0228 5.459 1.969 Significant
b1 = 5.5073 18.899 1.969 Significant
b2 = –1.4064 2.464 1.969 Significant
b3 = –0.0011 0.253 1.969 Insignificant
It was found that the winching distance coefficient (b3) in Eq. 3 was insignificant (Table 4). Therefore, the effective productivity regression coefficients were cal
-culated with log volume and route slope, which were determined as significant, and standard errors for the coefficients (mbi) were calculated with Eq. 11 with sig-nificance tests conducted (Table 5).
Table 5 The coefficients of slope, volume and significance testing with the robust regression method
Coefficients bi
SE mbi
Test size Tbi
t-table value
f,1 2
t −a
Decision
b f,1 2
T ≥t −a
b0 = 3.0940 0.495 6.253 1.969 Significant
b1 = 5.5182 0.284 19.416 1.969 Significant
b2 = –1.3886 0.570 2.436 1.969 Significant
It was found that the transport distance coefficient was not significant (Table 5). For this reason, log vol -ume and slope coefficients were re-calculated from the robust regression method in Eq. 26 and significance tests were performed. Hence, the regression equation of effective productivity for the uphill forestry tractor cable-skidding technique was determined using sig-nificant coefficients with the robust regression method as follows:
i i
e 3.0940 5.5182 t 1.3886 i
P = + V − P (28)
In the literature, various studies comparing LSM and robust regression methods have been made. Muhlbauer et al. (2009) found that external observa -tions might bias the LSM trend estimate and lead to an overly high or low estimate. Therefore, it was de-termined that the robust method was more suitable than LSM for estimation modelling. Similar to this study, Hekimoğlu and Erenoğlu (2005) determined that it was more appropriate to use robust methods in cases of outliers.
4. Conclusions
-ing to the LSM method from all data contain-ing outli -ers. Therefore, this research sought to investigate more sensitive determination of productivity estimation. For this purpose, productivity estimation was carried out by the robust estimation method, which minimiz-es the effects of outliers, and the rminimiz-esults were com -pared with SPSS estimation.
In this study, spruce logs with the volume of 0.28–2.35 m3 were transported uphill with a forest tractor at 38–115 m distances in harvesting units having a slope between 40 and 80%. The productivity estimations were produced using SPSS and the Huber-M estimation with the robust regression method prepared in MATLAB by taking the slope, volume and transport distance. With both estimation methods, it was deter-mined that slope and volume had a significant effect on productivity, while the winching distance was not effective. It was determined that the productivity was directly proportional to volume and inversely propor-tional to slope. The standard errors of the coefficients of both models were compared and it was concluded that the robust method was more sensitive than the SPSS regression method.
In future studies, productivity estimations for cable traction with forestry tractors should be investigated for different slopes, volumes and tree species. In addi -tion, it is recommended that productivity estimates for different extraction methods be made with different robust estimation methods.
Acknowledgements
This study was financially supported by the »Sci -entific and Technological Research Council of Turkey (TUBITAK)« (The project number: 115O017).
5. References
Acar, H.H., Kaya, A., Ünver-Okan, S., Üçüncü, K., 2015: Evaluation of skidding system by MB-Track 900 forest trac -tors on steep slope in thinning operations. International sym-posium FORMEC, 4–8 October, Linz, Austria, 1–6 p. Akay, A.E., Erdas, O., Session, J., 2004: Determining produc-tivity of mechanized harvesting machines. Journal of Ap-plied Sciences 4(1): 100–105. https://doi.org/10.3923/ jas.2004.100.105
Al-Amleh, M.A.A.H., 2015: Robust methods in regression analysis: Comparison and improvement. Master’s Thesis, Zarqa University, Jordan, 68 p.
Blakeney, K.J., 1992: Environmentally friendly helicopter logging in Papua New Guinea. Symposium on Harvesting and Silviculture for Sustainable Forestry in the Tropics. For-est Research Institute Malaysia, October 5–9, 145–150.
Caspary, W., Borutto, H., 1987: Robust estimation in defor -mation models. Survey Review 29(223): 29–45. https://doi. org/10.1179/sre.1987.29.223.29
Castellanos, A., Blanco, A.M., Palencia, V., 2007: Applications of radial basis neural networks for area forest. International Journal Information Theories & Applications 14(3): 218–222. Chen, B., Pinar, M.Ç., 1998: On Newton’s method for Hu -ber’s robust M-estimation problems in linear regression. Swets & Zeitlinger 38(4): 674–684. https://doi.org/10.1007/ BF02510408
Draper, N.R., Smith, H., 1998: Applied Regression Analysis, Wiley, 736 p.
Erdas, O., Acar, H.H., Eker, M., 2014: Transport techniques for forest products. KTU Faculty of Forestry, Trabzon, Pub-lish No: 233/39, 504 p.
Gallegos, M.T., Ritter, G., 2005: A Robust method for cluster analysis. The Annals of Statistics 33(1): 347–380. https://doi. org/10.1214/009053604000000940
Gallis, C., 2004: Comparative cost estimation for forwarding small-sized beech wood with horses and mini-skidder in northearn Greece. Forest Products Journal 54(11): 84–90. Gallis, C., Spyroglou, G., 2012: Productivity linear regression models of tree-length harvesting system in natural coastal Aleppo Pine (Pinus halepensis L.) forests in the Chalkidiki area of Greece. Croatian Journal of Forest Engineering 33(1): 115–123.
Gao, Y., Krakinwsky, E.J., Czompo, J., 1992: Robust testing procedure for detection of multiple blunders. Journal for Survey Engineering ASCE 118(1): 11–23. https://doi. org/10.1061/(ASCE)0733-9453(1992)118:1(11)
Ghaffariyan, M.R., Sessions, J., Brown, M., 2012: Machine productivity and residual harvesting residues associated with a cut-to-length harvest system in southern Tasmania. Southern Forests: Journal of Forest Science 74(4): 229–235. https://doi.org/10.2989/20702620.2012.741770
Gholami, M.J., Majnounian, B., 2008: Productivity and cost of wheeled skidder in Hyrcanian forest. International Jour-nal of Natural and Engineering Sciences 2(3): 99–103. Gilanipoor, N., Najafi, A., Heshmat Alvaezin, S.M., 2012: Productivity and cost of farm tractor skidding. Journal of Forest Science 58(1): 21–26. https://doi.org/10.17221/4804-JFS Gökalp, E., Güngör, O., Boz, Y., 2008: Evaluation of different outlier detection methods for GPS networks. Sensors 8(11): 7344–7358. https://doi.org/10.3390/s8117344
Gökalp, E., Boz, Y., 2005: Comparison of robust M-estima -tions in determination of the outlying baseline vectors in GPS networks. Map Journal 134: 1–17.
Gross, J., 2003: Linear Regression. Springer Verlag, Berlin, Heidelberg, New York, 398 p.
Hekimoğlu, Ş., Berber, M., 2003: Effectiveness of robust methods in heterogeneous linear models. Journal of Geodesy 76(11–12): 706–713. https://doi.org/10.1007/s00190-002-0289-y
Hekimoğlu, Ş., Erenoğlu, R.C., 2005: Outlier detection by us -ing robust methods and comparison results to tests for outli-ers for leveling networks. 2nd Engineering Survey
Sympo-sium, 23–25 October, Istanbul, Turkey, 481–490.
Ibrahimovic, A.Q., 2016: Suspended forestry machines for sustainable forestry. Ph.D Thesis, KTH Royal Institute of Technology, Stockholm, Sweden.
Khamis, A., Razak, N.A.A., 2017: A comparative study of robust regression methods in modeling the currency in cir-culation in Malaysia. International Journal of Science and Research 6(4): 241–244.
Kovácsová, P., Antalová, M., 2010: Precision forestry-defini -tion and technologies. Šumarski list 134(11–12): 603–611. Koch, K.R., 1999: Parameter estimation and hypothesis test -ing in linear models. Spr-inger, Berlin, Heidelberg, New York, 334 p.
Maronna, R.A., Zamar, R.H., 2002: Robust estimates of location and dispersion for high-dimensional data sets. Technometrics 44: 307–317. https://doi.org/10.1198/004017002188618509 Mederski, P.S., 2006: A comparison of harvesting productiv -ity and costs in thinning operations with and without mid-field. Forest Ecology and Management 224: 286–296. https:// doi.org/10.1016/j.foreco.2005.12.042
Meer, P., Mintz, D., Rosenfeld, A., Kim, D.Y., 1991: Robust regression methods in computer vision: A review. Interna-tional Journal of Computer Vision 6(1): 59–70. https://doi. org/10.1007/BF00127126
Mousavi, R., 2009: Comparison of productivity, cost and en -vironmental impacts of two harvesting methods in northern Iran: Short-log vs. long-log. Dissertationes Forestales 82: 93 p.
Muhlbauer, A., Spichtinger, P., Lohmann, U., 2019: Applica -tion and comparison of robust linear regression methods for trend estimation. Journal of Applied Meteorology and Cli
-matology 48(9): 1961–1970. https://doi.
org/10.1175/2009JAMC1851.1
Naghdi, R., 2004: Investigation and comparison of full tree and log utilization methods in order to presentation the best model forest roads network in Neka region (North of Iran). Ph.D. Thesis, Tarbiat Modarres University, Tehran, 238 p. Nikooy, M., Esmailnezhad, A., Naghdi R., 2013: Productiv -ity and cost analysis of skidding with Timberjack 450C in forest plantations in Shafaroud Watershed, Iran. Journal of Forest Science 59(7): 261–266. https://doi.org/10.17221/19/2013-JFS
Nikooy, M., 2007: Production optimization and reduction impact on forest by preparing harvest planning in Nav, Iran. Ph.D. Thesis, Tehran University, Tehran, 165 p.
Pan, Z., Chen, Y., Kang, L., Zhang, Y., 1995: Parameter esti -mation by genetic algorithms for nonlinear regression, opti-mization techniques and applications. Proceeding of ICO-PA’95 2(1): 946–953.
Pilevar, B., 1996: Calculation of cost in two harvesting sys -tem: Cable crane and ground skidding. Master Thesis, Teh -ran University, Teh-ran, 98 p.
Proto, A.R., Macrì, G., Visser, R., Russo, D., Zimbalatti, G., 2018: Comparison of timber extraction productivity between winch and grapple skidding: A case study in southern Italian forests. Forests 9(2): 61–72. https://doi.org/10.3390/f9020061 Rousseeuw, P.J., Leroy, A.M., 1987: Robust regression and outlier detection. John Wiley, New York, 329 p.
Savelli, S., Cavalli, R., Baldini, S., Picchio, R., 2010: Small scale mechanization of thinning in artificial coniferous plantation. Croatian Journal of Forest Engineering 31(1): 11–21. Somogyi, J., 1988: Robust estimation and their use in geod -esy. Acta Geod. Geogh. Mont. Hung. 23(l): 45–55.
Spinelli, R., Magagnotti, N., Lombardini, C., 2010: Perfor -mance, capability and costs of small-scale cable yarding tech-nology. Small Scale Forestry 9(1): 123–135. https://doi. org/10.1007/s11842-009-9106-2
Staudte, R.G., Sheater, S.J., 1990: Robust estimation and test -ing. Wiley, New York, 376 p.
Stern, H.S., 1996: Neural networks in applied statistics. Tech -nometrics 38(3): 205–214.
The Forest Service, 1999: Timber measurement manual: Stan -dard procedures for the measurement of round timber for sale purposes in Ireland. The Forest Service of the Depart-ment of the Marine & Natural Resources, Ireland, 82 p. Ünver-Okan, S., 2017: Comparison of drummed forest tractor and portable winch systems for uphill extraction economical and technical aspects. TUBITAK Project Code: 115O017.
Uyanık, G.K., Guler, N., 2013: A study on multiple linear regression analysis. Procedia – Social and Behavioral Sci-ences 106: 234–240. https://doi.org/10.1016/j.sb -spro.2013.12.027
Wang, J., Grushecky, S.T., McNeel, J. 2005: Production anal -ysis of helicopter logging in west Virginia: A preliminary case study. Forest Products Journal 55(12): 71–76.
Wang, J., Long, C., McNeel, J., Baumgras, J., 2004: Productiv -ity and cost of manual felling and cable skidding in central Appalachian hardwood forests. Forest Product Journal 54: 45–51.
Wen, Y.W., Tsai, Y.W., Wu, D.B.C., Chen, P.F., 2013: The Im-pact of Outliers on net-benefit regression model in cost- ef -fectiveness analysis. PLoS ONE 8(6): 1–9. https://doi. org/10.1371/journal.pone.0065930
Received: May 20, 2019 Accepted: October 23, 2019
Authors’ addresses:
Asst. prof. Saliha Ünver-Okan, PhD * e-mail: [email protected]
Karadeniz Technical University Faculty of Forestry
Department of Forest Engineering 61080 Trabzon
TURKEY
* Corresponding author appropriate weighting. Atmospheric Measurement Techniques
11: 1233–1250. https://doi.org/10.5194/amt-11-1233-2018 Yang, Y., 1994: Robust estimation for dependent observa -tions. Manuscript Geod 19(1): 10–17.