Ames Laboratory Accepted Manuscripts Ames Laboratory
7-5-2018
Phase Modulation of (1T-2H)-MoSe2/TiC-C
Shell/Core Arrays via Nitrogen Doping for Highly
Efficient Hydrogen Evolution Reaction
Shengjue Deng
Zhejiang University
Fan Yang
Hainan University
Qinghua Zhang
Chinese Academy of Sciences
Yu Zhong
Zhejiang University
Yinxiang Zeng
Sun Yat‐sen University
See next page for additional authors
Follow this and additional works at:https://lib.dr.iastate.edu/ameslab_manuscripts
Part of theEngineering Physics Commons
This Article is brought to you for free and open access by the Ames Laboratory at Iowa State University Digital Repository. It has been accepted for inclusion in Ames Laboratory Accepted Manuscripts by an authorized administrator of Iowa State University Digital Repository. For more information, please [email protected].
Recommended Citation
Deng, Shengjue; Yang, Fan; Zhang, Qinghua; Zhong, Yu; Zeng, Yinxiang; Lin, Shiwei; Wang, Xiuli; Lu, Xihong; Wang, Cai-Zhuang; Gu, Lin; Xia, Xinhui; and Tu, Jiangping, "Phase Modulation of (1T-2H)-MoSe2/TiC-C Shell/Core Arrays via Nitrogen Doping for Highly Efficient Hydrogen Evolution Reaction" (2018).Ames Laboratory Accepted Manuscripts. 466.
Phase Modulation of (1T-2H)-MoSe2/TiC-C Shell/Core Arrays via
Nitrogen Doping for Highly Efficient Hydrogen Evolution Reaction
Abstract
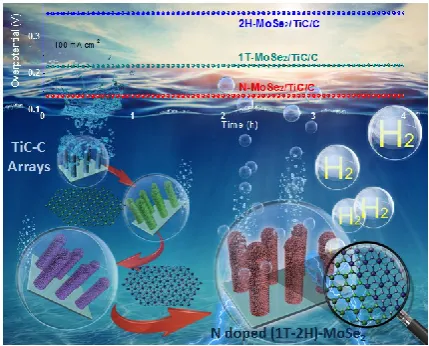
Tailoring molybdenum selenide electrocatalysts with tunable phase and morphology is of great importance for advancement of hydrogen evolution reaction (HER). In this work, phase‐ and morphology‐modulated N‐doped MoSe2/TiC‐C shell/core arrays through a facile hydrothermal and postannealing treatment strategy are reported. Highly conductive TiC‐C nanorod arrays serve as the backbone for MoSe2 nanosheets to form high‐quality MoSe2/TiC‐C shell/core arrays. Impressively, continuous phase modulation of MoSe2 is realized on the MoSe2/TiC‐C arrays. Except for the pure 1T‐MoSe2 and 2H‐MoSe2, mixed (1T‐2H)‐MoSe2 nanosheets are achieved in the N‐MoSe2 by N doping and demonstrated by spherical aberration electron microscope. Plausible mechanism of phase transformation and different doping sites of N atom are proposed via theoretical calculation. The much smaller energy barrier, longer HSe bond length, and diminished bandgap endow N‐MoSe2/TiC‐C arrays with substantially superior HER performance compared to 1T and 2H phase counterparts. Impressively, the designed N‐MoSe2/TiC‐C arrays exhibit a low overpotential of 137 mV at a large current density of 100 mA cm−2, and a small Tafel slope of 32 mV dec−1. Our results pave the way to unravel the enhancement mechanism of HER on 2D transition metal dichalcogenides by N doping.
Keywords
core/shell arrays, hydrogen evolution reaction, molybdenum selenide, nitrogen doping, phase modulation
Disciplines
Engineering Physics
Authors
Shengjue Deng, Fan Yang, Qinghua Zhang, Yu Zhong, Yinxiang Zeng, Shiwei Lin, Xiuli Wang, Xihong Lu, Cai-Zhuang Wang, Lin Gu, Xinhui Xia, and Jiangping Tu
This is the author manuscript accepted for publication and has undergone full peer review but has not been through the copyediting, typesetting, pagination and proofreading process, which may lead to differences between this version and the Version of Record. Please cite this article as doi:
10.1002/adma.201802223.
This article is protected by copyright. All rights reserved.
DOI: 10.1002/ ((please add manuscript number))
Article type: Communication
Phase Modulation of (1T-2H)-MoSe
2/TiC-C Shell/Core Arrays via Nitrogen
Doping for Highly Efficient Hydrogen Evolution Reaction
Shengjue Deng‡, Fan Yang‡, Qinghua Zhang, Yu Zhong, Yinxiang Zeng, Shiwei Lin*, Xiuli
Wang, Xihong Lu*, Cai-Zhuang Wang, Lin Gu, Xinhui Xia* and Jiangping Tu
S. J. Deng, Y. Zhong, Prof. X. L. Wang, Prof. X. H. Xia, Prof. J. P. Tu
State Key Laboratory of Silicon Materials,
Key Laboratory of Advanced Materials and Applications for Batteries of Zhejiang Province, and Department of Materials Science and Engineering,
Zhejiang University,
Hangzhou 310027, P. R. China.
E-mail: [email protected]
F. Yang, Prof. S. W. Lin
State Key Laboratory of Marine Resource Utilization in South China Sea, Hainan University, Haikou 570228, P. R. China
This article is protected by copyright. All rights reserved.
2 Prof. Q. H. Zhang, Prof. L. Gu
Institute of Physics, Chinese Academy of Sciences
Y. X. Zeng, Prof. X. H. Lu
MOE of the Key Laboratory of Bioinorganic and Synthetic Chemistry, KLGHEI of Environment and Energy Chemistry, School of Chemistry,
Sun Yat-Sen University,
Guangzhou 510275, China.
E-mail: [email protected]
Prof. C. Z. Wang
Ames Laboratory-U. S. Department of Energy, and Department of Physics and Astronomy, Iowa State University, Ames, IA 50011, USA
‡ S. Deng and F. Yang contributed equally to this work
* Address correspondence to [email protected] (X. H. Xia), [email protected] (S. W. Lin), and [email protected] (X. H. Lu)
This article is protected by copyright. All rights reserved.
3
Abstract: Tailoring molybdenum selenide electrocatalysts with tunable phase and
morphology is of great importance for advancement of hydrogen evolution reaction (HER).
In this work, we report phase- and morphology-modulated N-doped MoSe2/TiC-C shell/core
arrays through a facile hydrothermal and post-annealing treatment strategy. Highly
conductive TiC-C nanorod arrays serve as the backbone for MoSe2 nanosheets to form
high-quality MoSe2/TiC-C shell/core arrays. Impressively, continuous phase modulation of
MoSe2 is realized on the MoSe2/TiC-C arrays. Except for the pure 1T-MoSe2 and 2H-MoSe2,
mixed (1T-2H)-MoSe2 nanosheets areachieved in the N-MoSe2 by N doping and
demonstrated by spherical aberration electron microscope. Plausible mechanism of phase
transformation and different doping sites of N atom are proposed via theoretical calculation.
The much smaller energy barrier, longer H-Se bond length and diminished bandgap endow
N-MoSe2/TiC-C arrays with substantially superior HER performance compared to 1T and 2H
phase counterparts. Impressively, the designed N-MoSe2/TiC-C arrays exhibit a low
overpotential of 137 mV at a large current density of 100 mA cm-2, and a small Tafel slope of
32 mV Dec-1. Our results pave the way to unravel the enhancement mechanism of HER on
2D transition metal dichalcogenides (TMDs) by N doping.
This article is protected by copyright. All rights reserved.
4 1. Introduction.
Interest in hydrogen as a way of delivering energy services has been growing in recent
years in response to heightening concerns about the environmental impact of energy use and
worries about the security of fossil-fuel supplies.[1-4]Currently, hydrogen is widely produced
by steam reforming of fossil fuels (e.g., methane),[5] but this process causes emissions of
carbon dioxide and airborne pollutants. Alternatively, carbon-free water electrolysis to
generate environment-friendly and renewable hydrogen via electrochemical hydrogen
evolution reaction (HER) has attracted ever-increasing attention.[6, 7] It is well accepted that
the HER performance is closely bound up with the electrocatalysts. Noble metals (such as Pt
and Pt-based alloys) are currently deemed to be the most promising electrocatalysts for HER
with low overpotentials and Tafel slopes,[8-10] but their practical application is severely
hindered by high cost, scarcity and compromised long-term stability. To this end, it is highly
desirable to develop cost-effective and efficient HER electrocatalysts.
Of the explored candidates, molybdenum selenide (MoSe2) has been one of the hotspot
research subjects due to its superior stability, easy processing, and good HER
performance.[11] It is demonstrated that the HER performance of MoSe2 is closely linked with
its phase. It is known that MoSe2 has two active phases[12]: 2H phase with trigonal prismatic
This article is protected by copyright. All rights reserved.
5
metallic properties with better HER performance, while the 2H-MoSe2 is a p-type
semiconductor with relatively lower electronic conductivity & catalytic activity.[14]
Meanwhile, it is noteworthy that the 2H-MoSe2 is a steady state, while the 1T-MoSe2 is a
metastable state and can be easily converted into 2H-MoSe2. To obtain stable 1T-MoSe2
nanostructures for HER performance, two main strategies have been proposed. The first route
is to directly synthesize 1T-MoSe2 nanostructures, but just only a few works reported. Jiang
et al.[15] and Yin et al.[16] reported solvothermal/hydrothermal methods to prepare 1T-MoSe2
nanosheets with enhanced HER performance (Tafel slope of 78 mV dec-1 and 52 mV dec-1,
respectively). Nevertheless, their structural stability and electronic conductivity are still not
satisfactory. In addition, without support of conductive matrix, the large-current HER
performance of the above 1T-MoSe2 nanosheets powder are greatly undermined. The second
route is to introduce 1T-MoSe2 into 2H-MoSe2 host to create mixed stable (1T-2H)-MoSe2.
For example, Qu et al.[17] adopted plasma-assisted selenization process to produce
Mo/(1T-2H)-MoSe2 core/shell arrays with Tafel slope of 35 mV dec-1. But the
plasma-assisted selenization process requires sophisticated equipment and high cost. Recently,
our group[11] successfully employed an annealing process to form (1T-2H)-MoSe2 on
graphene with Tafel slope of 49 mV dec-1. This (1T-2H)-MoSe2/graphene composite showed
This article is protected by copyright. All rights reserved.
6
2H-MoSe2 counterpart. However, there are still some underlying problems such as the
unknown phase modulation mechanism and undesirable overpotential at large current density.
Additionally, it still a challenge to realize modulation between different phases (1T, 2H and
1T-2H) of MoSe2 and unravel the reason of their performance difference of HER.
Catalytic current at a specific potential is another indicator to illustrate the HER
performance. Under the same conduction, higher current density implies better HER
efficiency. To date, most of the works adopted the current density of 10 mA cm-2 as the
benchmark to compare the HER performance,[18, 19] and there is no work on HER comparison
of MoSe2 at larger current density such as100 mA cm-2. To realize large current HER, apart
from the phase engineering, morphology engineering is indispensable.[13, 20-22] Power form is
usually not suitable for large current HER due to the use of insulating binders and detach
from substrate arising from bubble-striking effect. Therefore, stable and highly conductive
backbones (e.g., reduced graphene oxide,[23] carbon fibre,[24] carbon nanotubes[25] and Mo[17])
are needed to couple with MoSe2 to enhance the electron transfer and mechanical stability.
Currently, CVD-derived TiC-C arrays are becoming the new pet as the conductive matrix for
electrochemical application (TiC-C/Si,[26] TiC-C/Li,[27] and so on) due to their excellent
structural/chemical stability, high electrical conductivity (105 S/m) and strong mechanical
This article is protected by copyright. All rights reserved.
7
Nevertheless, to date, there is no report on rational combination between MoSe2 and TiC-C
skeleton. Therefore, it would be very interesting to explore the directional growth of MoSe2
with different phases on the TiC-C skeleton to form high-quality binder-free electrocatalysts
for advanced HER.
In this wok, combining the phase & morphology engineering strategies together, we design
high-quality N doped MoSe2/TiC-C shell/core arrays with exceptional HER activity. Starting
from hydrothermal-synthesized 1T-MoSe2/TiC-C arrays, we realize the phase modulation of
MoSe2 from 1T phase to 2H phase and mixed 1T-2H phase via a facile hydrothermal plus
annealing process and demonstrated by spherical aberration electron microscope. Finally,
interconnected (1T-2H)-MoSe2 nanosheet shell obtained by N doping (designated as
N-MoSe2) is intimately anchored on the highly conductive TiC-C nanowire core forming
self-supported HER electrocatalysts. The DFT calculation conducted on phase transformation
and different doping sites reveal that N doping not only decreases the band gap of MoSe2, but
also reduces the energy barrier promoting easier phase transition from 2H to 1T, which
provides useful insights to further understand the enhancement mechanism of HER by N
doping. Benefiting from highly conductive support of TiC-C arrays, improved conductivity,
richer catalytic active sites, and lower desorption energy, the fabricated N-MoSe2/TiC-C
This article is protected by copyright. All rights reserved.
8
large current density of 100 mA cm-2, with the lowest overpotentials and smallest Tafel
slopes, better than other 1T-MoSe2 and 2H-MoSe2 counterparts. Our work provides useful
insight to understand the enhancement mechanism of HER by N doping and offers new
means for construction of advanced electrocatalysts for water electrolysis and beyond.
2. Results and discussion
The simplified schematic flow of synthesis process of N-MoSe2/TiC-C arrays is illustrated
in Figure 1a. First of all, the TiC-C arrays are prepared on the Ti6Al4V foil via a facile CVD
method. As shown in Figure 1b-c, uniform TiC-C nanorods of ~300 nm in diameters grow
vertically to the Ti6Al4V foil substrate forming array architecture. Moreover, the TiC-C
nanorods individually grow with non-interference and leave lots of interspace of 1-3 m
forming arrays network. The shell/core structure of the TiC-C is clearly distinguished by
transmission electron microscopy (TEM) images (Figure S1), which demonstrate that the
TiC nanowire core of 30 nm is homogeneously covered by carbon shell with thickness of
about 130-150 nm (Figure S1a-b). Selected area electron diffraction (SAED) patterns show
This article is protected by copyright. All rights reserved.
9
TiC core is sing-crystalline in nature, while the carbon shell is amorphous (Figure S1b). The
measured lattice fringe is about 0.22 nm, corresponding to the interplanar spacing of (002)
planes of TiC phase (JCPDS 65-0242). No clear lattice fringe is noticed for the carbon shell,
further confirming its amorphous nature (Figure S1c). Energy dispersive X-ray (EDS)
mapping images (Figure S1d-f) confirm the existence and uniform distribution of C and Ti
elements in TiC-C shell/core arrays. These unique structure characteristics endows the TiC-C
arrays with high electronic conductivity, which is verified by four-point probe method with a
small resistance of 1.6 mΩ/sq. This is very important for HER at large current density
requiring fast transfer paths for electrons. After the hydrothermal (HT) process, wrinkled
MoSe2 nanosheets are homogeneously grown along the TiC-C nanorods to form
1T-MoSe2/TiC-C arrays. Note that the whole surface of the TiC-C nanorod is completely
decorated by interconnected ultrathin MoSe2 nanosheets (Figure 1d-e), suggesting the
successful deposition of MoSe2 on TiC-C backbone forming shell/core arrays. The 1T-MoSe2
can be converted into 2H-MoSe2 after thermal treatment (TT) under argon atmosphere.
Furthermore, the 2H-MoSe2/TiC-Carrays can be further changed into (1T-2H)-MoSe2/TiC-C
arrays by N doping via NH3 annealing (designated as N-MoSe2/TiC-C). The N doping can
modulate the phase of MoSe2 and realize the co-existence of 1T and 2H phase in the MoSe2
This article is protected by copyright. All rights reserved.
10
morphologies to that of the 1T-MoSe2/TiC-C arrays (Figure 1h-i and 1k-l). The 3D porous
networks are still well preserved and the diameters of arrays do not change much. The above
results suggest that the NH3 treatment will not obviously affect the morphology of products.
The phase evolution of MoSe2/TiC-C arrays was monitored and supported by
TEM-HRTEM and spherical aberration corrected transmission electron microscope
(SACTEM) analysis in detail. TEM images (Figure 2a-c) indicate that, for all three samples,
the TiC-C core is uniformly decorated by the cross-linked MoSe2 nanosheets shell, forming
high-quality shell/core structures. The diameters of the MoSe2/TiC-C core/shell structures are
about 700-800 nm. Moreover,the line-scan energy dispersive X-ray (EDX) spectra (Figure
S2) shows the relative intensity of the C, Ti, Mo Se and N elements, further confirming the
core/shell structure of N-MoSe2/TiC-C. TEM images further verify that there is no noticeable
change on morphology for all three samples. The lattice fringe evolution of MoSe2
nanosheets at different stages is shown in HRTEM images (Figure 2a-c). Note that the
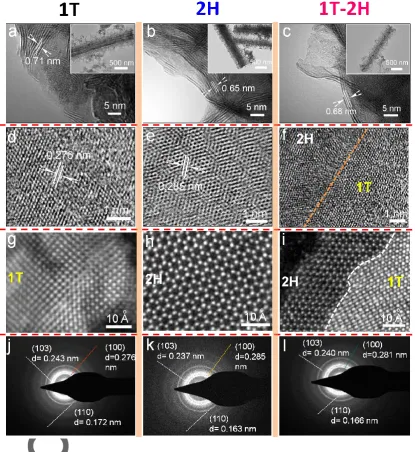
interlayer distance of the 1T-MoSe2 nanosheets is about 0.71 nm characteristic of the
1T-MoSe2 phase.[11, 17, 28-30] This value decreases into 0.65 nm for the 2H-MoSe2
nanosheets,[13, 24] and then increases up to 0.68 nm for the (1T-2T)-MoSe
2 nanosheets by N
doping due to the co-existence of 1T and 2H phases. The above results suggest that the
This article is protected by copyright. All rights reserved.
11
effect of high temperature. With the introduction of N, partial 2H-phase could be converted
into 1T-MoSe2, because the N doping can trigger rearrangement of Se and Mo atoms to
generate the final (1T-2H)-MoSe2/TiC-Cshell/core arrays, further supported by detailed
HRTEM analysis. Notice that the 1T-MoSe2 shows trigonallattice structure (octahedral
coordination) (Figure 2d and 2g), different from the 2H-MoSe2 with common honeycomb
lattice (trigonal prismatic coordination) (Figure 2e and 2h).[11, 30] In addition, the measured
lattice fringe of 2H-MoSe2 is around 0.285 nm, larger than the 1T-MoSe2 (0.276 nm) (Figure
2d-e), matching well with the (100) plane of MoSe2 (JCPDS 29-0914). Impressively, both the
lattice structures of 1T- and 2H-phases are clearly presented in N-MoSe2/TiC-Carrays
(Figure 2f and 2i), indicating that the N doping can modulate the MoSe2 phase and realize
the co-existence of 1T-MoSe2 and 2H-MoSe2 in N-MoSe2 nanosheets. In order to check the
phase evolution, selected area electron diffraction (SAED) measurements were conducted
(Figure 2j-l). The radii of diffraction rings of (100), (103), and (110) correspond to different
lattice spacings. The 1T-MoSe2 shows larger lattice spacing of (103) and (110) planes, but
possesses smaller lattice spacing of (100) plane compared to 2H-MoSe2. Remarkably, the
lattice spacing of N-MoSe2 is between 1T-MoSe2 and2H-MoSe2, further demonstrating the
This article is protected by copyright. All rights reserved.
12
X-ray diffraction (XRD), Raman and X-ray photoelectron spectroscopy (XPS) tests were
also performed to investigate the phase and chemical composition of all samples.Typical
XRD patterns of the TiC-C, 1T-MoSe2/TiC-C, 2H-MoSe2/TiC-Cand N-MoSe2/TiC-C
samples are presented in Figure S3. Apart from the peaks of Ti6Al4V foil substrate, five
diffraction peaks characteristic of TiC phase (JCPDS 65-0242) and one broad diffraction
peak characteristic of amorphous carbon at 26o are detected in the TiC-C arrays. Except for
the diffraction peaks of TiC-C backbone, the other peaks of the 1T-MoSe2/TiC-C sample are
in good agreement with 1T-phase MoSe2, which has disappeared peak of (002) plane and
strong (100) plane. As for the 2H-MoSe2/TiC-C arrays, thetypical diffraction peaks of (002)
and (100) planes are clearly observed, and all diffraction peaks of MoSe2 are indexed well
with the 2H-phase MoSe2 (JCPDS 77-1715). After N doping, typical diffraction peaks of
TiC-C and MoSe2 remain in the N-MoSe2/TiC-Carrays, but noteworthy that the relative
intensities of (100) and (002) peaks sharply decrease (Figure S3a). Furthermore, the (002)
and (110) peaks shift leftward as compared to the 2H-MoSe2/TiC-C sample.[17, 30] These
results are consistent with the TEM analysis above. Another interesting finding is that there is
no shift for the diffraction peaks of TiC-C in all three samples. The XRD results indicate that
1T-phase MoSe2 can be easily changed into 2H-phase after heat treatment, and additionally,
This article is protected by copyright. All rights reserved.
13
confirmed by Raman and XPS analyses. The characteristic Raman peaks of MoSe2 in the
1T-MoSe2/TiC-C are located at 237 and 285 cm−1 (Figure S3b), respectively, owing to the
characteristic A1g (out of plane) and E12g (in plane) of MoSe2.[6] Note that the characteristic
peak of A1g in the 2H-MoSe2/TiC-C has a slight shift to a larger wavelength compared to the
1T-MoSe2/TiC-C, implying the phase change from 1T-MoSe2 to 2H-MoSe2. Noticeably,
FDHM (full depth at half maximum) of A1g peak shown in the inset of Figure S3b increases
as the phase change proceeds. Generally, the 1T-MoSe2 shows weak Raman intensity, while
the 2H phase has strong intensity. As for the N-MoSe2/TiC-C, the intensity of FDHM is in
the middle of 1T-MoSe2/TiC-Cand 2H-MoSe2/TiC-C, suggesting the co-existence of 1T and
2H-MoSe2.[17]
The XPS survey and high-resolution spectra of C, Ti, Se, Mo and N elements are depicted
in Figure S3 and Figure S4. In Figure S3c, two peaks at 228.3 eV (Mo 3d5/2) and 231.4 eV
(Mo 3d3/2) characteristic of 1T-MoSe2 are observed for the 1T-MoSe2/TiC-Carrays.[31] After
heat treatment in Ar, the Mo 3d spectra change and shift obviously. Two peaks located at 229
eV (Mo 3d5/2) and 232.1 eV (Mo 3d3/2) in the 2H-MoSe2/TiC-Care indexed well with
characteristic of 2H-MoSe2.Upon doping, the Mo 3d5/2 and Mo 3d3/2 peak broadens can be
deconvoluted to four peaks, corresponding to the co-existence of 1T and 2H-MoSe2.[17] Such
This article is protected by copyright. All rights reserved.
14
spectrum mainly exhibits two typical peaks at 54.8 and 53.8 eV originating from Se ions for
the 1T-MoSe2/TiC-C arrays.[11, 17, 32] After annealing in argon, the peaks of 1T-phase vanish
and two typical peaks of Se (55.4 and 54.5 eV) characteristic of 2H-MoSe2 start to appear.
Compared to other two samples, the peak intensity of 2H phase decreases and the 1T phase
increases in the N-MoSe2/TiC-C arrays. These results further confirm the co-existence of 1T
and 2H-MoSe2 in the N-MoSe2/TiC-Csample. The presence of TiC is also confirmed by XPS
result shown in Figure S4b-c. And the N doping is also verified by the peak at 398.5 eV
(Figure S4d), which is due to the N-Mo bond.[33, 34] All these results mutually support each
other and indicate the successful preparation of N-MoSe2/TiC-C arrays.
To understand the phase change of MoSe2 via N doping, we simulated the experimental
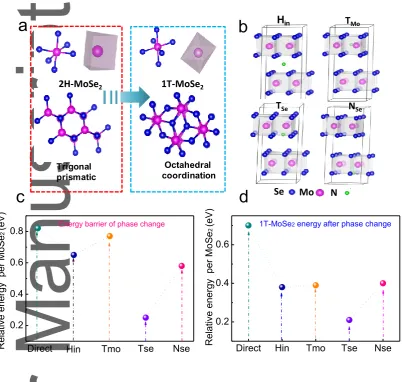
results with the aid of in-depth theoretical study. We considered four possible doping sites in
MoSe2 (Figure 3a-b) based upon two MoSe2 phases (Figure 3a-b): Hin, TMo, TSe and NSe. Hin
stands for the interstitial site between the MoSe2 layers and at the center of the six-membered
ring formed by Se-Mo-Se atoms in both the upper and lower layers; TMo represents the
interstitial site at the center of the four Mo atoms within a MoSe2 layer; TSe means the
interstitial site at the center of the four Se atoms within a MoSe2 layer; NSe indicates that N
replaces the position of Se atom. Since N source in the experiment is ammonia and N has
This article is protected by copyright. All rights reserved.
15
According to simulated band structures and density-of-states (DOS) results (Figure S5), the
electronic properties of 2H-MoSe2 before and after N doping are quite different. The band
gap of pure 2H-MoSe2 is 1.22eV, while the structures with N-doped MoSe2 in Hin and TMo
site are quasi-metallic. The band gaps of the N-doped MoSe2 in TSe and NSe configurations
are 0.46 eV and 0.51 eV, respectively, much smaller than that of the pure 2H-MoSe2. These
results suggest that N doping can improve electronic conductivity and the effects from
different doping sites are different.According to this observation, N doping can promote the
phase transition from 2H-MoSe2 to 1T-MoSe2. In order to gain the insight into the
transformation pathway and the effect of different N doping sites on the transformations, we
have performed the first-principles calculations to study the pathway and energy barriers of
the phase transition from 2H-MoSe2 to 1T-MoSe2. The calculation results show that the
structure transformation involves stretching of unit cell along the c-axis and shuffling of the
Se atoms in the unit cell. The transformation pathways and energy from 2H-MoSe2 to
1T-MoSe2 by N-doping in different sites obtained from our calculations are shown in Figure
S6. Without N doping, the energy barrier would be 0.82 eV. After N-doping, the barrier is
reduced to 0.77, 0.65, 0.58 and 0.25 for TMo, Hin, NSe, and TSe doping configurations,
respectively (Figure 3c). The corresponding energy of simulated 1T-MoSe2 phase is also
This article is protected by copyright. All rights reserved.
16
phase from direct conversion is 0.7 eV (Figure 3d and S6), but this relative energy is reduced
to 0.38 eV, 0.39 eV, 0.21 eV, and 0.40 eV with N-doping at the Hin, TMo, TSe and NSe
configurations, respectively (Figure 4d and S6). It is indicated that the phase transition from
2H-MoSe2 to 1T-MoSe2 is more favorable by N doping. When N doping at TSe site, the phase
transition barrier (0.25 eV) can be more easily overcome, and the formed 1T-MoSe2 would be
more stable than other doping sites. It is known that 2H-MoSe2 belongs to 6 m space-group,
where Mo and the surrounding Se form trigonal prisms. 1T-MoSe2 elongs to m1
space-group, where Mo and the surrounding Se are octahedrally coordinated. N doping in
2H-MoSe2 changes the distribution of Se and distort the trigonal prism near the doping site,
which induces stress in the crystal and causes the cell to stretch in the c direction. This can be
more clearly seen in N doping at TSe. When N doped at the center of the four Se atoms, it is
easier to promote the distortion of Se and thus causing the phase transition.
The electrochemical HER performances (Figure 4) of all samples were detected by using a
simple three-electrode setup in 0.5 M H2SO4 solution. The N-MoSe2/TiC-C electrode
displays the best HER performance with the smallest overpotential (-106 mV vs. RHE at 10
mA cm-2) and excellent large-current HER performance of -137 mV at 100 mA cm-2, better
than the 1T-MoSe2/TiC-C (-187 mV and -219 mV), 2H-MoSe2/TiC-C (-240 mV and -365
This article is protected by copyright. All rights reserved.
17
activity of TiC-C suggests that the TiC-C core mainly act as a highly conductive support for
the MoSe2 nanosheets. The superior catalytic performance in the N-MoSe2/TiC-C electrode is
attributed to the introduction of N dopant, further supported by the Tafel slope. According to
classic theory[35, 36], Tafel slope can evaluate the limiting step based on three mechanisms of
Volmer reaction (Tafel slope 120 mV dec−1), Heyrovsky reaction (Tafel slope 40 mV
dec−1) and Tafel reaction (Tafel slope 29 mV dec−1). The most advanced and fastest HER
process should be determined by Tafel reaction process of hydrogen recombination, which
implies that smaller Tafel slope dictates faster HER process. In our study, the Tafel slopes of
TiC-C, 1T-MoSe2/TiC-C, 2H-MoSe2/TiC-C and N-MoSe2/TiC-Celectrodes are 390, 42, 110
and 32 mV dec−1, respectively (Figure 4b), suggesting N-MoSe2 samples possess the fastest
HER process. It indicated that the HER rate of N-MoSe2/TiC-C arrays are determined by the
Tafel reaction mechanism. The HER activities of our N-MoSe2/TiC-C sample is not only
superior to those reported Mo-based materials [14, 23, 37-39] (Figure 4c and Table S1), such as
MoSe2/Mo,[17] MoSe2/CNTs[6] MoSe2/C[40] MoS2/SnO2[41] and S-MoSe2,[42] but even
surprisingly higher than the Pt/C (Tafel slope 34 mV dec−1).[6] To measure the
electrochemical stability of our samples, the cycle durability on 1T-MoSe2/TiC-C,
2H-MoSe2/TiC-C and N-MoSe2/TiC-C arrays was performed at 100 mA cm-2 for 4 h,
This article is protected by copyright. All rights reserved.
18
up to 99.5% after 4 h operation, better than the 1T-MoSe2/TiC-C electrode (98.3%) and
2H-MoSe2/TiC-C(99%), which reveals that the N-MoSe2/TiC-C arrays possess the most
stable life span with excellent large-current catalytic activity over long-time testing. In
addition, similar cycling results are demonstrated at the low current density of 10 mA cm-2
(Figure S7a). SEM-TEM images and XRD result after 4h-HER test demonstrate that the
phase and core/shell morphology of the N-MoSe2/TiC-C arrays are still well maintained
(Figure S8), further revealing their excellent cycling stability. In addition, the Faradic
efficiency was estimated by comparing the experimentally produced gas volume with the
theoretically calculated one. Figure S9 displays that the amount of evolved H2 is in good
agreement with the calculated value, suggesting a Faradic efficiency of about 100%. To
further deepen the understanding of the improved HER performance of the N-MoSe2/TiC-C
electrode, the effective electrochemical active surface areas (ECSA) of all samples were
estimated by testing the double-layer capacitance (Cdl) based on the CV results at different
scan rates (Figure S10).[35, 36] The obtained current density is plotted as a function with scan
rates in the Figure 4e. Noticeably, the ECSA of N-MoSe2/TiC-C electrode is up to 57 mF
cm-2, substantially larger than the TiC-C (0.5 mF cm-2), 1T-MoSe2/TiC-C (47 mF cm-2) and
2H-MoSe2/TiC-C (12 mF cm-2) electrodes, indicating the N doping can enhance the
This article is protected by copyright. All rights reserved.
19
carried out to additionally investigate electrochemical reaction kinetics during the HER
process. The semicircle shown in Nyquist plot (Figure 4f) indicates the charge transfer
resistance (Rct) of H+ reaction between electrode and electrolyte. Spectacularly, both the
N-MoSe2/TiC-C and 1T-MoSe2/TiC-C electrodes only present a slopewithout obviously
depressed semicircles compared to the TiC-C and 2H-MoSe2/TiC-C electrodes, suggesting
the fast hydrogen evolution reaction. In contrast, the depressed semicircles for the TiC-C and
2H-MoSe2/TiC-C electrodes are much bigger, suggesting their slow HER process.
Furthermore, the solution resistance (Rs) of sample is small due to the highly conductive
TiC-C skeleton arrays. It is noteworthy that highly conductive TiC-C backbone can decrease
the solution resistance, but itself with poor HER performance leading to high Rct value for
HER. But the N-MoSe2/TiC-C electrode still exhibits the smallest solution resistance (1.12
Ω), suggesting that the introduction of N dopant can improve the electronic conductivity.
Meanwhile, kinetic energy barrier and pathway of the HER activity on MoSe2 surface are
also important parameters to explain the surface performance of MoSe2.[43] In order to check
whether N doping can help to improve the HER activity, we also used the nudged elastic
band method to study the process of HER on the surfaces of 2H-MoSe2, 1T-MoSe2, and
N-MoSe2, respectively. As shown in Figure 5, the process mainly involves hydrogen atom
This article is protected by copyright. All rights reserved.
20
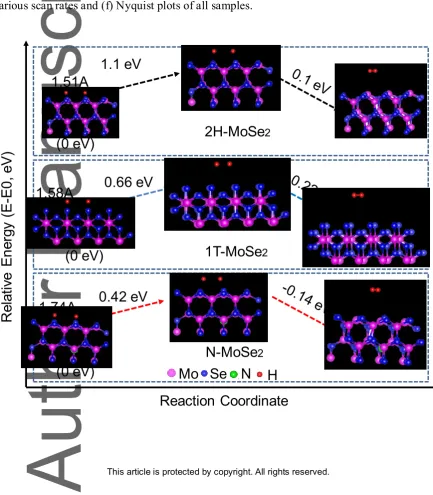
(Figure 5), the energy barrier of two hydrogen atoms absorbed on the 2H-MoSe2, 1T-MoSe2,
and N-MoSe2 to transform into a H2 molecule is gradually reduced, from 1.10 eV, 0.66 eV to
0.42 eV. On the other hand, when H2 formed and released, the N-MoSe2 electrode has better
thermodynamic stability than the 2H-MoSe2 and 1T-MoSe2 electrode. The shortest bond
lengths of H-Se are 1.49 Å, 1.58 Å, and 1.74 Å on 2H-MoSe, 1T-MoSe2, and N-doped
2H-MoSe2, respectively. Since the bond length is inversely proportional with H-Se bond
strength, this indicates hydrogen atoms desorb easier from Se atom in N-MoSe2/TiC-C
sample and form H2 molecule more effectively. Although 1T-MoSe2 exhibits more suitable
kinetic energy barrier for HER than 2H-MoSe2, N-MoSe2 still shows better HER
performance than 1T-MoSe2 promoting H2 formation.
In summary, we have constructed high-quality N-MoSe2/TiC-C shell/core arrays by
morphological engineering in combination with nitrogen doping. Compared to other
counterparts (1T-MoSe2 and 2H-MoSe2), the N-MoSe2/TiC-C arrays with coexisted 1T- and
2H-MoSe2 show improved electrochemical active surface area and much reduced charge
transfer resistance and therefore boosted catalytic reaction sites and reaction kinetics. DFT
calculation unravels much smaller energy barrier, longer H-Se bond length and diminished
bandgap in N-MoSe2/TiC-C arrays in terms of promoting H2 formation, suggesting
This article is protected by copyright. All rights reserved.
21
SACTEM. Consequently, the designed N-MoSe2/TiC-C arrays exhibit extraordinary HER
performance at large current density (i.e. 100 mA cm-2) and low Tafel slope of 32 mV per
decade, much more superior than other Mo-based compounds and even noble metal catalyst
such as Pt/C. Remarkable potential retention as high as 99.5% under large current density of
100 mA cm-2 during 4 h-HER process is also able to be achieved, demonstrating excellent
electrochemical stability of our designed nanoarchitecture.
Our work, for the first time, clearly demonstrates the phase change from 2H-MoSe2 to
1T-MoSe2 via NH3 treatment and verifies the coexistence of 1T-MoSe2 and 2H-MoSe2 in the
N-doped MoSe2 by SACTEM. In addition, we first propose the plausible phase
transformation mechanism (1T 2H 1T-2H) and different doping sites of N atom with
the help of DFT calculation. Our research provides valuable reference to understand phase
transformation mechanism of 2D transition metal dichalcogenides (TMDs) via hetero-atom
doping, and also opens a new door to deeply understand the enhanced HER activity of metal
selenides by nitrogen doping.
Supporting Information
This article is protected by copyright. All rights reserved.
22 Acknowledgements
This work is supported by National Natural Science Foundation of China (Grant No.
51728204, 51772272, 51502263 and 51462008), Fundamental Research Funds for the
Central Universities (Grant No. 2018QNA4011), Qianjiang Talents Plan D (QJD1602029),
Startup Foundation for Hundred-Talent Program of Zhejiang University, and the
Fundamental Research Funds for the Central Universities (2015XZZX010-02), Key Research
and Development Program of Hainan Province (ZDYF2017166). Guangdong Natural Science
Funds for Distinguished Young Scholar (2014A030306048), and Pearl River S&T Nova
Program of Guangzhou (201610010080). Work at Ames Laboratory was supported by the US
Department of Energy, Basic Energy Sciences, Division of Materials Science and
Engineering under Contract No. DE-AC02-07CH11358.
References
[1] T. Ling, D.-Y. Yan, H. Wang, Y. Jiao, Z. Hu, Y. Zheng, L. Zheng, J. Mao, H. Liu, X.-W.
Du, Nat. Commun. 2017, 8, 1509.
[2] Q. Gong, L. Cheng, C. Liu, M. Zhang, Q. Feng, H. Ye, M. Zeng, L. Xie, Z. Liu, Y. Li,
ACS Catalysis 2015, 5, 2213.
[3] J. Shi, X. Wang, S. Zhang, L. Xiao, Y. Huan, Y. Gong, Z. Zhang, Y. Li, X. Zhou, M.
This article is protected by copyright. All rights reserved.
23
[4] L. Yang, X. Li, G. Zhang, P. Cui, X. Wang, X. Jiang, J. Zhao, Y. Luo, J. Jiang, Nat.
Commun. 2017, 8, 16049.
[5] J. J. Yan, Y. F. Zhang, Y. P. Huang, Y. E. Miao, T. X. Liu, Adv. Mater. Inter. 2017, 4.
[6] Y. Huang, H. Lu, H. Gu, J. Fu, S. Mo, C. Wei, Y.-E. Miao, T. Liu, Nanoscale 2015, 7,
18595.
[7] H. Li, S. Chen, X. Jia, B. Xu, H. Lin, H. Yang, L. Song, X. Wang, Nat. Commun. 2017,
8, 15377.
[8] K. Zhang, C. Li, Y. Zhao, X. Yu, Y. Chen, Phys. Chem. Chem. Phys. 2015, 17, 16609.
[9] K. Zhang, Y. Zhao, S. Zhang, H. Yu, Y. Chen, P. Gao, C. Zhu, J. Mater. Chem.A 2014,
2, 18715.
[10] C. Tang, H. S. Wang, H. F. Wang, Q. Zhang, G. L. Tian, J. Q. Nie, F. Wei, Adv. Mater.
2015, 27, 4516.
[11] S. J. Deng, Y. Zhong, Y. X. Zeng, Y. D. Wang, Z. J. Yao, F. Yang, S. W. Lin, X. L.
Wang, X. H. Lu, X. H. Xia, J. P. Tu, Adv. Mater. 2017, 29, 1700748.
[12] J. Y. Zhang, T. T. Wang, P. T. Liu, Y. G. Liu, J. Ma, D. Q. Gao, Electrochim. Acta 2016,
This article is protected by copyright. All rights reserved.
24
[13] J. Yan, Y. Zhang, Y. Huang, Y. E. Miao, T. Liu, Adv. Mater. Inter. 2017, 4, 1600825.
[14] Z. Lei, S. Xu, P. Wu, Phys. Chem. Chem. Phys. 2016, 18, 70.
[15] M. Jiang, J. J. Zhang, M. H. Wu, W. J. Jian, H. T. Xue, T. W. Ng, C. S. Lee, J. Xu, J.
Mater. Chem.A 2016, 4, 14949.
[16] Y. Yin, Y. M. Zhang, T. L. Gao, T. Yao, X. H. Zhang, J. C. Han, X. J. Wang, Z. H.
Zhang, P. Xu, P. Zhang, X. Z. Cao, B. Song, S. Jin, Adv. Mater. 2017, 29.
[17] Y. Qu, H. Medina, S. W. Wang, Y. C. Wang, C. W. Chen, T. Y. Su, A. Manikandan, K.
Wang, Y. C. Shih, J. W. Chang, Adv. Mater. 2016, 28, 9831.
[18] H. T. Wang, D. S. Kong, P. Johanes, J. J. Cha, G. Y. Zheng, K. Yan, N. A. Liu, Y. Cui,
Nano Lett. 2013, 13, 3426.
[19] S. Deng, Y. Zhong, Y. Zeng, Y. Wang, X. Wang, X. Lu, X. Xia, J. Tu, Adv. Sci. 2017.
[20] D. Sun, S. Feng, M. Terrones, R. E. Schaak, Chem. Mater. 2015, 27, 3167.
[21] W. Guo, Y. Chen, L. Wang, J. Xu, D. Zeng, D.-L. Peng, Electrochim. Acta 2017, 231,
This article is protected by copyright. All rights reserved.
25
[22] C. Dai, Z. Zhou, C. Tian, Y. Li, C. Yang, X. Gao, X. Tian, J. Phys. Chem. C 2017, 121,
1974.
[23] S. Mao, Z. Wen, S. Ci, X. Guo, K. K. Ostrikov, J. Chen, Small 2015, 11, 414.
[24] Y. Liu, L. Ren, Z. Zhang, X. Qi, H. Li, J. Zhong, Sci. Rep. 2016, 6, 22516.
[25] G. D. Park, J. H. Kim, S.-K. Park, Y. C. Kang, ACS Appl. Mater. Interfaces 2017, 9,
10673.
[26] Y. Yao, K. Huo, L. Hu, N. Liu, J. J. Cha, M. T. Mcdowell, P. K. Chu, Y. Cui, ACS Nano
2011, 5, 8346.
[27] S. Liu, X. Xia, Y. Zhong, S. Deng, Z. Yao, L. Zhang, X. B. Cheng, X. Wang, Q. Zhang,
J. Tu, Adv. Energy Mater. 2017, 1702322.
[28] M. Jiang, J. Zhang, M. Wu, W. Jian, H. Xue, T.-W. Ng, C.-S. Lee, J. Xu, J. Mater.
Chem.A 2016, 4, 14949.
[29] J. Zhang, T. Wang, P. Liu, Y. Liu, J. Ma, D. Gao, Electrochim. Acta 2016, 217, 181.
[30] C. Tan, X. Cao, X.-J. Wu, Q. He, J. Yang, X. Zhang, J. Chen, W. Zhao, S. Han, G.-H.
This article is protected by copyright. All rights reserved.
26
[31] D. Voiry, A. Goswami, R. Kappera, C. d. C. C. e Silva, D. Kaplan, T. Fujita, M. Chen, T.
Asefa, M. Chhowalla, Nature chemistry 2015, 7, 45.
[32] N. Rohaizad, C. C. Mayorga-Martinez, Z. k. Sofer, M. Pumera, ACS Appl. Mater.
Interfaces 2017, 9, 40697.
[33] K. Inumaru, K. Baba, S. Yamanaka, Physica B: Condensed Matter 2006, 383, 84.
[34] P. Liu, Y. Liu, W. Ye, J. Ma, D. Gao, Nanotechnology 2016, 27, 225403.
[35] Y. Zhang, B. Ouyang, J. Xu, G. Jia, S. Chen, R. S. Rawat, H. J. Fan, Angew. Chem. Int.
Ed. 2016, 55, 8670.
[36] J. W. Huang, H. Q. Liu, B. Jin, M. Liu, Q. C. Zhang, L. Q. Luo, S. J. Chu, S. Chu, R. F.
Peng, Nanotechnology 2017, 28.
[37] H. Tang, K. Dou, C.-C. Kaun, Q. Kuang, S. Yang, J. Mater. Chem.A 2014, 2, 360.
[38] K. Zhang, Y. Zhao, D. Fu, Y. Chen, J. Mater. Chem.A 2015, 3, 5783.
[39] B. Qu, X. Yu, Y. Chen, C. Zhu, C. Li, Z. Yin, X. Zhang, ACS Appl. Mater. Interfaces
2015, 7, 14170.
This article is protected by copyright. All rights reserved.
27
[41] Y. Huang, Y.-E. Miao, L. Zhang, W. W. Tjiu, J. Pan, T. Liu, Nanoscale 2014, 6, 10673.
[42] C. Xu, S. Peng, C. Tan, H. Ang, H. Tan, H. Zhang, Q. Yan, J. Mater. Chem.A 2014, 2,
5597.
[43] E. Skúlason, G. S. Karlberg, J. Rossmeisl, T. Bligaard, J. Greeley, H. Jónsson, J. K.
Nørskov, Phys. Chem. Chem. Phys. 2007, 9, 3241.
[44] D.-Y. Wang, M. Gong, H.-L. Chou, C.-J. Pan, H.-A. Chen, Y. Wu, M.-C. Lin, M. Guan,
This article is protected by copyright. All rights reserved.
This article is protected by copyright. All rights reserved.
[image:31.595.96.490.113.766.2]29
Figure 1. (a, d, g, j) Schematic illustration of the synthesis of N-MoSe2/TiC-C arrays. SEM
images of (b, c) TiC-C arrays; (e, f) 1T-MoSe2/TiC-C arrays; (h, i) 2H-MoSe2/TiC-C arrays
This article is protected by copyright. All rights reserved.
[image:32.595.92.508.121.574.2]30
Figure 2. TEM-HRTEM images and SAED patterns of different MoSe2 nanosheets: (a, d, g,
h) 1T-MoSe2/TiC-C; (b, e, h, k) 2H-MoSe2/TiC-C and (c, f, i, l) N-MoSe2/TiC-C samples.
This article is protected by copyright. All rights reserved.
[image:33.595.90.493.148.530.2]31
Figure 3. (a) Schematic crystal structures of 2H-MoSe2 and 1T-MoSe2; Schematic
representations of the N dopant at the Hin site, TMo site, TSe site, and substitution site (NSe),
respectively; (c) Kinetic energy barrier of phase transition from 2H-MoSe2 to 1T-MoSe2 by N
doping at different sites; (d) Energy of 1T-MoSe2 obtained after phase change with different
N sites. 1T-MoSe2 Trigonal prismatic Octahedral coordination 2H-MoSe2 Mo Se N Hin TSe
a
b
c
d
TMo NSe 0.2 0.4 0.6 0.8 Nse Tse Tmo Hin Rel ati ve energy per MoS
e
2
(eV)
Direct
Energy barrier of phase change
Direct Hin Tmo Tse Nse
0.2 0.4 0.6
1T-MoSe2 energy after phase change
Rel
ati
ve e
nergy per MoS
e
2
This article is protected by copyright. All rights reserved.
32 -0.4 -0.3 -0.2 -0.1 0.0 0.1 -100 -80 -60 -40 -20 0 TiC-C
1T-MoSe2/TiC-C
2H-MoSe2/TiC-C N-MoSe2/TiC-C
Curre
nt density
(mA cm
-2 )
Potential (V vs. RHE)
0.5 1.0 1.5 2.0
0.1 0.2 0.3 0.4
Overpotential (V)
Log current density (mA cm-2)
32 mV Dec-1 42 mV Dec-1 110 mV Dec-1
390 mV DecTiC/C -1
1T-MoSe2/TiC-C 2H-MoSe2/TiC-C
N-MoSe2/TiC-C
4 8 12 16 20
0.0 0.5 1.0 1.5 2.0
2.5 TiC-C
1T-MoSe2/TiC-C
2H-MoSe2/TiC-C N-MoSe2/TiC-C
j / mA
cm
-2
Scan rates / mV s-1
0.5 mF cm-2
12 mF cm-2 48 mF cm-2 57 mF cm-2
0 50 100 150 200
0 50 100 150 200
Z' ()
-Z''
(
) TiC-C
1T-MoSe2/TiC-C 2H-MoSe2/TiC-C
N-MoSe2/TiC-C
0 1 2 3 4
0.1 0.2 0.3 0.4
1T-MoSe2/TiC-C
100 mA cm-2
Time (h)
Overpotential (V)
2H-MoSe2/TiC-C
N-MoSe2/TiC-C
a
b
c
d
e
f
80 120 160 200 240
20 40 60 80 100 This work This work Ref.41 Ref.6 Ref.38 Ref.23 Ref.14 Ref.39 Ref.17 Ref.37 Ref.40 Tafel slope (mV Dec -1 )
Potential at 10 mA cm-2 (V vs. RHE)
MoSe2/rGO
MoS2/SnO2
MoSe2
MoSe2/CNT
Porous MoSe2
MoSe2/Graphene
Mo2C S-MoSe2
N-MoSe2/TiC-C MoSe2/Mo
1T-MoSe2/TiC-C
This article is protected by copyright. All rights reserved.
[image:35.595.79.513.244.739.2]33
Figure 4. (a) LSV curves and (b) Tafel plots of the TiC-C, 1T-MoSe2/TiC-C,
2H-MoSe2/TiC-CandN-MoSe2/TiC-C electrodes. (c) HER performance comparison of
different Mo-based materials; (d) Electrochemical stability of the 1T-MoSe2/TiC-C,
2H-MoSe2/TiC-CandN-MoSe2/TiC-C electrodes. (e) The ratio of current density with
various scan rates and (f) Nyquist plots of all samples.
This article is protected by copyright. All rights reserved.
[image:36.595.189.404.488.661.2]34
Figure 5. Calculatedpotential barriers of hydrogen evolution reaction on 2H-MoSe2,
1T-MoSe2, and N-MoSe2 samples.
Keywords: Molybdenum selenide; Nitrogen doping; Phase modulation; Hydrogen evolution
reaction; Core/shell arrays
Shengjue Deng‡, Fan Yang‡, Qinghua Zhang, Yu Zhong, Yinxiang Zeng, Shiwei Lin*, Xiuli
Wang, Xihong Lu*, Cai-Zhuang Wang, Lin Gu, Xinhui Xia* and Jiangping Tu
Phase Modulation of (1T-2H)-MoSe2/TiC-C Shell/Core Arrays via Nitrogen Doping for
This article is protected by copyright. All rights reserved.
35
In this work, we report phase- and morphology-modulated N-doped MoSe2/TiC-C shell/core
arrays for the first time. We successfully realize the continuous phase modulation of MoSe2
(1T 2H 1T-2H) on the TiC-C skeleton via NH3 treatment and demonstrated by spherical
aberration electron microscope. In addition, we first propose the plausible phase
transformation mechanism (1T 2H 1T-2H) and different doping sites of N atom with the
help of DFT calculation. The designed N-MoSe2/TiC-C arrays exhibit extraordinary HER