RP-HPLC Method Development and Validation for the Simultaneous Estimation of Rosuvastatin and Ezetimibe in Tablet Dosage Form
9
0
0
Full text
(2) 14 Vadthya Rajashekar et al / Int. J. of Pharmacy and Analytical Research Vol-3(1) 2014 [13-21]. alone has been determined by Spectrophotometric methods 7-9 Stability indicating method10, HPTLC11and RP-HPLC12-14. Ezetimibe was also estimated using UV-method 15-17, Derivative Spectroscopy 18-19and LC-MS/MS20. To the best of knowledge, only three HPLC Methods21-23, has. Figure-1: Molecular structure of Rosuvastatin Calcium. MATERIALS AND METHODS Chemicals/ Reagents and Solvents Rosuvastatin-10mg(RosuvasR10) and Ezetimibe10mg9(EzedocR)10 were obtained from, Rambaxy Laboratories Limited, .Himachal Pradesh and Hovero Labs Limited, Himachal Pradesh, respectively. Double Distilled Water (HPLC grade), Methanol(HPLC grade), Acetonitrile (HPLC grade), orthophosphoric acid and Potassium-dihydrogen phosphate were of reagent grade.. Instrumentation and Equipments The HPLC analysis was accomplished on WATERS high pressure liquid chromatography outfitted with 515 reciprocating dual column HPLC pump, a manually operating Rheodyne injector with 20μL sample loop, X-terra C8 4.6mm x 150mm analytical column reversed-phase material. been developed for the simultaneous determination of both the drugs in tablets. The present research work describes the rapid, accurate, sensitive and reproducible RP-HPLC method for simultaneous estimation of RosuvastatinCalcium and Ezetimibe from the tablet formulation.. Figure-2: Molecular structure of Ezetimibe. of 5μ size and a 2487 model UV-Visible detector. All the parameters of HPLC were controlled by N 2000 chromatographic system software. Other instruments used were TECHCOMP UV-Vis spectrophotometer of model 2310, Shimadzu electronic balance of model XEX-200, ADWA of model AD102U digital pH meter and ENERTECH of model SE60US ultrasonic bath sonicator.3.3. ANALYTICAL METHOD DEVELOPMENT Optimization of UV conditions Initially method development work was started by taking UV-visible spectra from 200-400 nm of rosuvastatin (10ppm) and Ezetimibe (10ppm) standard solutions. By observing the overlain spectra of standard solutions λmax 237 nm was taken for trials to develop HPLC method. The spectrum was show below. Figure-3. Isobestic point of Rosuvastatin and ezetimibe.. www.ijpar.com.
(3) 15 Vadthya Rajashekar et al / Int. J. of Pharmacy and Analytical Research Vol-3(1) 2014 [13-21]. Optimized Method Parameters Mobile phase : Column (Stationary Phase : 5m Make extra) or equivalent Flow rate : Detector wavelength : Retention time : Ezetimibe-3.173 min Column temp : Injection volume :. Acetonitrile: Phosphate buffer (pH 3.0): (60:40 v/v) Symmetry C8 (4.6mm x100mm, 1.0 ml / min 237 nm Rosvastatin -2.490 min Ambient. 20l. Figure- 4 Optimized chromatogram. PROCEDURE FOR PREPARATION OF SOLUTION Preparation of buffer. From the above stock solution, 1 ml of the a solution was pipetted into a 10 ml volumetric flask and diluted up to the mark with diluent.. Take 1000ml of HPLC grade water. Dissolve 2.72 grams of Potassium di hydrogen phosphate salt and Adjust the pH to 3.0 with orthophosphoric acid.. Sample Solution Preparation. Preparation of mobile phase A mixture of above prepared buffer 400 ml (40%), and 600 ml of HPLC grade Acetonitrile (60%) were mixed and degassed in ultrasonic water bath for 5 minutes. The mobile phase was filterred through 0.45 µ filter under vacuum.. Accurately weighed and transferred tablet powder equivalent to 10mg of rosuvastatin and 10 mg of Ezetimibe into a 100 ml clean dry volumetric flask and added about 70ml of diluent. It was sonicated to dissolve completely and made volume up to the mark with the same diluent. (Stock solution) From the above stock solution, 1ml of the solution was pipetted into a 10 ml volumetric flask and diluted up to the mark with diluent.. Diluent Preparation Use the Mobile phase as Diluent.. Procedure. ASSAY Preparation of Standard Solution. 20 µL of the standard and sample solutions were injected into the chromatographic system and areas for the Rosuvastatin and Ezetimibe peaks were measured. %Assay was calculated by using the formulae.. Accurately weighed and transferred 10mg of rosuvastatin and 10 mg of Ezetimibe working standard into a 100 ml clean dry volumetric flask and added about 70 ml of diluent. It was sonicated to dissolve completely and made volume up to the mark with the same diluent. (Stock solution). Calculation Assay % = AT WS DT P Avg. Wt -------- x -------x --------- x-------x------------- X 100 AS DS WT 100 Label Claim. Where: www.ijpar.com.
(4) 16 Vadthya Rajashekar et al / Int. J. of Pharmacy and Analytical Research Vol-3(1) 2014 [13-21]. AT = Average area counts of sample preparation. AS = Average area counts of standard preparation. WS = Weight of working standard taken in mg. P = Percentage purity of working standard LC = Label Claim mg/ml.. Limit of detection and Limit of quantitation Sensitivity of the proposed method was estimated in terms of Limit of Detection (LOD) and Limit of Quantitation (LOQ). LOD = 3.3 x ASD/S and LOQ = 10 x ASD/S, Where, ‘ASD’ is the average standard deviation and ‘S’ is the slope of the line.. ANALYTICAL METHOD VALIDATION The HPLC method was validated in accordance with ICH guidelines.. Accuracy Accuracy was carried out by % recovery studies at three different concentration levels. To the preanalyzed sample solution of Rosuvastatin and Ezetimibe a known amount of standard drug powder of Rosuvastatin and Ezetimibe were added at 50%, 100% and 150 % level.. Precision The system precision of the method was verified by five replicate injections of standard solution containing Rosuvastatin and Ezetimibe. The method precision was carried out the analyte five times using the proposed method. Repeatability was measured by multiple injections of a homogenous sample of Rosuvastatin and Ezetimibe.. Linearity The linearity was determined separately for Rosuvastatin and Ezetimibe Linearity of the method was studied by injecting 5 concentrations of both drugs prepared in methanol and calibration curves were constructed by plotting peak area against the respective concentrations.. Robustness Robustness was evaluated by making deliberate variations in method parameters such as variation of wave length; flow rate and change in mobile phase composition. The robustness of the method was studied for Rosuvastatin and Ezetimibe. RESULTS Selection of Chromatographic Conditions and Optimization of Mobile Phase Mobile phase was optimized to separate Rosuvastatin and Ezetimibe using Symmetry C8 column (100 mm x 4.6 mm i.d., 5μm). Initially, Acetonitrile and phosphate buffer and methanol in the Equal proportions were tried as mobile phase but the splitting of the peaks for both these drugs was observed. Therefore, after adjustment of pH of mixed phosphate buffer to 3.0 with orthophosphoric acid, and mobile phase composition (phosphate buffer, ACN in 40:60 % v/v) was tried for resolution of both drugs. Good resolution and symmetric peaks were obtained for both drugs when the pH of the mobile phase (buffer) was adjusted to 3.0. The flow rate of the mobile phase was 1.0 ml/ min-1. Under optimum chromate graphic conditions, the retention time for Rosuvastatin and Ezetimibe was found to be 2.49 and 3.17 min, respectively when the detection was carried out at 237nm. A typical chromatogram of two drugs is shown in (Figure -4).. Table-1 Accuracy data for Rosuvastatin And Ezetimibe. Injection Inj-1 Inj-2 Inj-3 AVG S.D %R.S.D. Rosuvastatin 50% 100% 9208872 1371282 9200584 1397934 9205366 1383795 9204940 1384337 4160.3339 13334.26 0.045 0.963. 150% 1695389 1685300 1687584 1689425 5290.11 0.313. Ezetimibe 50% 1068344 1063819 1062311 1064825 3139.713 0.294. www.ijpar.com. 100% 1566080 1577201 1585054 1576112 95331.79 0.604. 150% 1931607 1951677 1943746 1942343 10108.26 0.520.
(5) 17 Vadthya Rajashekar et al / Int. J. of Pharmacy and Analytical Research Vol-3(1) 2014 [13-21]. Table-2 Accuracy (Recovery) result for Rosuvastatin and Ezetimibe Drug Name. Spike level. Area. Amount Added(mg). Amount Found(mg). % Recovery. Rosuvastatin. 50% 100% 150%. 9204947 1384337 1689425. 45 60 75. 44.99 60 74.96. 99.93 100.00 98.84. 50% 100%. 1064825 1576112. 45 60. 45.09 60.45. 100.6 101.5. 150%. 1942343. 75. 75.01. 100.02. Ezetimibe. % of mean recovery. 99.59. 100.70. Table-3 System precision for Rosuvastatin and Ezetimibe S.No. Injections. Area of rosuvastatin. Area of Ezetimibe. 1. Injection-1. 603934. 702684. 2. Injection-2. 600822. 705354. 3. Injection-3. 618066. 715784. 4 5. Injection-4 Injection-5. 626154 619942. 728094 716584. Average. 613783. 713699. Standard deviation. 788.981. 10134.685. %RSD. 0.1284. 1.420. Table-4 Intermediate precision result for Rosuvastatin and Ezetimibe S.No. Injections. Area of rosuvastatin. Area of Ezetimibe. 1. Injection-1. 628225. 735595. 2. Injection-2. 649686. 756979. 3. Injection-3. 647830. 748467. 4. Injection-4. 630358. 730877. 5. Injection-5. 627171. 734043. Average. 636654. 741191.6. Standard deviation. 11128.24. 11079.133. %RSD. 1.74. 1.49. Table-5 Linearity Results Of Rosuvastatin and Ezetimibe S.No 1. Concentration(µg/ml) 10. Area of Rosuvastatin 199441. Area of Ezetimibe 236255. 2 3. 20 30. 413540 600763. 477534 693188. 4 5. 40 50. 789470 1004803. 920806 1152005. www.ijpar.com.
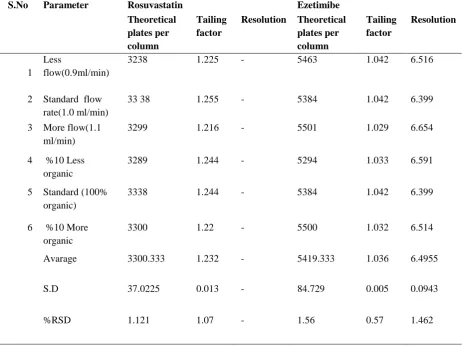
(6) 18 Vadthya Rajashekar et al / Int. J. of Pharmacy and Analytical Research Vol-3(1) 2014 [13-21]. Figure-5: Linearity Graphs Of Rosuvastatin and ezetimibe. Table-6 Result of LOD and LOQ S.No. Drug name. Standard deviation. Slope. LOD. LOQ. 1. Rosuvastatin. 9789.619. 19687. 1.626. 4.927. 2. Ezetimibe. 6332.167. 22748. 0.918. 2.783. Table -7 Robustness Result For Rosuvastatin And Ezetimibe At Different Condition S.No. 1. Parameter. Less flow(0.9ml/min). Rosuvastatin Theoretical plates per column 3238. Tailing factor. Resolution. 1.225. -. Ezetimibe Theoretical plates per column 5463. Tailing factor. Resolution. 1.042. 6.516. 2. Standard flow rate(1.0 ml/min). 33 38. 1.255. -. 5384. 1.042. 6.399. 3. More flow(1.1 ml/min). 3299. 1.216. -. 5501. 1.029. 6.654. 4. %10 Less organic. 3289. 1.244. -. 5294. 1.033. 6.591. 5. Standard (100% organic). 3338. 1.244. -. 5384. 1.042. 6.399. 6. %10 More organic. 3300. 1.22. -. 5500. 1.032. 6.514. Avarage. 3300.333. 1.232. -. 5419.333. 1.036. 6.4955. S.D. 37.0225. 0.013. -. 84.729. 0.005. 0.0943. %RSD. 1.121. 1.07. -. 1.56. 0.57. 1.462. www.ijpar.com.
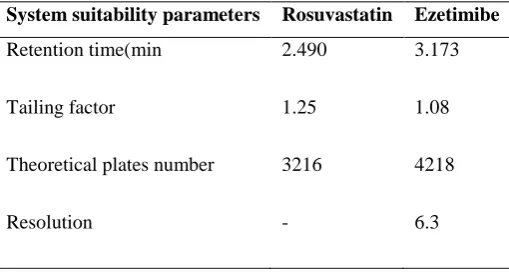
(7) 19 Vadthya Rajashekar et al / Int. J. of Pharmacy and Analytical Research Vol-3(1) 2014 [13-21]. The LOQ for Rosuvastatin and Ezetimibe was found to be 4.927 and 2.783 μg/ml respectively. The low values of LOD and LOQ indicates high sensitivity of the method. The results are shown in Table 6.. RESULTS AND DISCUSSION Accuracy The accuracy of the method studied at three different concentration levels i.e. 50%, 100 % and 150 % showed acceptable % recoveries in the range of 99.59% for Rosuvastatin and 100.70% for Ezetimibe . The results are shown in Table 1&2. Robustness study. The precision study was evaluated on the basis of % RSD value was found to be The RSD values for ROS and EZE were found to be 0.128% and 1.42% respectively Table -3. Robustness of the method was studied by making deliberate changes in the chromatographic conditions and the effects on the results were examined. The low value changes of theoretical plates, tailing factor indicating robustness of the method. The results are shown in Table 7.. Linearity. Analysis of marketed tablet formulation. The linearity was determined separately for Rosuvastatin and Ezetimibe. Linearity of the method was studied by injecting 5 concentrations of both drugs prepared in mobile phase and calibration curves were constructed by plotting peak area against the respective concentrations. The Roauvastatin and Ezetimibe followed linearity in the concentration range of 10-50 μg ml-1 and 1050 μg ml-1; respectively. The results are shown in Table 5.and Fig no 5.. System Suitability Test. Precision. 3 replicates of the samples solutions (20 μL) were injected for quantitative analysis. The amounts of Rosuvastatin and Ezetimibe estimated were found to 99.35 % and 100.77%, respectively. A good separation and resolution of both drugs indicates that there was no interference from the excipients commonly present in pharmaceutical formulations. The results are shown in Table 8.. The system suitability parameters such as resolution, number of theoretical plates and tailing factor were studied and were summarized in Table 9.. Limit of detection and Limit of quantitation The LOD for Rosuvastatin and Ezetimibe was found to be 1.626 and 0.918 μg/ml, respectively.. Table- 8 ASSAY RESULTS Assay Results Drug Rosuvastatin Ezetimibe. Amount present/tablet. % of Assay. 10mg. 99.35. 10mg. 100.77. Table-9 System Suitability parameter System suitability parameters. Rosuvastatin. Ezetimibe. Retention time(min. 2.490. 3.173. Tailing factor. 1.25. 1.08. Theoretical plates number. 3216. 4218. Resolution. -. 6.3. www.ijpar.com.
(8) 20 Vadthya Rajashekar et al / Int. J. of Pharmacy and Analytical Research Vol-3(1) 2014 [13-21]. CONCLUSION. ACKNOWLEDGEMENTS. The developed RP-HPLC method is simple, precise, accurate, selective and reproducible. The method has been found to be adequately rugged and robust and can be used for simultaneous determination of Rosuvastatin and Ezetimibe in tablet formulation. The method was validated as per ICH guidelines.. I like thankful to Pharmatech research labotatories., Hyderabad, India for providing the gift samples of rosuvastatin calcium and ezetimibe. And also to the principal Dr.k.Rajeswar Dutt Smt. Sarojini Ramulamma College of Pharmacy, Mahabubnagar , Andhrapradesh, India and special thanks for Ms. Ramathilagam madam as well as my friends who helped during the project work. REFERENCES [1] Indian Pharmacopoeia. Ghaziabad: The Indian Pharmacopoeia Commission; 2007; 3: 1676-1678. [2] A.G. Olsson, F. McTaggart, A. Raza, Cardiovascular. Drug Rev. 2002; 20: 303–328. [3] P.H. Jones, M.H. Davidson, E.A. Stein, H.E. Bays, J.M. McKinney, E. Miller, V.A. Cain, J.W. Blasetto, Am. J. Cardiol. 2003; 92: 152–160. [4] P.D. Martin, P.D. Mitchell, D.W. Schneck, Br. J.Clin. Pharmacol.2002 ;54: 472–477. [5] The Merck Index, 13th Edn., Budavari. S., Eds., Merck & co., Inc., Whitehouse Station, NJ, 2001. [6] http//:www.Rxlist.com [7] Dannana GS, Marothu VK. Extractive Spectrophotometric methods for the determination of Rosuvastatin calcium in pure form and in pharmaceutical formulations by using safranin O an methylene blue. E J Chem 2007; 4(1):46-49. [8] Gupta A, Mishra P, Shah K. Simple UV Spectrophotometric determination of Rosuvastatin calcium in pure form and in pharmaceutical formulations. E J Chem 2009; 6(1):89-92. [9] Singh RM, Ansari TA, Jamil S, Kumar Y, Mathur SC, Singh GN. Spectrophotometric estimation of Rosuvastatin calcium in tablet formulation. Indian Drugs 2005; 42(4):244-245. [10] Hasumati AR, Rajput SJ, Dave JB, Patel CN. Development and validation of two chromatographic stability-indicating methods for determination of Rosuvastatin in pure form and pharmaceutical preparation. Int J ChemTech Res 2009;1 (3):677-689. [11] Singh RM, Jami S, Ansari TA, Mathur SC, Nivoria CS, Pandey MK et al. Determination of Rosuvastatin calcium in pharmaceutical dosage form by RP-HPLC method. Indian Drugs 2005; 42(2):98-101. [12] Singh SS, Sharma K, Patel H, Jain M, Shah H, Gupta S et al. Estimation of Rosuvastatin in Human plasma by HPLC Tandem Mass Spectroscopic method and its application to [13] Bioequivalence study. J Braz Chem Soc 2005; 16(5):944-950. [14] Thammera RK, Shitut NR, Pasikanti KK, Menon VCA, Venkata VPK, Mullangi R et al. Determination of Rosuvastatin in rat plasma by HPLC and its application to pharmacokinetic studies. Biomed Chromatogr 2006; 20(9):881-887. [15] Mishra Pradeep, Gupta Alka, Shah Kamal. Spectrophotometric determination of Ezetimibe in pharmaceutical formulations. J Indian Chem Soc 2007; 84(9):945-947. [16] Jain Nilesh, Jain Ruchi, Swami Hemant, Pandey Sharad and Jain DK. [17] Spectrophotometric method for simultaneous estimation of Simavastatin and Ezetimibe in bulk drug and its combined dosage form. Int J Pha & Phar Sci 2009; (1):171-175. [18] Godse VP, Deodhar MN, Bhosle AV, Sonewane RA, Sakpal PS, Borkar DD et al. Simultaneous spectrophotometric estimation of Ezetimibe and Atrovastatin in pharmaceutical dosage form. J Research Chem 2009; 2(1):86- 89. [19] Samir Mohamed El-Mogahazy, Mohamad Abid El-Azem Mohamed, Marwa Fadel Mohamed, Nadia Fayek Yousef. Development and validation of HPLC, TLC and derivative specrophotometric methods for theanalysis of Ezetimibe in the presence of alkaline induced [20] degradation products. J Chinese Chem Soc 2009; 56:360-367. [21] Rajput SJ, Raj HA. Simultaneous estimation of Ezetimibe and Losavastatin by derivative spectroscopy. PharmTech 2009; 1(3):894-899.. www.ijpar.com.
(9) 21 Vadthya Rajashekar et al / Int. J. of Pharmacy and Analytical Research Vol-3(1) 2014 [13-21]. [22] Mahadik MV, Dhaneshwar SR. Application of a stability indicating HPTLC method for the quantitative determination of Ezetimibe in pharmaceutical dosage forms. Asian. J Pharma Sci 2007; 2(5):182-190. [23] Akmar SK, Kothapalli L, Thomas A, Jangam S,Deashpande AD. Reverse phase high performance liquid chromatography method for estimation of Ezetimibe in bulk and pharmaceutical formulations. Ind J Pharm Sci 2007; 69(5):695-697. [24] Dixit PR, Chandrasekhar R, Nagashekar SM. Stability indicating HPLC method for Simultaneous determination of Ezetimibe and Simavastatin. Asian J Pharm Sci 2007; 2(5):182- 190. *******************************. www.ijpar.com.
(10)
Figure
Related documents
Respondents who wanted to see risk information as three disease outcomes over one time horizon per graph argued that they liked everything "all on one sheet", and that
supported, the B value of for previous experience of entrepreneur factor = .716> 0.01, which indicated that there is a positive and significant impact of previous
Good dreams, unlike bad dreams, have different effects on both the dreamer and the hearers.. For one, the dreamer will naturally be
Levels of transcripts involved in the production and activity of trehalose, known as a stress response molecule in fungi (43), are also high in resting spores, but decrease
Conclusions: The findings from this study indicate the importance of “ pushing ” active classroom teachers from the design to the mapping arena by instituting curriculum
In fact, all five strains genotyped as SIT149:A were drug resistant according to the line probe assay (Additional file 1 : Table S1), and four of these five strains were
Methods: We identified all Dutch families in which two or three siblings were diagnosed with Pompe disease and described genotype, acid α -glucosidase activity, age at symptom
To better solve the problems discussed above, in this paper, we construct a KP-ABS-UT (key-policy attribute based signature with untrusted authority and traceabil- ity) scheme,
