R E S E A R C H A R T I C L E
Open Access
Bayesian methods to determine performance
differences and to quantify variability among
centers in multi-center trials: the IHAST trial
Emine O Bayman
1,2*, Kathryn M Chaloner
2,3, Bradley J Hindman
1, Michael M Todd
1and the IHAST Investigators
Abstract
Background:To quantify the variability among centers and to identify centers whose performance are potentially outside of normal variability in the primary outcome and to propose a guideline that they are outliers.
Methods:Novel statistical methodology using a Bayesian hierarchical model is used. Bayesian methods for estimation and outlier detection are applied assuming an additive random center effect on the log odds of response: centers are similar but different (exchangeable). The Intraoperative Hypothermia for Aneurysm Surgery Trial (IHAST) is used as an example. Analyses were adjusted for treatment, age, gender, aneurysm location, World Federation of Neurological Surgeons scale, Fisher score and baseline NIH stroke scale scores. Adjustments for differences in center characteristics were also examined. Graphical and numerical summaries of the between-center standard deviation (sd) and variability, as well as the identification of potential outliers are implemented.
Results:In the IHAST, the center-to-center variation in the log odds of favorable outcome at each center is consistent with a normal distribution with posterior sd of0.538 (95%credible interval:0.397to0.726) after adjusting for the effects of important covariates. Outcome differences among centers show no outlying centers. Four potential outlying centers were identified but did not meet the proposed guideline for declaring them as outlying. Center characteristics (number of subjects enrolled from the center, geographical location, learning over time, nitrous oxide, and temporary clipping use) did not predict outcome, but subject and disease characteristics did.
Conclusions:Bayesian hierarchical methods allow for determination of whether outcomes from a specific center differ from others and whether specific clinical practices predict outcome, even when some centers/subgroups have relatively small sample sizes. In the IHAST no outlying centers were found. The estimated variability between centers was moderately large.
Keywords:Bayesian outlier detection, Between center variability, Center-specific differences, Exchangeable, Multi-center clinical trial, Performance, Subgroups
Background
It is important to determine if treatment effects and/or other outcome differences exist among different partici-pating medical centers in multicenter clinical trials. Establishing that certain centers truly perform better or worse than others may provide insight as to why an experimental therapy or intervention was effective in one center but not in another and/or whether a trial’s
conclusions may have been impacted by these differences. For multi-center clinical trials, identifying centers performing on the extremes may also explain differences in following the study protocol [1]. Quantify-ing the variability between centers provides insight even if it cannot be explained by covariates. In addition, in healthcare management, it is important to identify med-ical centers and/or individual practitioners who have su-perior or inferior outcomes so that their practices can either be emulated or improved.
Determining whether a specific medical center truly performs better than others can be difficult and/or * Correspondence:[email protected]
1
Department of Anesthesia, The University of Iowa, Iowa City, IA, USA 2Department of Biostatistics, The University of Iowa, Iowa City, IA, USA
Full list of author information is available at the end of the article
misleading. Each center enrolls a different patient popula-tion, has different standard of care, the sample size varies between centers and is sometimes small. Spiegelhalter recommended using funnel plots to compare institutional performances [2]. Funnel plots are especially useful when sample sizes are variable among centers. When the out-come is binary, the good outout-come rates can be plotted against sample size as a measure of precision. In addition,
95%and 99.8%exact frequentist confidence intervals are plotted. Centers outside of these confidence bounds are identified as outliers. However, since confidence intervals are very large for small centers, it is almost impossible to detect a center with a small sample size as an outlier or potential outlier using frequentist methods.
Bayesian hierarchical methods can address small sam-ple sizes by combining prior information with the data and making inferences from the combined information. The Bayesian hierarchical model borrows information across centers and thus, accounts appropriately for small sample sizes and leads to different results than the frequentist approach without a hierarchical mixed effects model. A frequentist hierarchical model with components of variance could also be used and also borrows informa-tion; however frequentist point estimates of the variance may have large mean square errors compared to Bayesian estimates [3].
The aim of this study is to demonstrate the application of Bayesian methods to determine if outcome differences exist among centers, and if differences in center-specific clinical practices predict outcomes. The variability among centers is also estimated and interpreted. To do so, we utilized data from the Intraoperative Hypothermia for Aneurysm Surgery Trial (IHAST [4]). Specifically, we determined, using a Bayesian mixed effects model, whether outcome variability among IHAST centers was consistent with a normal distribution and/or whether out-come differences can be explained by characteristics of the centers, the patients, and/or specific clinical practices of the various centers.
Methods
Frequentist IHAST methods
IHAST was a prospective randomized partially blinded multicenter clinical trial (1001 subjects, 30 centers) de-signed to determine whether mild intraoperative systemic hypothermia (33°C), compared to normothermia (36.5°C), resulted in improved neurologic outcome in subjects with an acute subarachnoid hemorrhage (SAH) undergoing sur-gery (open craniotomy) to treat a ruptured intracranial aneurysm [4]. A large number of subject and clinical variables were recorded prior to randomization including age, gender, race, World Federation of Neurological Surgeons (WFNS) class, amount of subarachnoid blood (Fisher score), aneurysm size and location, and pre
SAH-medical conditions. The details and results of the primary study [4], and subsequent secondary analyses have been previously published [5-9]. The primary outcome measure was the modified Glasgow Outcome Score (GOS) determined 3 months after surgery. The GOS is a five-point functional outcome scale which ranges between 1 (good outcome) and 5 (death) [10]. The primary result of IHAST was that intraoperative hypothermia did not affect neurological outcome: 66% (329 / 499) good outcome (GOS= 1) with hypothermia vs.63% (314 / 501)good out-come with normothermia, odds ratio (OR)= 1.15, 95%
confidence interval:0.89to1.49[4].
In IHAST, the randomized treatment assignment (intraoperative hypothermiavs. normothermia) was strati-fied by center such that approximately equal numbers of patients were randomized to hypothermia and normo-thermia at each participating center. The number of patients contributed by each center ranged between3and
93 (median= 27 patients). A conventional funnel plot showing the proportion of patients with good outcomes by center vs. the number of patients contributed by those centers is implemented.
Bayesian methods in general
Bayesian inference interprets probability as a degree of belief, and unknown parameters are random variables with prior probability distributions. For example, in IHAST a prior belief was held that the probability of a good outcome would be around70%and this probability might range from as low as 30% in one center and as high as90%in another. This information is used to con-struct the prior distribution of the between-center vari-ance. Bayesian methods require that careful attention is paid to the choice of prior distribution [11] and a sensi-tivity analysis is recommended [12].
The Bayesian approach combines prior information with the clinical trial data and makes inference from this combined information [11,13]. Accordingly, when new clinical trial data become available, the probability distributions are updated, using Bayes theorem, to give a posterior distribution. In contrast, in the traditional approach, probability is interpreted as a long run frequency, giving rise to the terminology “frequentist” inference.
Bayesian methods applied to the IHAST trial
as “exchangeable” [14,15]. With the exchangeability as-sumption, it is assumeda priorithat good outcome rates for all centers are a sample from the same distribution, and beliefs are invariant to ordering or relabeling of the centers. With the hierarchical model assumption, each center borrows information from the corresponding data of other centers [16]. This is called a shrinkage effect to-wards the population mean and, as will be shown, this can be especially beneficial when there are small sample sizes in some centers.
As in all prior IHAST publications [5-9], a set of 10
standard covariates were used when exploring the im-pact of any variable on outcome: preoperative WFNS score (WFNS = 1 or WFNS >1), age (on the continu-ous scale), gender, Fisher grade on first CT scan, post-SAH National Institute of Health Stroke Scale score (NIHSS), aneurysm location (posterior vs anterior), race, aneurysm size, history of hypertension, and inter-val from SAH to surgery. These were chosen because of either their demonstrated association with outcome in IHAST or because previous studies had shown them to be associated with outcome following SAH. This set of covariates is included as predictor variables as is treatment assignment (hypothermia vs. normothermia).
In the IHAST 1001 patients were enrolled and randomized, with complete data and follow up is avail-able on940subjects. The data set for the940subjects is therefore used here.
Let njk denote the number of subjects assigned to treatment j in center k and Xijk be the values of the covariates for the ith subject in the jth treatment group at the kth center (i = 1,. . .,njk, j = 1,2, k =
1,. . .,30). Let yijk= 1 denote a good outcome (GOS = 1) for ith subject in jth treatment in center k and yijk
= 0 denote GOS >1 for the same subject. Also let
β be the vector of covariates including the intercept μ and coefficients β1 to β11 for treatment assignment and the 10 standard covariates given previously. Conditional on the linear predictor
xT
iβ and the ran-dom center effect δk , yijk are Bernoulli random variables. Denote the probability of a good outcome,
yijk= 1, to be pijk. The random center effects (δk, k =
1,. . .,30) conditional on the value σeare assumed to be a sample from a normal distribution with a mean of zero and sd σe . This assumption makes them ex-changeable:δk|σe~ Normal (0,σ2e).The valueσeis the between-center variability on the log odds scale. The point estimate ofσeis denoted bys. The log odds of a good outcome for subject i assigned to treatmentjin center k
are denoted byθijk= logit(pijk) = log(pijk/(1– pijk))(i = 1,. . .,
njk, j = 1,2, k = 1,. . .,30).
A model with all potential covariates isθijk ¼xT iβþδk and can also be written as follows:
θijk ¼μþβ1treatmentjþβ2WFN Siþβ3agei þβ4genderiþβ5fisheriþβ6strokei þβ7locationiþβ8raceiþβ9sizei þβ10hypertensioniþβ11intervaliþδk
where μis the intercept in the logit scale: β1 to β11 are coefficients to adjust for treatment and 10 standard covariates that are given previously and in Appendix A.1.
Backward model selection is applied to detect import-ant covariates associated with good outcome [17,18]. Covariates are deemed important by checking whether the posterior credible interval of slope term excludes zero. Models are also compared based on their deviance information criteria (DIC) [19]. DIC is a single number describing the consistency of the model to the data. A model with the smaller DIC represents a better fit (see Appendix A.2). Once the important main effects are found, the interaction terms for the important main effects are examined. A model is also fit using all the covariates.
Prior distributions modified from Bayman et al. [20] are used and a sensitivity analysis is performed. Prior distributions for the overall mean and coefficients for the fixed effects are not very informative (see Appendix A.3). The prior distribution of the varianceσe2is inform-ative and is specified as an inverse gamma distribution (see Appendix A.3) using the expectations described earlier. Values of σe close to zero represent greater homogeneity of centers.
The Bayesian analysis calculates the posterior distribu-tion of the between-center standard deviadistribu-tion, diagnostic probabilities for centers corresponding to “potential outliers”, and graphical diagnostic tools. Posterior point estimates and center- specific95% credible intervals (CI) of random center effects (δk) are calculated. A guideline based on interpretation of a Bayes Factor (BF) [14] is proposed for declaring a potential outlier“outlying”. Sen-sitivity to the prior distribution is also examined [19].
Specific bayesian methods to determine outlying centers
The method in Chaloner [21] is used to detect outlying random effects. The method extends a method for a fixed effects linear model [22]. The prior probability of at least one center being an outlier is set to0.05, and be-cause there are 30 centers, this leads to a definition of an outlying center as one where the magnitude of the random center effect,δk, is greater than3.137σein abso-lute value (Appendix A.4). The corresponding prior
Pr(center k is an outlier) = 2 *Φ(−3.137)[22], whereΦ(z)
is the standard normal distribution function.
The posterior probabilities of centerkbeing an outlier:
Pr(center k is an outlier | y)are calculated from the joint posterior distribution ofδkand σe[22]. The Bayes factor is also calculated for each of the 30 centers to quantify and interpret the strength of evidence. TheBFfor center
kis defined as follows:
BFk¼½1
Prðcenter k is an outlier yj ÞPrðcenter k is an outlierÞ
Prðcenter k is an outlier yj Þ½1Prðcenter k is an outlierÞ:
TheBFfor at least one of the30centers being an out-lier is also calculated. The proposed method for interpreting the results is that centers where the poster-ior probability of being an outlier is larger than the prposter-ior probability are “potential outliers”. In addition, if BFk is less than 0.316 then there is “substantial evidence” for centerkbeing outlying [14]. Similarly if theBFfor there being at least one outlying center is less than0.316there is substantial evidence for at least one outlying center.
Bayesian methods regarding other determinants of outcome
In addition to determining if the treatment effect (hypothermia vs. normothermia) differed among any of the
30IHAST centers and to illustrate our approach on differ-ent settings, Bayesian outlier detection methods were ap-plied to determine whether other center-specific subgroups (e.g. number of subjects, geographic location, various clin-ical practices like nitrous oxide use and temporary clip-ping) had an effect on outcome (GOS 1 vs. GOS >1).
To determine if the number of subjects enrolled at a center predicted outcome, IHAST centers were categorized post hocby number of enrolled subjects. Let
nk= n1k+ n2kand classify centers as either very large (nk≥
69 subjects; 3 centers, 248 subjects), large (56≤nk≤68 subjects; 4 centers, 228 subjects), medium (31≤nk≤55 subjects, 7centers, 282subjects)) and small (nk< 31subjects,
16 centers, 242subjects). To determine if geographic loca-tion predicted outcome, IHAST centers were categorized
post hoc as being either North American (US and Canada,
22 centers,637subjects) or non-North American (Europe, Australia, New Zealand,8 centers,363 subjects). To deter-mine if there was evidence of “learning” over the entire course of the study, outcomes of the first50%of subjects en-rolled in the study (all centers) were compared with outcomes from the second 50% of subjects enrolled (all centers). Similarly, within each center, the outcomes of first
50%subjects were compared to the second50%.
There are a number of clinical practices which vary among centers that are hypothesized, but not proven, to affect outcome in patients with aneurysmal subarachnoid hemorrhage, such as electrophysiological monitoring,
electroencephalography or somatosensory evoked po-tentials [23], nitrous oxide use [5], temporary clipping [6], etc. Centers and/or individual practitioners tend to either embrace these practices (high use) or reject them (low use). Accordingly, Bayesian techniques were used to examine the clinical effect of one anesthetic practice (ni-trous oxide use) and one surgical practice (temporary clipping). To determine if the frequency of nitrous oxide use affected outcome, centers were categorized as to their use of nitrous oxide as either low (≤25% of the cases, 13 centers), medium (26% to 74% of cases, 8
centers) or high(≥75% of cases,9 centers). In addition, the effect of the nitrous oxide use was explored at the in-dividual subject level (yes,627subjects; no,373subjects). Finally, the effect of the use of temporary clipping during aneurysm surgery was compared among centers. Centers were categorized as to their frequency of use of tempor-ary clips as low: (≤30% of cases; 6 centers), medium: (30% to 69% of cases; 21 centers) and high: (≥70% or more of case;3centers). The effect of temporary clipping at the individual subject level (yes,441subjects; no, 553
subjects) was also examined.
Plots are obtained by R [24], and Bayesian analyses are performed with the WinBUGS [25] program. Model convergence is checked by Brooks, Gelman, Rubin diag-nostics plots [26], autocorrelations, density and history plots. A sensitivity analysis is performed.
Results
Frequentist analysis
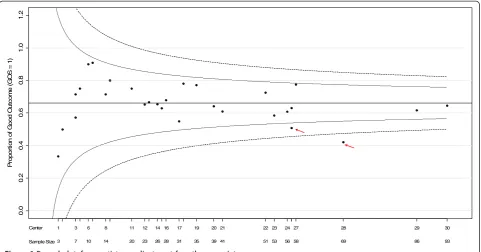
Figure 1 gives the funnel plot [2] for IHAST by center. In this plot, center sizes (nk)are plotted against the pro-portion of good outcome for each center and 95% and
99.8% exact binomial confidence intervals are provided. The horizontal line on the funnel plot represents the overall weighted fixed effect good outcome rate (66%). Centers outside of the 95% and 99.8% confidence bounds are identified as outliers. Accordingly, using this method, IHAST centers26and28would be identified as outliers, performing less well than the rest of the centers, with good outcome rates of 51% and 42%, re-spectively. However, importantly, patient and center characteristics are not taken into account in this plot.
Bayesian analysis
(Appendix A.5). The best model according to DIC adjusts for the main effects of treatment (hypothermia vs. normothermia), WFNS score, gender, Fisher grade on CT scan, pre-operative NIHS stroke scale score, aneurysm location (anterior /posterior), age, center and the interaction of age and pre-operative NIH stroke scale. In this model the log odds of a good outcome for theithsubject assigned thejthtreatment in centerkis:
θijk ¼μþβ1treatmentjþβ2WFN Siþβ3agei þβ4genderiþβ5fisheriþβ6strokei þβ7locationiþβ8ageistrokeiþδk
The model with the posterior means substituted as estimates for the coefficients is:
^
θijk¼2:024þ0:198treatmentjþ0:600WFN Si 0:037agei0:256genderiþ0:777
fisheri0:878strokei0:788 locationiþ0:027ageistrokeiþδk
and δkis the random center effect. The posterior means of the center effects along with 95% CI’s are given in Figure 2.
There is no evidence of an important treatment effect (hypothermia vs. normothermia). Centers have either greater good outcome rates in both hypothermia and normothermia groups, or lower good outcome rate in both treatment groups (data is not shown). The treat-ment effect (hypothermia vs. normothermia) within each center was very small. It should be also noted that, when
all the potential covariates are included in the model, the conclusions are essentially identical.
In Figure 2 centers are sorted in ascending order of numbers of subjects randomized. For example, 3
subjects were enrolled in center 1 and 93subjects were enrolled in center 30. Figure 2 shows the variability be-tween center effects. Consider a 52-year-old (average age) male subject with preoperative WFNS score of 1, no pre-operative neurologic deficit, pre-operative Fisher grade of1and posterior aneurysm. For this subject, pos-terior estimates of probabilities of good outcome in the hypothermia group ranged from0.57 (center28) to 0.84
(center10) across30centers under the best model. The posterior estimate of the between-center sd (σe) is
s = 0.538(95% CI of0.397to0.726) which is moderately large. The horizontal scale in Figure 2 shows± s, ±2 s
and ±3 s. Outliers are defined as center effects larger than 3.137σeand posterior probabilities of being an out-lier for each center are calculated. Any center with a posterior probability of being an outlier larger than the prior probability (0.0017) would be suspect as a potential outlier. Centers 6, 7, 10 and 28 meet this criterion; (0.0020for center6, 0.0029for center7, 0.0053 for cen-ter 10, and 0.0027 for center 28). BF’s for these four centers are 0.854, 0.582, 0.323 and 0.624 respectively. Using the BF guideline proposed (BF<0.316) the hy-pothesis is supported that they are not outliers [14]; all
BF’s are interpreted as“negligible”evidence for outliers. The prior probability that at least one of the30centers is an outlier is 0.05. The joint posterior probability that at least one of the30centers is an outlier is0.019, which
0.
0
0
.2
0.
4
0
.6
0.
8
1.
0
1.
2
P
ropor
ti
on of
G
o
od O
u
tc
om
e (
G
O
S
=
1
)
Center
Sample Size3 7 10 14 20 23 2628 31 35 39 41 51 53 5658 69 86 93
0 3 9 2 8
2 7
2 4 2 3 2 2 2 1
2 0 2 9 1 7 1 6 1 4 1 2 1 1 1 8 6 3 1
is less than the prior probability of0.05. Both individual and joint results therefore lead to the conclusion that the no centers are identified as outliers.
Under the normality assumption, the prior probability of any one center to be an outlier is low and is 0.0017
when there are30centers. In this case, any center with a posterior probability of being an outlier larger than
0.0017would be treated as a potential outlier. It is there-fore possible to identify a center with a low posterior probability as a “potential outlier”. The Bayes Factor (BF) can be used to quantify whether the relative change from the prior probability of being outlier to the poster-ior probability is large enough to categorize a center as an outlier.
The use of Bayesian analysis methods demonstrates that, although there is center to center variability, after adjusting for other covariates in the model, none of the
30 IHAST centers performed differently from the other centers more than is expected under the normal distri-bution. Without adjusting for other covariates, and with-out the exchangeability assumption, the funnel plot indicated two IHAST centers were outliers. When other covariates are taken into account together with the Bayesian hierarchical model those two centers were not,
in fact, identified as outliers. The less favorable outcomes in those two centers were because of differences in patient characteristics (sicker and/or older patients).
Subgroup analysis
When treatment (hypothermia vs. normothermia), WFNS, age, gender, operative Fisher score, pre-operative NIH stroke scale score, aneurysm location and the interaction of age and pre-operative NIH stroke scale score are in the model and similar analyses for outcome (GOS1 vs. GOS > 1) are performed for four different cat-egories of center size (very large, large, medium, and small) there is no difference among centers—indicating that patient outcomes from centers that enrolled greater numbers of patients were not different than outcomes from centers that enrolled the fewer patients. Our ana-lysis also shows no evidence of a practice or learning effect—the outcomes of the first50%of patients did not differ from the outcomes of the second 50%of patients, either in the trial as a whole or in individual centers. Likewise, an analysis of geography (North American vs. Non-North American centers) showed that outcomes were homogeneous in both locations. The analysis of
Po
s
te
ri
o
r
_ _
_
_ _
_ _
_
_ _
_
_
_ _ _
_
_
_ _
_
_ _
_
_ _
_ _
_ _
_ _
_ _
_ _
_ _
_ _
_
_
_
_ _ _
_
_
_ _
_
_ _
_
_ _
_ _
_ _
_
-3
s
-2
s
-s
0
s
2
s
3
s
Center
Sample Size
1 2 3 4 5 6 7 8 9 10 11 12 13 14 15 16 17 18 19 20 21 22 23 24 25 26 27 28 29 30
3 4 7 7 8 10 11 14 15 15 20 23 24 26 27 28 31 32 35 39 41 51 53 56 57 57 58 69 86 93
outcomes among centers as a function of nitrous oxide use (low, medium or high user centers, and on the pa-tient level) and temporary clip use (low, medium, or high user centers and on the patient level) also found that differences were consistent with a normal variability among those strata. This analysis indicates that, overall, differences among centers—either in their size, geography, and their specific clinical practices (e.g. nitrous oxide use, temporary clip use) did not affect patient outcome.
Sensitivity analysis
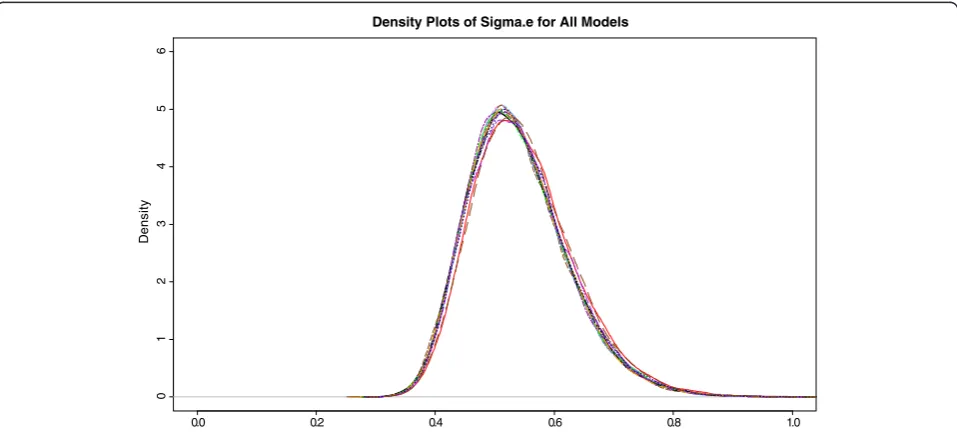
As a sensitivity analysis, Figure 3 shows the posterior density plots of between-center standard deviation, σe, for each of15models fit. For the first four models, when non important main effects of race, history of hyperten-sion, aneurysm size and interval from SAH to surgery are in the model,s is around0.55. The point estimate s
is consistently around 0.54 for the best main effects model and the models including the interaction terms of the important main effects. In conclusion, the variability between centers does not depend much on the covariates that are included in the models.
When other subgroups (center size, order of enroll-ment, geographical location, nitrous oxide use and tem-porary clip use) were examined the estimates of between subgroup variability were similarly robust in the corresponding sensitivity analysis.
In summary, the observed variability among centers in IHAST has a moderately large standard deviation (σe=
0.538, 95% credible interval for σe 0.397 to 0.726). No center was declared an outlier and no center-specific or
other subgroups were associated with outcome. Sensitiv-ity analyses give similar results.
Discussion
Although IHAST centers differed in geographic location, experience, and in clinical practices, none of these differences were associated with important differences in outcome. This suggests that although there is moder-ately large variability among centers, center-specific variations in patient management (specifically, nitrous oxide use or temporary clipping) did not greatly affect outcome. If variations in patient management affected outcome, it would be expected that centers with higher enrollment would, as a result of learning, have better outcomes. However, they did not. Likewise, if clinical practices affected outcome, one would expect that outcomes would improve over time as a result of learning. However, our results showed that learning (first
50%vs last 50%of subjects to enroll) did not occur and the magnitude of enrollment did not impact outcome. Outcome was however determined in part by patient characteristics such as WFNS, age, pre-operative Fisher score, pre-operative NIHSS stroke scale score, and aneurysm location. Although centers differ in their size, location, and clinical practices, the disease and/or pa-tient characteristics predict papa-tient outcome in this condition.
The greatest advantage of Bayesian techniques over non-hierarchical frequentist methods is its ability to ad-dress small sample sizes in some centers. When the stratum-specific sample sizes are small, the hierarchical Bayesian method is especially helpful because
0 . 1 8
. 0 6
. 0 4
. 0 2
. 0 0
. 0
01
23
4
5
6
Density Plots of Sigma.e for All Models
De
n
s
it
y
information for all centers is averaged with information for a particular center, and weight put on the center spe-cific data proportional to the sample size in the center. Consequently, centers with fewer subjects have less weight put on their center-specific data than do centers with more subjects. Infinite estimates and unbounded confidence intervals arise using only data from subjects in each center to and a frequentist fixed effects model estimate center specific effects, but are avoided using the Bayesian hierarchical model. For example, center 1
enrolled only three subjects: two in the hypothermia group and one in the normothermia group. In the hypothermia group, both patients had an unfavorable outcome, and in the normothermia group the single pa-tient had a good outcome. In this case, the frequentist estimate of the log odds of good outcome for center 1
using only the data from center1 is infinite and has ir-regular properties. An alternative practice to avoid infin-ite estimates is to combine small centers, or to exclude centers with all good outcomes or unfavorable from the analysis [27]. This approach detracts from most preplanned statistical analyses and may reduce the effective sample size. For an intention-to-treat analysis it is essential to include all centers. With the Bayesian approach, and an exchangeability assumption, center estimates are averaged with the overall mean estimate ignoring centers [19]. Extreme center results are there-fore systematically adjusted towards the overall average results. As can be seen from Figure 2, the Bayesian esti-mate of the posterior log odds of good outcome for cen-ter 1 uses information from all other centers and has a much narrow range than the frequentist confidence interval. Even if100%good outcome rate is observed in center 1, this center is not identified as an outlier center because of the small sample size in this center (n = 3). This center does not stand alone and the center-specific estimate borrowed strength from other centers and shifted towards the overall mean.
In the IHAST, two centers (n26= 57, n28= 69) were identified as outliers by the funnel plot but with the Bayesian approach leading to shrinkage, and also adjust-ment for covariates they were not declared as outliers. Funnel plots do not adjust for patient characteristics. After adjusting for important covariates and fitting ran-dom effect hierarchical Bayesian model no outlying centers were identified.
With the Bayesian approach, small centers are dominated by the overall mean and shrunk towards the overall mean and they are harder to detect as outliers than centers with larger sample sizes. A frequentist mixed model could also potentially be used for a hier-archical model. Bayman et al. [20] shows by simulation that in many cases the Bayesian random effects models with the proposed guideline based on BFand posterior
probabilities typically has better power to detect outliers than the usual frequentist methods with random effects model but at the expense of the type I error rate.
Prior expectations for variability between centers existed. Not very informative prior distributions for the overall mean, and covariate parameters with an inform-ative distribution onσeare used.
The approach proposed in this study is applicable to multiple centers, as well as to any other stratification (group or subgroup) to examine whether outcomes in strata are different. Anesthesia studies are generally conducted in a center with multiple anesthesia providers and with only a few subjects per provider. The approach proposed here can also be used to compare the good outcome rates of anesthesia providers when the outcome is binary (good vs. poor, etc.). This small sample size issue increases the advantage of using Bayesian methods instead of traditional frequentist methods. An additional application of this Bayesian method is to perform a meta-analysis, where the stratification is by study [28].
Conclusion
The proposed Bayesian outlier detection method in the mixed effects model adjusts appropriately for sample size in each center and other important covariates. Although there were differences among IHAST centers, these differences are consistent with the random variability of a normal distribution with a moderately large standard dation and no outliers were identified. In addition, no evi-dence was found for any known center characteristic to explain the variability. This methodology could prove use-ful for other between-centers or between-individuals comparisons, either for the assessment of clinical trials or as a component of comparative-effectiveness research.
Appendix A: Statistical appendix A.1. List of potential covariates
The potential covariates and their definitions are: treatment (hypothermia vs normothermia), preoperative WFNS score(1vs>1), age, gender, race (white vs others), Fisher grade on CT scan (1 vs others), pre-operative NIH stroke scale score (0 vs others), aneurysm location (posterior vs anterior), aneurysm size (largest diameter of first aneurysm≥25 vs <25), history of hypertension (yes vs no) and interval from SAH to surgery (0to7days vs8to14days).
A.2. Deviance Information Criterion (DIC)
The model with a smaller DIC value is preferred to the model with a larger DIC.
A.3. Justification and Description of Prior Distributions
Prior distributions for the overall mean (μ), main effects of treatment, coefficient corresponding to pre-operative WFNS score, gender, race, Fisher grade on CT scan, pre-operative NIH stroke scale score, aneurysm lo-cation, aneurysm size, history of hypertension and inter-val from SAH to surgery are assumed to be a normal distribution with mean zero and standard deviation 10. This distribution is not very informative. Because age is measured in years, and has a wider scale, the prior distribution for the regression coefficient of age at randomization is a normal distribution centered zero with standard deviation 1. Similarly, the prior distribu-tion for the coefficient corresponding to interacdistribu-tion of age by any other covariate is normally distributed with mean zero and a standard deviation of1.
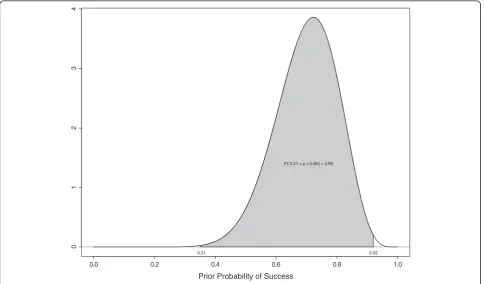
As explained in the Bayesian Methods Applied to the IHAST Trial section, the prior distribution for the between-center variance (σe2) is assumed to be an inverse gamma distribution with mean0.667and standard devi-ation 0.471. For this Inverse Gamma distribution, the prior probability is 95% that any center’s log odds of a good outcome lies between 31% and 92%. This prior probability distribution is illustrated in Figure 4.
A.4. Calculating the Prior Probability of Being an Outlier
An outlier can be defined based on specifying the prior probability of not having any outliers as very high, say
95%. Then the prior probability of a specific center k
being an outlier when there are n centers is 2Φ(−m)
where m =Φ-1[0.5 + ½ * (0.951/n)] [22]. For example, when comparing 30 centers, n = 30 and m is 3.137and the prior probability of being outlier for a specific center is0.0017.
A.5. Treatment and Gender as Covariates in the Final Model
In the model selection process using the DIC criter-ion, treatment effect is not an important covariate. However, given that in IHAST subjects are random-ized to treatment, hypothermia or normothermia, this covariate is included in the final model. Similarly, according to DIC criterion gender is not an important covariate, however as the interaction between gen-der and treatment effect is deemed important it is in-cluded.
A.6. Appendix
The members of IHAST were as follows: University
of Iowa—Steering Committee:M. Todd, B. Hindman,
W. Clarke, K. Chaloner, J. Torner, P. Davis, M. Howard, D. Tranel, S. Anderson; Clinical Coordinating Center:
0.0 0.2 0.4 0.6 0.8 1.0
012
3
4
Prior Probability of Success
0.92 0.31
P( 0.31 < p < 0.92) = 0.95
M. Todd, B. Hindman, J. Weeks, L. Moss, J. Winn;Data
Management Center: W. Clarke, K. Chaloner, M.
Wichman, R. Peters, M. Hansen, D. Anderson, J. Lang, B. Yoo; Physician Safety Monitor: H. Adams; Project
Advisory Committee—G. Clifton (University of Texas,
Houston), A. Gelb (University of California, San Francisco), C. Loftus (Temple University, Philadelphia), A. Schubert (Cleveland Clinic, Cleveland); Physician
Protocol Monitor— D. Warner (Duke University,
Dur-ham, N.C.); Data and Safety Monitoring Board — W. Young, chair (University of California, San Francisco), R. Frankowski (University of Texas Health Science Center at Houston School of Public Health, Houston), K. Kieburtz (University of Rochester School of Medicine and Dentistry, Rochester, N.Y.), D. Prough, University of Texas Medical Branch, Galveston), L. Sternau (Mt. Sinai Medical Center, Miami); NIH, National Institute of
Neurological Disease and Stroke, Bethesda, Md.— J.
Marler, C. Moy, B. Radziszewska;Participating Centers (the number of randomized patients at each center is
listed in parentheses): Addenbrooke’s Hospital,
Cam-bridge, United Kingdom (93): B. Matta, P. Kirkpatrick,
D. Chatfield, C. Skilbeck, R. Kirollos, F. Rasulo, K. Eng-lish, C. Duffy, K. Pedersen, N. Scurrah, R. Burnstein, A. Prabhu, C. Salmond, A. Blackwell, J. Birrell, S. Jackson; University of Virginia Health System, Charlottesville
(86): N. Kassell, T. Pajewski, H. Fraley, A. Morris, T.
Alden, M. Shaffrey, D. Bogdonoff, M. Durieux, Z. Zuo, K. Littlewood, E. Nemergut, R. Bedford, D. Stone, P. Balestrieri, J. Mason, G. Henry, P. Ting, J. Shafer, T. Blount, L. Kim, A. James, E. Farace, L. Clark, M. Irons, T. Sasaki, K. Webb; Auckland City Hospital,
Auck-land, New Zealand (69):T. Short, E. Mee, J. Ormrod, J.
Jane, T. Alden, P. Heppner, S. Olson, D. Ellegala, C. Lind, J. Sheehan, M. Woodfield, A. Law, M. Harrison, P. Davies, D. Campbell, N. Robertson, R. Fry, D. Sage, S. Laurent, C. Bradfield, K. Pedersen, K. Smith, Y. Young, C. Chambers, B. Hodkinson, J. Biddulph, L. Jensen, J. Ogden, Z. Thayer, F. Lee, S. Crump, J. Quaedackers, A. Wray, V. Roelfsema; Sozialmedizinisches Zentrum
Ost–Donauspital, Vienna (58): R. Greif, G. Kleinpeter,
C. Lothaller, E. Knosp, W. Pfisterer, R. Schatzer, C. Salem, W. Kutalek, E. Tuerkkan, L. Koller, T. Weber, A. Buchmann, C. Merhaut, M. Graf, B. Rapf; Harborview
Medical Center, Seattle (58): A. Lam, D. Newell, P.
Tanzi, L. Lee, K. Domino, M. Vavilala, J. Bramhall, M. Souter, G. Britz, H. Winn, H. Bybee; St. Vincent’s
Pub-lic Hospital, Melbourne, Australia (57): T. Costello,
M. Murphy, K. Harris, C. Thien, D. Nye, T. Han, P. Mc-Neill, B. O'Brien, J. Cormack, A. Wyss, R. Grauer, R. Popovic, S. Jones, R. Deam, G. Heard, R. Watson, L. Evered, F. Bardenhagen, C. Meade, J. Haartsen, J. Kruger, M. Wilson;Universityof Iowa Health Care, Iowa City
(56): M. Maktabi, V. Traynelis, A. McAllister, P.
Leonard, B. Hindman, J. Brian, F. Mensink, R. From, D. Papworth, P. Schmid, D. Dehring, M. Howard, P. Hitchon, J. VanGilder, J. Weeks, L. Moss, K. Manzel, S. Anderson, R. Tack, D. Taggard, P. Lennarson, M. Menhusen; University of Western Ontario, London,
Ont., Canada (53): A. Gelb, S. Lownie, R. Craen, T.
Novick, G. Ferguson, N. Duggal, J. Findlay, W. Ng, D. Cowie, N. Badner, I. Herrick, H. Smith, G. Heard, R. Peterson, J. Howell, L. Lindsey, L. Carriere, M. von Lewinski, B. Schaefer, D. Bisnaire, P. Doyle-Pettypiece, M. McTaggart;Keck School of Medicine at University
of Southern California, Los Angeles (51):S. Giannotta,
V. Zelman, E. Thomson, E. Babayan, C. McCleary, D. Fishback; University of Michigan Medical Center,
Ann Arbor (41):S. Samra, B. Thompson, W. Chandler,
J. Mcgillicuddy, K. Tremper, C. Turner, P. Smythe, E. Dy, S. Pai, V. Portman, J. Palmisano, D. Auer, M. Quigley, B. Giordani, A. Freymuth, P. Scott, R. Silbergleit, S. Hickenbottom; University of California
San Francisco, San Francisco (39): L. Litt, M. Lawton,
L. Hannegan, D. Gupta, P. Bickler, B. Dodson, P. Talke, I. Rampil, B. Chen, P. Wright, J. Mitchell, S. Ryan, J. Walker, N. Quinnine, C. Applebury; Alfred Hospital,
Melbourne, Australia (35): P. Myles, J. Rosenfeld, J.
Hunt, S. Wallace, P. D’Urso, C. Thien, J. McMahon, S. Wadanamby, K. Siu, G. Malham, J. Laidlaw, S. Salerno, S. Alatakis, H. Madder, S. Cairo, A. Konstantatos, J. Smart, D. Lindholm, D. Bain, H. Machlin, J. Moloney, M. Buckland, A. Silvers, G. Downey, A. Molnar, M. Langley, D. McIlroy, D. Daly, P. Bennett, L. Forlano, R. Testa, W. Burnett, F. Johnson, M. Angliss, H. Fletcher; Toronto Western Hospital, University Health
Net-work, Toronto (32): P. Manninen, M. Wallace, K.
Lukitto, M. Tymianski, P. Porter, F. Gentili, H. El-Beheiry, M. Mosa, P. Mak, M. Balki, S. Shaikh, R. Saw-yer, K. Quader, R. Chelliah, P. Berklayd, N. Merah, G. Ghazali, M. McAndrews, J. Ridgley, O. Odukoya, S. Yantha; Wake Forest University Baptist Medical
Cen-ter, Winston-Salem, N.C. (31): J. Wilson, P. Petrozza,
C. Miller, K. O’Brien, C. Tong, M. Olympio, J. Reynolds, D. Colonna, S. Glazier, S. Nobles, D. Hill, H. Hulbert, W. Jenkins;Mayo Clinic College of Medicine,
Roches-ter, Minn. (28): W. Lanier, D. Piepgras, R. Wilson, F.
Meyer, J. Atkinson, M. Link, M. Weglinski, K. Berge, D. McGregor, M. Trenerry, G. Smith, J. Walkes, M. Felmlee-Devine; West fälische Wilhelms-Universitat
Muenster, Muenster, Germany (27): H. Van Aken, C.
Greiner, H. Freise, H. Brors, K. Hahnenkamp, N. Monteiro de Oliveira, C. Schul, D. Moskopp, J. Woelfer, C. Hoenemann, H. Gramke, H. Bone, I. Gibmeier, S. Wirtz, H. Lohmann, J. Freyhoff, B. Bauer; University of
Wisconsin Clinical Science Center, Madison (26): K.
Broderick, K. Willmann, L. Connery, J. Kish, C. Weasler, N. Page, B. Hermann, J. Jones, D. Dulli, H. Stanko, M. Geraghty, R. Elbe; Montreal Neurological Hospital,
Montreal (24): F. Salevsky, R. Leblanc, N. Lapointe, H.
Macgregor, D. Sinclair, D. Sirhan, M. Maleki, M. Abou-Madi, D. Chartrand, M. Angle, D. Milovan, Y. Painchaud;Johns Hopkins Medical Institutions,
Balti-more (23): M. Mirski, R. Tamargo, S. Rice, A. Olivi, D.
Kim, D. Rigamonti, N. Naff, M. Hemstreet, L. Berkow, P. Chery, J. Ulatowski, L. Moore, T. Cunningham, N. McBee, T. Hartman, J. Heidler, A. Hillis, E. Tuffiash, C. Chase, A. Kane, D. Greene-Chandos, M. Torbey, W. Ziai, K. Lane, A. Bhardwaj, N. Subhas;Cleveland Clinic
Foundation, Cleveland (20): A. Schubert, M. Mayberg,
M. Beven, P. Rasmussen, H. Woo, S. Bhatia, Z. Ebrahim, M. Lotto, F. Vasarhelyi, J. Munis, K. Graves, J. Woletz, G. Chelune, S. Samples, J. Evans, D. Blair, A. Abou-Chebl, F. Shutway, D. Manke, C. Beven;New York
Pres-byterian Hospital–Weill Medical College of Cornell
University, New York (15): P. Fogarty-Mack, P. Stieg,
R. Eliazo, P. Li, H. Riina, C. Lien, L. Ravdin, J. Wang, Y.
Kuo; Stanford University Medical Center, Palo Alto,
Calif. (15): R. Jaffe, G. Steinberg, D. Luu, S. Chang, R. Giffard, H. Lemmens, R. Morgan, A. Mathur, M. Angst, A. Meyer, H. Yi, P. Karzmark, T. Bell-Stephens, M. Marcellus; Plymouth Hospitals National Health
Ser-vice Trust, Plymouth, United Kingdom (14): J. Sneyd,
L. Pobereskin, S. Salsbury, P. Whitfield, R. Sawyer, A. Dashfield, R. Struthers, P. Davies, A. Rushton, V. Petty, S. Harding, E. Richardson; University of Pittsburgh
Medical Center, Pittsburgh (11): H. Yonas, F. Gyulai,
L. Kirby, A. Kassam, N. Bircher, L. Meng, J. Krugh, G. Seever, R. Hendrickson, J. Gebel; Austin Health, Mel-bourne, Australia (10):D. Cowie, G. Fabinyi, S. Poustie, G. Davis, A. Drnda, D. Chandrasekara, J. Sturm, T. Phan, A. Shelton, M. Clausen, S. Micallef; Methodist
Univer-sity Hospital, Memphis, Tenn. (8): A. Sills, F.
Steinman, P. Sutton, J. Sanders, D. Van Alstine, D. Leggett, E. Cunningham, W. Hamm, B. Frankel, J. Sorenson, L. Atkins, A. Redmond, S. Dalrymple;
Univer-sity of Alabama at Birmingham, Birmingham (7): S.
Black, W. Fisher, C. Hall, D. Wilhite, T. Moore II, P. Blanton, Z. Sha; University of Texas Houston Health
Science Center, Houston (7): P. Szmuk, D. Kim, A.
Ashtari, C. Hagberg, M. Matuszczak, A. Shahen, O. Moise, D. Novy, R. Govindaraj;University of Colorado
Health Science Center, Denver (4): L. Jameson, R.
Breeze, I. Awad, R. Mattison, T. Anderson, L. Salvia, M. Mosier; University of Oklahoma Health Science Cen-ter, Oklahoma City (3):C. Loftus, J. Smith, W. Lilley, B. White, M. Lenaerts.
Competing interests
The authors declare that they have no competing interests.
Authors’contributions
EOB Conception and design, analysis and interpretation of data, drafting the article and revising it critically for important intellectual content. KMC Conception and design, interpretation of data, revising the article critically for important intellectual content and final approval of the version to be published. BJH Revising the article critically for important intellectual content and final approval of the version to be published. MMT Principal Investigator of the IHAST trial, intellectual contributor to the development and evolution of the article, and actively involved in reviewing/revising the article for content as well as providing final approval for the version to be published. All authors have read and approved the final manuscript.
Acknowledgement
The authors thank Julie B. Weeks, MPT, Department of Anesthesia, University of Iowa for her assistance with data organization. We thank the reviewers and the editor for helpful comments that improved this paper considerably.
Funding
IHAST is supported by a grant from the National Institute of Neurological Disease and Stroke (R01 NS38554). Clinical trial registration number: NCT00029133. MMT and BJH are principal investigator and co-investigator of the IHAST trial, EOB worked as a biostatistician for the secondary analysis of the IHAST trial.
Author details 1
Department of Anesthesia, The University of Iowa, Iowa City, IA, USA. 2Department of Biostatistics, The University of Iowa, Iowa City, IA, USA. 3
Department of Statistics & Actuarial Sciences, The University of Iowa, Iowa City, IA, USA.
Received: 4 April 2012 Accepted: 11 January 2013 Published: 16 January 2013
References
1. Canner PL, Huang YB, Meinert CL:On the detection of outlier clinics in medical and surgical trials: I. practical considerations.Control Clin Trials 1981,2:231–240.
2. Spiegelhalter DJ:Funnel plots for comparing institutional performance.
Stat Med2005,24(8):1185–1202.
3. Chaloner KA:Bayesian approach to the estimation of variance components for the unbalanced one-way random model.Technometrics 1987,29(3):323–337.
4. Todd MM, Hindman BJ, Clarke WR, Torner JC:Mild intraoperative hypothermia during surgery for intracranial aneurysm.N Engl J Med2005,352:135–145. 5. McGregor DG, Lanier WL, Pasternak JJ, Rusy DA, Hogan K, Samra S,
Hindman BJ, Todd MM:Effect of nitrous oxide on neurological and neuropsychological function following intracranial aneurysm surgery.
Anesthesiology2008,108:568–579.
6. Hindman BJ, Bayman EO, Pfisterer WK, Torner JC, Todd MM:No association between intraoperative hypothermia or supplemental protective drug and neurologic outcomes in patients undergoing temporary clipping during cerebral aneurysm surgery: findings from the Intraoperative Hypothermia for Aneurysm Surgery Trial.Anesthesiology2010,112:86–101. 7. Coghlan LA, Hindman BJ, Bayman EO, Banki NM, Gelb AW, Todd MM, Zaroff
JG:Independent associations between electrocardiographic
abnormalities and outcomes in patients with aneurysmal subarachnoid hemorrhage. Findings from the intraoperative hypothermia aneurysm surgery trial.Stroke2009,40:412–418.
8. Todd MM, Hindman BJ, Clarke WR, Torner JC, Weeks JB, Bayman EO, Shi Q, Spofford CM:Perioperative fever and outcome in surgical patients with aneurysmal subarachnoid hemorrhage.Neurosurgery2009,64:897–908. 9. Nguyen HP, Zaroff JG, Bayman EO, Gelb AW, Todd MM, Hindman BJ:
Perioperative hypothermia (33 degrees C) does not increase the occurrence of cardiovascular events in patients undergoing cerebral aneurysm surgery: findings from the Intraoperative Hypothermia for Aneurysm Surgery Trial.Anesthesiology2010,113:327–342.
11. Berry DA:Clinical trials: Is the Bayesian approach ready for prime time? Yes!Stroke2005,36:1621–1622.
12. Howard G, Coffey CS, Cutter GR:Is Bayesian analysis ready for use in phase III randomized clinical trials? Beware the sound of sirens.Stroke 2005,36:1622–1623.
13. U.S. Department of Health and Human Services and Food and Drug Administration Center for Devices and Radiological Health. USA:Guidance for the use of Bayesian statistics in medical device clinical trials.February 5, 2010. Available from: http://www.fda.gov/downloads/MedicalDevices/ DeviceRegulationandGuidance/GuidanceDocuments/ucm071121.pdf Accessed on October 1 2012.
14. Spiegelhalter DJ, Abrams KR, Myles JP:Bayesian approaches to clinical trials and health-care evaluation.England: John Wiley & Sons; 2004.
15. Fedorov V, Jones B:The design of multicenter trials.Stat Methods Med Res 2005,14:205–248.
16. Ntzoufras I:Bayesian Modeling Using WinBUGS.Hoboken, NJ: John Wiley & Sons; 2009.
17. Tibshirani R:Regression shrinkage and selection via the lasso.J R Stat Soc 1996,58(1):267–288.
18. Spiegelhalter D, Best N, Carlin B, van der Linde A:Bayesian measures of model complexity and fit (with discussion).J R Statistics Soc Ser B2002,
64:583–639.
19. Gelman A, Carlin JB, Stern HS, Rubin DB:Bayesian data analysis.2nd edition. Boca Raton: Chapman & Hall/CRC; 2004.
20. Bayman EO, Chaloner K, Cowles MK:Detecting qualitative interaction: A Bayesian approach.Stat Med2010,29:455–463.
21. Chaloner K:Residual analysis and outliers in Bayesian hierarchical models.InAspects of Uncertainty A Tribute to D. V. Lindley.Edited by Freeman PR, Smith AFM. John Wiley and Sons; 1994:149–157. 22. Chaloner K, Brant R:A Bayesian approach to outlier detection and
residual analysis.Biometrika1988,75:651–659.
23. Wicks RT, Pradilla G, Raza SM, Hadelsberg U, Coon AL, Huang J, Tamargo RJ:
Impact of changes in intraoperative somato-sensory evoked potentials (SSEPs) on stroke rates after clipping of intracranial aneurysms.
Neurosurgery2012,70(5):1114–1124.
24. R Development Core Team:R: A language and environment for statistical computing, R Foundation for statistical computing.Vienna, Austria: The R Foundation for Statistical Computing; 2010. ISBN 3-900051-07-0. Available from: http://www.R-project.org. Accessed on October 1 2012.
25. Lunn DJ, Thomas A, Best N, Spiegelhalter D:WinBUGS-A Bayesian modeling framework: concepts, structure and extensibility.Stat Comput 2000,10:325–337.
26. Brooks SP, Gelman A:General methods for monitoring convergence of iterative simulations.J Comput Graph Stat1998,7:434–455.
27. Agresti A, Hartzel J:Strategies for comparing treatments on a binary response with multi-centre data.Stat Med2000,19:1115–1139. 28. Dippel D, Vermeulen M, Braakman R, Habbema JD:Transient ischemic
attacks, carotid stenosis, and an incidental intracranial aneurysm. A decision analysis.Neurosurgery1994,34:449–458.
doi:10.1186/1471-2288-13-5
Cite this article as:Baymanet al.:Bayesian methods to determine performance differences and to quantify variability among centers in multi-center trials: the IHAST trial.BMC Medical Research Methodology
201313:5.
Submit your next manuscript to BioMed Central and take full advantage of:
• Convenient online submission
• Thorough peer review
• No space constraints or color figure charges
• Immediate publication on acceptance
• Inclusion in PubMed, CAS, Scopus and Google Scholar
• Research which is freely available for redistribution