_____________________________________________________________________________________________________ *Corresponding author: E-mail: [email protected];
Technology
2(1): 1-7, 2017; Article no.AJB2T.36044
ISSN: 2457-0125
A SNP Genetic Linkage Map Based on F2 Population
Genotyping in Soybean,
Glycine max
(L.) Merrill
O. F. Adewusi
1*, A. C. Odiyi
1and B. O. Akinyele
1 1Department of Crop, Soil and Pest Management, Federal University of Technology, Akure,Ondo State, Nigeria.
Authors’ contributions
This work was carried out in collaboration between all authors. Author OFA designed the study, performed the statistical analysis, wrote the protocol, and wrote the first draft of the manuscript. Author OFA managed the analyses of the study. Authors OFA, ACO and BOA managed the literature searches. All authors read and approved the final manuscript.
Article Information
DOI: 10.9734/AJB2T/2017/36044 Editor(s): (1) Suntud Sirianuntapiboon, Department of Environmental Technology, School of Energy Environment and Materials, King Mongkut’s University of Technology Thonburi, Thung-kru, Thailand Reviewers: (1) Martín Maria Silva Rossi, Argentina. (2) Ernestina Valadez Moctezuma, Universidad Autonoma Chapingo, Mexico. (3) Ilham Zahir, Sultan Moulay Slimane University, Morocco. (4) Vera M. Popović, Institute of Field and Vegetable Crops, Serbia. Complete Peer review History: http://prh.sdiarticle3.com/review-history/21747
Received 10thAugust 2017 Accepted 12thSeptember 2017 Published 4thNovember 2017
ABSTRACT
This study reports a low density genetic linkage map based on 7 x 7 F2 population of soybean, Glycine max(L.) Merrill and constructed with single nucleotide polymorphism (SNP) markers. 50 SNP markers were used to screen the DNA samples of the soybean out of which only 32 were polymorphic with the samples. These 32 SNP markers were mapped using the Mapchart of WINQTL CART. Vsn 2.5 and the SNPs were distributed on 13 LGs (linkage groups) among the 20 chromosomes of the soybean genome. The total map length was just 2211.46cM with an average marker density of 905.86cM. This SNP based genetic linkage map of soybean could be used to map quantitative trait loci (QTL) for important agronomic characters in soybean.
1. INTRODUCTION
Soybean has 20 pairs of chromosomes (2n= 40) and 20 linkage groups (LGs) assigned to them [1]. To cover the whole soybean genome for the purpose of genome-wide analysis, a large number of molecular markers are imperative [2,3]. Molecular markers have been extensively used for the identification and authentication of plant taxonomy and these markers are not influenced by age, physiological condition of sample and environmental factors [4,5]. The efficiency of DNA based marker in discriminating closely related varieties and even individuals of same species is very high. They have proved their utility in various fields such as genetic diversity, genomic fingerprinting and mapping, population genetics, taxonomic studies and plant breeding programs [6,7].
The application of molecular genetic mapping technique has allowed development of a detailed soybean genetic map in short time [8]. In the early 1990’s, studies were conducted to identify molecular markers associated with quantitative trait loci. Several soybean genetic maps which have been published already include hundreds of DNA-based markers [9]. Markers from these maps have been used for the identification of QTLs for agronomically important traits including disease resistance [10]. Genetic linkage maps are important genomic tools for identifying quantitative trait loci (QTL) and candidate genes to enhance marker-assisted selection (MAS) in crop improvement programs [11]. In the past few years, SNP markers have been widely used for assembling linkage maps due to having much variation or diversity [12,13]. Soybean scientists have constructed genetic linkage maps by using molecular markers such as restriction fragment
length polymorphisms (RFLPs), random
amplified polymorphic DNA (RAPD), amplified fragment length polymorphism (AFLP), simple sequence repeats (SSRs) and single nucleotide polymorphisms (SNPs). The first soybean genetic linkage map was constructed by [14] using RFLP markers. The soybean genetic linkage maps developed with RFLPs, AFLPs, RAPDs, and SSRs were expanded to include SNP markers in a soybean transcript map constructed by [15], who were the first to report a soybean genetic linkage map using SNP markers. SNPs are now projected to become the most useful of genetic markers, especially for the construction of dense maps [16,17]. High-throughput SNP genotyping is widely used in
association [18,19,20], comparative genomics [21] and genetic linkage maps construction [22]. Furthermore, millions of SNPs have been generated in Soybean [23], Arabidopsis [24], Rice [25] and other crops [26,27] in order to enhance studies on marker assisted breeding or selection. The objective of this study was to construct a SNP- based genetic linkage map that could be used for quantitative trait locus (QTL) detection of desired agronomic character.
2. MATERIALS AND METHODS 2.1 Plant Materials
In this study, 63 F2population derived from a 7 x 7 diallel cross of soybean was used. Seeds of 7 soybean genotypes were obtained from the soybean germplasm collection of International Institute of Tropical Agriculture (IITA), Ibadan Oyo State, Nigeria. The F1s were generated in 2014 and advanced to F2 generation in 2015. Three plants from each of the 21 crosses were used for the analysis. Two seeds of each of the F2s were sown in pots filled with top soil and at two weeks after planting, the young leaves were collected from the seedlings and DNA was extracted using Cetyl Trimethyl Ammonium Bromide (CTAB) protocol of [28].
2.2 SNP Genotyping and Genetic Map Assembling
The SNP genotyping was performed at the Inqaba Biotechnical Laboratory in South Africa on the mass array system using the IPLEX reagents. The assay procedure encompasses DNA amplification, extension reaction, staining and imaging following the procedure of [29,30, 31]. The SNP map is constructed using the Mapchart program of the WINQTL CART. Vsn. 2.5 [32].
3. RESULTS AND DISCUSSION
groups were numbered 1 to 19 based on the assigned chromosome number of soybean (1). The basic information on the linkage groups is presented in Table 1.
The current map spanned 2211.46cM with an average marker density of 905.86cM (Table 1). The genetic length of the linkage groups (LGs) ranged from 3.08 cM (chr 6/LGC2) to 697.93 cM (chr 8/LGA2). The most covered marker linkage group was chromosome 8 (linkage group A2) that had 11 SNPs with an average marker density of 63.45cM. In contrast, linkage groups D1a, N, C2, M, B1, B2, E, D2, G and L each had the least number of SNP marker of 1.
Fig. 1 shows the SNP based soybean genetic linkage map. The SNP markers and their distances in cM are shown on the chromosomes. The chromosomes were drawn using Mapchart of WinQTLCart.V2.5. The SNP markers and distances in centiMorgans are shown with each marker’s name on the right side of the chromosomes while their respective map distance is shown on the left side. The SNP markers were distributed on 13 chromosomes out of the 20 chromosomes in soybean genome. Most of the markers were located on chromosome 5 (9 markers) and chromosome 8 (11 markers) respectively. Chromosome 8 had a map interval distance of 9.10cM to 145.5 cM with an average map distance of 63.46Cm. Whereas a map interval distance of 39.40 cM to 100.10 cM with an average map distance of 77.16cM was recorded in chromosome 5.
3.1 Discussion
As earlier indicated, genetic linkage maps have been constructed using molecular markers such as RFLPs, RAPD, AFLPs, SSR and recently SNPs. In the recent times, the use of SNP markers have become more pronounced and projected to be the most useful marker due to its attribute of great deal of variation or diversity. [16] also opined that SNP markers have become the most useful in terms of construction of genetic linkage maps because of its distinguishing feature of variation. The current study reports a genetic map covering a length of 2211.46cM with the relative positions of the markers found consistent with Glycine max consensus map 4.0 [33]. The SNP markers were distributed on 13 linkage groups. The linkage groups were numbered from 1 to 19 based on the assigned chromosome number of soybean [1]. Eleven (11) markers were located on chromosome 8 being the highest covering
approximately 697.93cM followed by
chromosome 5 which had 9 markers covering 694.14cM. The remaining chromosomes have one SNP each with the exception of chromosome 16 which had 2 markers covering 108.23cM. The first genetic map in soybean constructed on 150 RFLP encompassed about
1,500cM [14]. Subsequently, different
markers have been used in constructing genetic map, in soybean covering about 2,500 cM by combining markers and maps which include, RFLPs [34], AFLPs [35], SSR [36] and SNP [37].
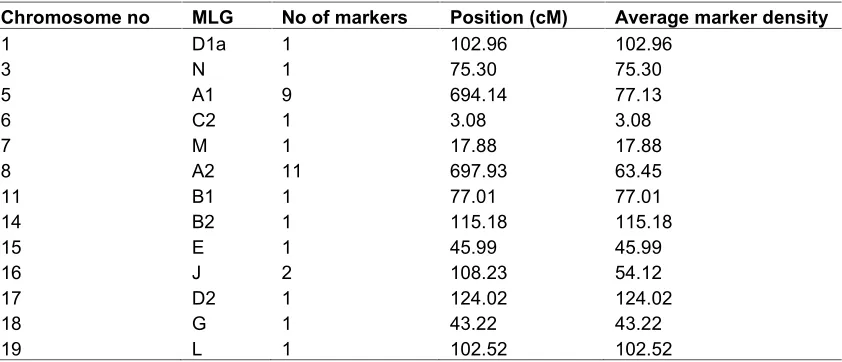
Table 1. Distribution of markers and their properties on the molecular linkage groups and chromosomes of soybean
Chromosome no MLG No of markers Position (cM) Average marker density
1 D1a 1 102.96 102.96
3 N 1 75.30 75.30
5 A1 9 694.14 77.13
6 C2 1 3.08 3.08
7 M 1 17.88 17.88
8 A2 11 697.93 63.45
11 B1 1 77.01 77.01
14 B2 1 115.18 115.18
15 E 1 45.99 45.99
16 J 2 108.23 54.12
17 D2 1 124.02 124.02
18 G 1 43.22 43.22
Fig. 1. SNP genetic linkage map based on 63 F2populations derived from 7 x 7 diallel cross in soybean, Glycine max
However, the genetic map constructed in this study is comparable in terms of length of map to other published maps reported earlier by [38] with map length of 2200cM; [15] with map length of 2,389 cM and [33] with map length of 2,229.40cM.
Furthermore, the genetic linkage map in the current study was constructed based on single population and few markers. However the map length (2,211.46cM) recorded by it is comparable to earlier published work of [37] with 642 SNP markers, map length 1,524.7cM with average marker distance of 2.37cM and [35] with 252 SSR markers of map length 2,200 cM with average marker distance of 8.73 cM. The genetic linkage map of the current study and that of [39] were based on a single population but with differing number of SNP markers. Although the latter work had a comparatively larger number of SNP markers (550) than the current study (50 SNP), the map length and the marker position of this study are higher than that of [39].
4. CONCLUSION
The present study showed a low density genetic
length of 2211.46cM; average marker density of 905.86cM) based on single nucleotide
polymorphisms (SNPs) markers. The
availability of SNP markers attached to a specific region of the soybean genome would serve as a basis for detection of quantitative trait loci (QTLs) for agronomic characters in soybean that could be used in marker assisted selection (MAS).
ACKNOWLEDGEMENT
The authors acknowledge the soybean germplasm collection and bioscience centre of International Institute of Tropical Agriculture (IITA) Ibadan, Oyo- State Nigeria, for the provision of the soybean genotypes used as parents and the DNA extraction respectively. The contributions of Daka, L. and Inqaba Biotechnical Laboratory, Pretoria South Africa, for the SNP design and the SNP analysis respectively are also acknowledged by the authors.
COMPETING INTERESTS
REFERENCES
1. Zou J, Lee J, Singh R, Xu SS, Cregan
PB, Hymowitz T. Assignment of molecular
linkage groups to the soybean
chromosomes by primary trisomics. Theor. Appl. Genet. 2003;107:745-750.
2. Song Q, Hyten DL, Jia G, Quigley CV, Fickus EW, Nelson RL, Cregan PB. Development and evaluation of soysnp50k, high density genotyping array for soybean. PLoSONE. 2013;1:e54985.
3. Cuevas HE, Rosa-Valentin G, Hayes CM, Rooney WL, Hoffmann L. Genomic characterization of a core set of the USDA-NPGS Ethiopian sorghum germplasm collection: Implications for germplasm conservation, evaluation, and utilization in crop improvement. BMC Genomics. 2017; 18(1):108.
4. Duminil J, DiMichele M. Plant species limitation: A comparison of morphological and molecular markers. Plant Biosystems, 2009;143(3):528-542.
5. Parducci L, Bennett KD, Ficetola, GF, Alsos IG, Suyama Y, Wood JR, Pedersen MW. Ancient plant DNA in lake sediments. New Phytologist. 2017;214(3):924-942. 6. Kumar R, Mago G, Balan V, Wyman CE.
Physical and chemical characterizations of corn stover and popular solids resulting from leading pretreatment technologies. Bioresource Technology. 2009;100(17): 3948-3962.
7. Buhroo, ZI, Ganai NA, Bhat MA. Molecular
Marker Systems with special reference to the SilkwormBombyx moriL. International Journal of Bioassays. 2016;5(11):5025-5040.
8. Grover A, Sharma PC. Development and
use of molecular markers: Past and present. Critical Reviews in Biotechnology. 2016;36(2):290-302.
9. Keim P, Schupp JM, Travis SE, Clavton K,
Zhu T, Shi L, Aferreira, A, Webb DM. A high density soybean genetic map based on AFLP markers. Crop Sci. 1997;37:573-543.
10. Samanfar B, Molnar SJ, Charette M, Schoenrock A, Dehne F, Golshani A, Cober ER. Mapping and identification of a potential candidate gene for a novel maturity locus, E10, in soybean. Theoretical and Applied Genetics. 2017; 130(2):377-390.
11. Varshney RK, Singh VK, Hickey JM, Xun X, Marshall DF, Wang J, Ribaut JM. Analytical and decision support tools for genomics-assisted breeding. Trends in Plant Science. 2016;21(4):354-363. 12. Akond M, Liu S, Schoener, L, Anderson
JA, Kantartzi SK, Meksem K, Kassem MA. A SNP-based genetic linkage map of soybean using the SoySNP6K Illumina Infinium Bead Chip genotyping array. Plant Genetics, Genomics, and Biotechnology. 2017;1(3):80-89.
ISSN: 2332-2012
13. Wang S, Chen J, Zhang W, Hu Y, Chang L, Fang L, Chen S. Sequence-based ultra-dense genetic and physical maps reveal structural variations of allopolyploid cotton genomes. Genome Biology. 2015;16(1): 108.
14. Keim P, Diers BW, Olson TC, Shoemaker RC. RFLP mapping in soybean: Association between marker loci and variation in quantitative traits. Genetics, 1990;126(3):735-742.
15. Choi IY, Hyten DL, Matukumalli LK, Song Q, Chaky JM, Quigley CV, Hwang EY. A soybean transcript map: gene distribution,
haplotype and single-nucleotide
polymorphism analysis. Genetics. 2007; 176(1):685-696.
16. Gaur R, Azam S, Jeena G, Khan AW, Choudhary S, Jain M, Yadav G, Tyagi AK, Chattopadhyay D, Bhatia S. High throughput SNP discovery and genotyping for constructing a saturated linkage map of chickpea (Cicer arietinum L.). DNA Res., 2012;19(5):357-373.
DOI: 10.1093/dnares/dss018
17. Bourke PM, Voorrips RE, Kranenburg T, Jansen J, Visser RG, Maliepaard, C. Integrating haplotype-specific linkage maps in tetraploid species using SNP
markers. Theoretical and Applied
Genetics. 2016;129(11):2211-2226. 18. Atwell S, Huang YS, Vilhjalmsson BJ,
Willems G, Horton M, Li Y, Meng D, Platt A, Tarone AM, Hu TT. Genome-wide association study of 107 phenotypes in Arabidopsis thaliana inbred lines. Nature. 2010;465:627–631.
association mapping population. Nat. Genet. 2011;43:159–162.
20. Andrews KR, Good JM, Miller MR, Luikart
G, Hohenlohe PA. Harnessing the power of RAD seq for ecological and evolutionary genomics. Nature Reviews Genetics. 2016;17(2):81.
21. Muchero W, Diop NN, Bhat PR, Fenton RD, Wanamaker S, Pottorff M, Hearne S, Cisse N, Fatokun C, Ehlers JD, Roberts PA, Close TJ. A consensus genetic map of cowpea [Vigna unguiculata (L) Walp.] and synthesis based on EST-derived SNPs. Proc. Natl Acad. Sci. USA. 2009;106: 18159–18164.
22. Huo N, Garvin DF, You FM, McMahon S,
Luo MC, Gu YQ, Lazo GR, Vogel JP. Comparison of a high-density genetic linkage map to genome features in the model grass Brachypodium distachyon. Theor. Appl. Genet. 2011;123:455–464.
23. Lam HM, Xu X, Liu X, Chen W, Yang G,
Wong FL, Li MW, He W, Qin N, Wang B, Li J, Jian M, Wang J, Shao G, Wang J, Sun SS, Zhang G. Resequencing of 31 wild and cultivated soybean genomes identification patterns of genetic diversity and selection. Nat. Genet. 2010;42:1053– 1059.
24. Zhang X, Borevitz JO. Global analysis of allele-specific expression in Arabidopsis. Genetics. 2009;182:943–954.
25. Subbaiyan GK, Waters DLE, Katiyar SK, Sadananda AR, Vaddadi S, Henry RJ. Genome-wide DNA polymorphisms in elite indica rice inbreds discovered by
whole-genome sequencing. Plant Biotech.
Journal. 2012;1:1–12.
26. Sim SC, Durstewitz G, Plieske J, Wieseke
R, Ganal MW. Development of a large SNP genotyping array and generation of high-density genetic maps in tomato. PLoSONE. 2012;7:e0040563.
27. Delourme RC, Falentin BF, Fomeju M,
Boillot G, Lassalle I, André J, Duarte V, Gauthier N, Lucante A, Marty M, Pauchon JP, Pichon N, Ribière G, Trotoux P, Blanchard N, Rivière JP, Martinant A, Pauquet J. High-density SNP-based genetic map development. Journal of Biotech.2013;11(1):131-142.
28. Dellaporta SL, Wood J, Hicks JB. A plant DNA minipreparation: Version II. Plant
29. Gabriel S, Ziaugra L, Tabbaa D. SNP Genotyping using the Sequenom Mass ARRAY iPLEX platform. Current Protocols in Human GeneticsJohn Wiley & Sons inc. NY. 2009;60:2.12.1–2.12.18.
30. Masouleh AK, Waters DL, Reinke RF,
Henry RJ. A high throughput assay for rapid and simultaneous analysis of perfect markers for important quality and agronomic traits in rice using multiplexed MALDI-TOF mass spectrometry. Plant Biotechnol. Journal. 2009;7:355–363.
31. Pattemore J, Henry RJ. Sequenome Mass
ARRAY iPLEX Gold SNP genotyping for high throughput variety identification. Interplant and Animal Genome XVI Conference, Sequenom Workshop, San Diego CA, USA. Sci. 2008;37:573-543. 32. Wang S, Basten CJ, Zeng ZB. Windows
QTL cartographer 2.5. Department of Statistics, North Carolina State University, Raleigh, NC; 2007.
33. Hyten DL, Cannon SB, Song Q, Weeks N,
Fickus EW, Shoemaker RC, Specht JE, Farmer AD, May GD, Cregan PB. High throughput SNP discovery through deep resequencing of a reduced representation library to anchor and orient scaffolds in the soybean whole genome sequence. BMC Genomics. 2010;11:31-38.
34. Lark KG, Wiesemann JM, Matthews B F, Palmer R, Chase K, Macalma T. A genetic map of soybean (Glycine max L.) using an intraspecific cross of two cultivars: ‘Minsoy’ and ‘Noir 1’. Theor. Appl. Genet. 1995; 86:901-906.
35. Shoemaker RC, Specht JE. Integration of the soybean molecular and classical genetic linkage groups. Crop Sci. 1995; 35:436–446.
36. Kassem MA, Shultz J, Meksem K, Cho Y,
Wood AJ, Iqbal MJ, Lightfoot DA. An updated ‘Essex’ by ‘Forrest’ linkagemap and first composite map of QTL underlying six soybean traits. Theor. Appl. Genet. 2006;113:1015-1026.
37. Kassem MA, Ramos L, Leandro L,
Mbofung G, Hyten DL, ,Kantartzi SK, Grier RL, Cianzio S, Meksem K. The First‘PI438489B’ by ‘Hamilton’ SNP Based Genetic Linkage Map of Soybean [Glycine max(L.) Merrill] and Quantitative Trait Loci (QTL) that Underlie SDS Resistance. Journal of Plant Genome Science. 2012; 1(2):18–30.
broad-based resistance to soybean cyst
nematode (Heterodera glycines) in
soybean PI567516C.Theor. Appl. Genet. 2010;121(7):1253–1266.
39. Akond M, Liu S, Schoener L, Anderson JA, Kantartzi SK, Meksem K, Song Q,
Wang D, Wen Z, Lightfoot DA, Kassem AM. A SNP-based genetic linkage map of soybean using the SoySNP6K Illumina Infiium bead chip genotyping array. Journal of Plant Genome Sciences. 2013;1(3):80– 89.
_________________________________________________________________________________
© 2017 Adewusi et al.; This is an Open Access article distributed under the terms of the Creative Commons Attribution License (http://creativecommons.org/licenses/by/4.0), which permits unrestricted use, distribution, and reproduction in any medium, provided the original work is properly cited.
Peer-review history: