Basavarajappa et al. Page 1 of 60
SOLID WASTE SOURCE AND DISPOSAL PRACTICES IN FEW EDUCATIONAL
INSTITUES IN MYSORE CITY, KARNATAKA, INDIA – A CASE STUDY
Nandini L. S. and S. Basavarajappa*
Department of Studies in Zoology, University of Mysore, Manasagangothri, Mysore -570 006, Karnataka, India.
Received date: November 2018 Revised date: 23 November 2018 Accepted date: 14 December 2018
INTRODUCTION
The solid waste management is one of the most challenging tasks in India.[1] The waste is produced due to various man-made activities at different places in rural and urban ecosystems in turn causes pollution.[2] Several researchers[3-11] have reported on various aspects of solid waste and its disposal, recycling and management practices in Mexico, Canada, Nigeria, Ethiopia European countries, China and other Asian developing countries.
In India,[12] have explained the solid waste sources,
collection, transportation, recycling and its
management.[1,13-23] Have studied the municipal solid waste and suggested its management in different cities of
India.[24] Has suggested the solid waste management plan
for Indian megacities.[25] Has reported the issues of solid
waste management at institutions in urban India.[26]Have
assessed the status of municipal solid waste management in class I metro cities and class II towns in India. However, in Karnataka,[27-28] have studied the solid waste
management in Bangalore.[29-31] Have studied the
municipal solid waste management in Mysore city. Recently,[32-34] have reported the solid waste source, collection and disposal practices in food supplying centers (FSCs), health care centers (HCCs) and residential areas (RAs) in Mysore city. All these published reports indicated that solid waste disposal practices in schools and colleges are poor and such information especially from educational institutes in
Original Article www.wjahr.com
ISSN: 2457-0400 Volume: 3.
Issue: 1. Page N. 55-60
Year: 2019
WORLD JOURNAL OF ADVANCE
HEALTHCARE RESEARCH
*Corresponding author:S. Basavarajappa
Department of Studies in Zoology, University of Mysore, Manasagangothri, Mysore -570 006, Karnataka, India.
ABSTRACT
Mysore is one of the educational hubs in India. It provides better education to the students from different parts of India and other countries. Obviously, it is the prime privilege of Mysore to offer good and clean environment around the year. To record the waste produced from different school and colleges 18 wards were selected randomly and 55 educational institutes were visited personally during January to April, 2018. The solid waste source, collection, storage, isolation, transportation and disposal practices were collected by using pre-tested questionnaire. Five type of paper waste, six type of plastic waste and seven other types of waste were commonly recorded from different schools and colleges. The incompletely used papers (23.4%), news paper (21.7%), card board sheets (17.6%), challans, waste cheques (14.4%) and paper cups (22.9%) appeared as bio-degradable waste. The plastic sachets/wrappers (36.9%), chocolate covers (28.3%), snack covers (26.4%), empty butter milk, sweet box covers, plastic water bottles, juice bottles and plastic sachets (around 4%) appeared as non-biodegradable waste. The unused food (24.5%), electronic waste (22.1%), dry leaves (16.2%), unused pencil, eraser (rubber) (15.7%), ink bottles, laboratory waste and metal waste (around 10%) appeared as other type of waste in educational institutes. The waste collection methods were not alike. Fifty per cent of the educational institutes have isolated waste into dry and wet waste and remaining 50% of the educational institutes didn’t practice the waste segregation. Further, quantity of waste produced per day was considerably varied among the educational institutes. Further, 68.7% of the educational institutes did use general dust bin for storing the collected waste and remaining 31.3% of the educational institutes stored the waste in colour coded dust bins. Further, disposal of waste produced in educational institutes varied considerably. Despite the clean city status three times, Mysore is still experiencing hardships to control and manage the solid waste at educational institutes and it demands regular update on solid waste to develop management strategies to maintain clean and hygienic environment amidst educational institutes in Mysore.
Mysore is wanting. Hence, the present study was undertaken.
MATERIALS AND METHODS
Study area: Mysore is located in between 11º40' to 12º40' N. latitude and 75º57' to 77º15' E. longitude with an altitude 770 meters above mean sea level.[35] The city experiences tropical climate which is characterized by warmer summer and cool winter season with equable temperatures. Mysore is third most populous city in Karnataka, with 82.8% literacy rate. It becomes one of the educational hubs in India, attracting students from different parts of India and other countries to provide better education. Obviously, students expecting clean, hygienic and pollution free conditions amidst educational institutes in the heritage city like Mysore.
Methodology: To record the waste produced at different schools and colleges, pre-tested questionnaire was prepared by considering the origin, source, production, collection, storage, isolation, transportation and disposal of waste at different schools and colleges selected at different places as shown in Table 1. Out of 65 wards in Mysore city,[34] total 55 educational institutes viz., schools and colleges were selected randomly from 19 places in Mysore and their per cent sampling is given in Table 1. Each and every school and college was visited personally during January to April, 2018 to collect the
data as per.[32-33] Collected data was complied
systematically and analyzed by following standard methods as per.[36]
RESULTS
Type of waste produced: Table 2 shows the different types of waste produced from educational institutes viz.,
schools and colleges in Mysore. Five type of paper waste, six type of plastic waste and seven other types of waste were commonly recorded from different schools and colleges. The paper waste included incompletely used papers (23.4%), news paper (21.7%), card board sheets (17.6%) and challans and waste cheques (14.4%) were commonly appeared as bio-degradable waste in educational institutes. Moreover, paper cups used to drink tea/coffee have produced 22.9% and it also became
bio-degradable waste (Table 2). The plastic
sachets/wrappers (36.9%), chocolate covers (28.3%), snack covers (26.4%) were appeared as major plastic waste in educational institutes. Moreover, empty butter milk, sweet box covers, plastic water bottles, juice bottles and plastic sachets appeared less than 4% as non-biodegradable waste in educational institutes (Table 2). Further, other types of waste included unused food (24.5%), electronic waste (22.1%), dry leaves (16.2%) and unused pencil and eraser (rubber) (15.7%) appeared in educational institutes every day (Table 2). Moreover, ink bottles, laboratory waste and metal waste also appeared less than 10% as waste in educational institutes (Table 2).
Waste collection and isolation: Time of waste collection and methods followed while isolating the waste was not alike in different schools and colleges. Table 3 shows the collection and isolation of waste in
educational institutes. Majority (52.8%) of the
educational institutes, where waste was collected during evening hours and 43.7% of the institutes preferred morning hours for waste collection. However, 3.5% of the educational institutes were not specific, but collected waste during free hours of the day (Tale 3). Interestingly, 50% of the educational institutes have practiced proper isolation in the collected waste as dry and wet waste (50% each) respectively. However, remaining 50% of the
educational institutes didn’t practice the waste
segregation into dry or wet before their disposal.
Quantity of waste produced: Quantity of waste produced per day was considerably varied among the
educational institutes. Majority (36.4%) of the
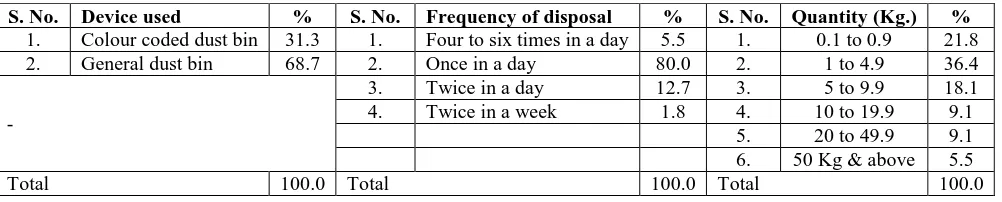
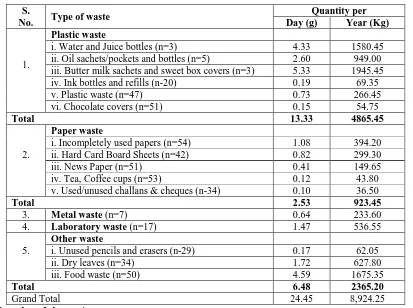
educational institutes produced one to 4.9 kilogram of waste every day and it was followed by 21.8% of the educational institutes produced 0.1 to 0.9 kilogram of waste every day. Moreover, around 18.1% of the educational institutes produced 5 to 9.9 kilograms of waste every day (Table 4). Total 10 to 19.9 and 20 to 49.9 kilogram of waste was produced by 9.1% of the each educational institute and only 5.5% of the educational institutes have produced 50 kilogram of waste every day (Table 4). Further, Table 5 shows the different type of waste and their quantity produced in few educational institutes in Mysore. Around six items contributed 13.33 grams plastic waste per day and 4.865.45 kilograms per year at few educational institutes. Similarly, from five items, 2.53 grams and 923.45 kilograms paper waste produced per day and year in educational institutes. Other waste constituted 6.48 grams per day and 2365.20 kilograms per year. Moreover, the laboratory waste 1.47 grams and 536 kilograms produced per day and year respectively in few educational institutes. The metal waste 0.64 grams and 233.60 kilograms produced respectively per day and year respectively. Altogether, 24.45 grams and 8924.25 kilograms waste produced respectively every day and year in few educational institutes in Mysore (Table 5).
Table 1: Study area and no. of educational institutes selected and per cent sampling made in Mysore. S. No. Place No. of Schools & Colleges selected (‘n’) % Sampling
1. Aghrahara 1 1.8
2. Bannimantappa 1 1.8
3. Bannur Road 1 1.8
4. Brindhavana Extension 2 3.7
5. Crawford Hall 1 1.8
6. D. R. Mohalla 4 7.3
7. Jayalakshmipuram 7 12.7
8. JLB Road 3 5.5
9. K. D. Road 1 1.8
10. Lashkar Mohalla 5 9.1
11. Manasagangotri 7 12.7
12. Metagalli 5 9.1
13. Nazarbad 5 9.1
14. N. R. Mohalla 3 5.5
15. N. S. Road 5 9.1
16. Ramakrishna Lay Out 1 1.8
17. Vijaya Nagar 1 1.8
18. V.V. Puram 1 1.8
19. Yadavagiri 1 1.8
Total 55 100.0
Table 2: Paper waste produced in few educational institutes.
Paper waste Plastic waste Other waste
S.
No. Items %
S.
No. Items %
S.
No. Items %
1. Card board sheets 17.6 1. Butter milk & empty
sweet box covers 2.3 1. Dry leaves 16.2
2. Challans & waste
cheques 14.4 2. Chocolate covers 28.3 2. Electronic waste 22.1
3. Incompletely used paper 23.4 3. Oil plastic bottles/sachets 3.8 3. Ink bottles and refills 9.8
4. News paper 21.7 4. Plastic sachets/wrapper 36.9 4. Laboratory waste 8.3
5. Tea/coffee paper cups 22.9
5. Snacks covers 26.4 5. Metal waste 3.4
6. Water & juice plastic
bottles 2.3
6. Unused food waste 24.5
7. Unused pencil & eraser 15.7
Total 100.0 Total 100.0 Total 100.0
Table 3: Collection and isolation of waste in few educational institutes.
Collection Isolation
S.
No. Time % Method %
S.
No. Type %
1. Free hours of the day 3.5 1. Collected waste not sorted 50.0 1. Dry waste 50.0
2. Early morning 43.7
2. Collected waste sorted 50.0 2. Wet waste 50.0
3. Evening 52.8
Total 100.0 Total 100.0 Total 100.0
Table 4: Storage devices, frequency of waste disposal and quantity of waste produced in educational institutes. S. No. Device used % S. No. Frequency of disposal % S. No. Quantity (Kg.) %
1. Colour coded dust bin 31.3 1. Four to six times in a day 5.5 1. 0.1 to 0.9 21.8
2. General dust bin 68.7 2. Once in a day 80.0 2. 1 to 4.9 36.4
-
3. Twice in a day 12.7 3. 5 to 9.9 18.1
4. Twice in a week 1.8 4. 10 to 19.9 9.1
5. 20 to 49.9 9.1
6. 50 Kg & above 5.5
Table 5: Quantity of waste produced in educational institutes. S.
No. Type of waste
Quantity per Day (g) Year (Kg)
1.
Plastic waste
i. Water and Juice bottles (n=3) 4.33 1580.45
ii. Oil sachets/pockets and bottles (n=5) 2.60 949.00
iii. Butter milk sachets and sweet box covers (n=3) 5.33 1945.45
iv. Ink bottles and refills (n-20) 0.19 69.35
v. Plastic waste (n=47) 0.73 266.45
vi. Chocolate covers (n=51) 0.15 54.75
Total 13.33 4865.45
2.
Paper waste
i. Incompletely used papers (n=54) 1.08 394.20
ii. Hard Card Board Sheets (n=42) 0.82 299.30
iii. News Paper (n=51) 0.41 149.65
iv. Tea, Coffee cups (n=53) 0.12 43.80
v. Used/unused challans & cheques (n-34) 0.10 36.50
Total 2.53 923.45
3. Metal waste (n=7) 0.64 233.60
4. Laboratory waste (n=17) 1.47 536.55
5.
Other waste
i. Unused pencils and erasers (n-29) 0.17 62.05
ii. Dry leaves (n=34) 1.72 627.80
iii. Food waste (n=50) 4.59 1675.35
Total 6.48 2365.20
Grand Total 24.45 8,924.25
Note: ‘n’ number of observations.
DISCUSSION
Solid waste control and management activities are regularly conducted every day at various urban centers in India. It is a continuous process,[37] regular disposal of solid waste help assist proper management,[38,5,20,10] especially at schools and colleges. The produced solid waste at residential areas, food servicing centers, hospitals and other places are collected by various agencies including concerned city municipalities.[32-34] Despite this, solid waste management is not achieved up to the mark in educational institutes. In many schools and colleges, the time of waste collection was not alike and majority (52.8%) of the schools and colleges didn’t collect waste during morning hours, instead they did during evening hours. Few schools and colleges (3.5%) didn’t even adopted proper timings for waste collection. Moreover, 50% of the schools and colleges were not properly segregated the waste before disposal. It is appropriate to collect waste during morning hours i.e., before office begins, so that neat and cleanliness could be achieved and fresh environment could be maintained during working hours amidst school and college premises. At different schools and colleges, very good quantities of different waste items were produced every day. It was ranged in between 0.1 to 50 kilograms. From
six different plastic items, 13.33 grams
non-biodegradable waste, five items papers items contributed 2.53 grams bio-degradable waste and other types of waste contributed 6.48 grams waste every day. Altogether, 4865.45, 923.45 and 2365.20 kilograms of
plastic, paper and other types of waste respectively produced every year in few schools and colleges. The solid waste is with different characteristics,[19] it should be stored separately. However, the storage and disposal of different wastes produced in schools and colleges was not alike. Highest per cent of the schools and colleges need to use colour coded dust bins for proper storing of the waste. And, 1.8% of the schools and colleges need proper training to practice regular disposal of collected waste every day. Certain non-biodegradable wastes especially metal, rubber, glass, plastic and electronic items need specific disposal sites and offer more scope for recycling.[39-40] Scientific approach is required to recycle non-biodegradable waste effectively. Efforts were made in The Netherlands,[41] in Canada[6] and in
Kenya[42] to recycle the available non-biodegradable
waste. Further, available bio-degradable waste can be used for composting.[11] In this regard more efforts should be made to have good sanitation and hygiene in and around schools and colleges. To achieve this task, different management practices are required to adopt[43] for better solid waste management. Schools and colleges act as ‘temples of learning’, where more efforts should be made to educate and train the students during their leisure time on solid waste management. In this regard, more and more educative lectures and interactions should be arranged by inviting environmentalists, biologists,
chemists, waste analysts, policy makers and
eco-friendly way[9,4,44-45,18] especially for many metropolitan cities of India. This type of approaches needs of the day for clean cities like Mysore also. So, that schools and colleges can contribute much to the cities where hygiene and sanitation and pollution free environment is required to achieve clean and smart city status. Our observations are in agreement with the observations of.[4,6,9,18,32-34,37,41-42,44-45]
SUMMARY
The solid waste production was ranged in between 0.1 to 50 kilograms in different schools and colleges. The time of waste collection, storage and disposal of different wastes produced in schools and colleges was not alike. Total 52.8% of the schools and colleges didn’t collect waste during morning hours. Majority of the schools and colleges require colour coded dust bins for proper storing of the waste. Around 50% of the schools and colleges were not properly segregated the waste before disposal. Total 13.33 grams non-biodegradable waste, 2.53 grams bio-degradable waste and 6.48 grams other type of waste produced every day at few schools and colleges. The paper, dry leaves and unused food wastes becomes important sources for bio-degradable waste can be used to produce organic manure. The plastic, metal electronic items are non-biodegradable waste can be recycled for reuse.
RECOMMENDATIONS
The solid waste must be isolated into biodegradable and non-biodegradable waste at the place of its occurrence in every educational institute and should be properly stored in colour coded dustbins which is placard with the bio-hazard mark for their safe disposal. In this regard, school and colleges must take up this issue seriously on top priority basis every day. The municipalities and other agencies involved in solid waste disposal must collect solid waste every day from educational institutes and dispose regularly.
ACKNOWLEDGEMENT
Authors are thankful to the Chairperson, DOS in
Zoology, University of Mysore, Mysore for
encouragement. Some part of this work is benefited from the grants of PSFS, DOS in Zoology, Manasagangotri, Mysore.
REFERENCES
1. Joshi R, Ahmed S. Status and challenges of
municipal solid waste management in India: A review. Cogent Environmental Sci., 2016; 2: 1139434:1-18.
2. Trivedi PR, Raj G. Solid waste pollution. Edn.
Encyclopedia of Environmental Science. Akashdeep Publishing House, New Delhi, 1992; 1-17.
3. Buenrostro O, Bocco G. Solid waste management in
municipalities in Mexico: Goals and perspectives.
Resources, Conservation & Recycling, 2003; 39: 251-263.
4. Idris A, Inane B, Hassan MN. Overview of waste
disposal and landfills/dumps in Asian countries. Material Cycles and Waste Management, 2004; 16: 104-110.
5. Huang Q, Wang Q, Dong L, Xi B, Zhou B. The
current situation of solid waste management in China. J. Matter Cycles Waste Management, 2006; 8(1): 63-69.
6. Ferrara I, Missios P. Recycling and waste diversion
effectiveness: Evidence from Canada.
Environmental and Resource Economics, 2005; 30: 221-238.
7. Ogwueleka T, Ch. Municipal solid waste
characteristics and management in Nigeria. Iran J. Environmental Health Science and Engineering, 2009; 6(3): 173-180.
8. Zhang DQ, Tan SK, Gersberg RM. Municipal solid
waste management in China: status, problems and challenges. J. Environmental Management, 2010; 91(8): 1-4.
9. Pires A, Martinho G, Chang, NB. Solid waste
management in European countries: A review of systems analysis techniques. J. Environmental Management, 2011; 92: 1033-1050.
10. Gedefaw M. Assessing the current status of solid waste management of Gondar town, Ethiopia. Internat. J. Scientific and Technology Research, 2015; 4(9): 28-36.
11. Harir AI, Kasim R, Ishiyaku B. Exploring resource recovery potentials of municipal solid waste: A review of solid wastes composting in Developing countries. International J. Scientific and Research Publications, 2015; 5(4): 1-8.
12. Singh GK, Gupta K, Chaudhary S. Solid waste
management: Its sources, collection, transportation and recycling, 2014; 5(4): 347-351.
13. Malvia R, Choudhary R, Dharam B. Study on solid
waste assessment and management in Indore city. IJEP, 2002; 22(8): 841-846.
14. Jha MK, Sondhi OAK, Pansare M. Solid waste
management – a case study. IJEP, 2003; 23(11): 1153-1160.
15. Macwan JEM, Shukla J, Patel P, Shah B.
Metropolitan Domestic solid waste generation analysis in Indian context. J. Indian Association Environmental Management, 2003; 30: 158.
16. Ahmed SA, Ali M. Partnerships for solid waste
management in developing countries: Linking theories to realities. Habitat International, 2004; 28: 467-479.
17. Renjini RL, Prakasam VR. An evaluation of
municipal solid waste management in Tripunithura municipality of Kerala. IJEP, 2005; 25(7): 652-656.
18. Dhane AD, Sopan IT, Sanjay AB, Nilesh WD.
19. Sharholy M, Ahmad K, Vaishya RC, Gupta RD.
Municipal solid waste characteristics and
management in Allahabad, India. Waste
Management, 2007; 27: 480-496.
20. Sharholy M, Ahmad K, Mahmood G, Trivedi RC.
Municipal solid waste management in Indian cities – A review. Waste management, 2008; 28: 459-467.
21. Shekdar AV. Municipal solid waste management-
The Indian perspective. J. Indian Association for Environmental Management, 1999; 26: 100-108.
22. Pattnaik S, Reddy MV. Assessment of municipal
solid waste management in Puducherry
(Pondicherry), India. Resources, Conservation and Recycling, 2010; 54: 512-520.
23. Agarwal M, Jareda K, Bajpai M. A review on solid
waste management for smart city. SSRG
International J. Civil Engineering (SSRG-IJCE), 2016; 3(5): 109-112.
24. Ahsan N. Solid waste management plan for Indian
megacities. Indian J. Environmental Protection, 1999; 19: 90-95.
25. Joardar SD. Urban residential solid waste
management in Indi: Issues related to institutional arrangements. Public Works Management and Policy, 2000; 4: 319-330.
26. Kumar S, Bhattacharyya JK, Vaidya AN,
Chakrabarti T, Devotta S, Akolkar AB. Assessment of the status of municipal solid waste management in metro cities, state capitals, class I cities, and class II towns in India: An insight. Waste Management, 2009; 29: 883-895.
27. Shivashankara GP, Rekha HB. Solid waste
management in suburban areas of Bangalore. Nature Environment and Pollution Technology, 2005; 4(4): 495-500.
28. Gupta CKN, Shekar GL. Electronic waste
management system in Bangalore – A review. Research India Publications, 2009; 1: 11-24.
29. Chandra YI, Devi NL. Studies on municipal solid
waste management in Mysore city-A case study. Report and Opinion, 2009; 1(3): 15-21.
30. Siddiqui J, Pandey G, Akhtar S. A case study of solid waste management in Mysore city. Internat J. Application or Innovation in Engineering & Maagement (IJAIEM), 2013; 2(11): 290-294.
31. Chavan ID, Patil DS. Zero waste management
system: case study-Kumbarakoppal, Mysore.
International J. Engineering Reserch and
Technology (IJERT), 2017; 6(5): 768-770.
32. Megha TR, Basavarajappa S. Source of waste and its
disposal practices at food supplying centers in Mysore city, Karnataka– A case study. World Journal of Advance Healthcare Research, 2018; 2(4): 268-280.
33. Sashikala K, Basavarajappa S. Hospital waste
disposal practices at few health care centres in Mysore city, Karnataka, India – A case study. World Journal of Advance Healthcare Research, 2018; 2(5): 191-197.
34. Kshema R, Basavarajappa S. Muncipal solid waste
source and disposal practices in residential areas of Mysore city, Karnataka, India – a case study. World Journal of Advance Healthcare Research, 2018; 2(6): 52-61.
35. Kamath US. Mysore District Gazetteer. Government
of Karnataka, India, 2001; 1-100.
36. Saha TK. Biostatistics in theory and practice. Emkay
Publications, Delhi, 2009; 7-167.
37. Macwan JEM, Shukla J, Patel P, Shah B.
Metropolitan domestic solid waste generation analysis in Indian context. J. Indian Association Environmental Management, 2003; 30: 158-161.
38. Singhal S, Pandey S.Solid waste management in
India: Status and future directions. TERI
Information Monitor on Environmental Sciences, 2000; 6: 1-4.
39. Brigden K, Labunska I, Santillo D, Johnston P.
Chemical contamination at e-waste recycling and disposal sites in Accra and Korforidua, Ghana. Greenpeace Toxic Technology, 2008; 10: 2008.
40. Sivaramanan S. E-waste management, disposal and
its impacts on the environment. Universal J. Environmental Research and Technology, 2013; 3(5): 531-537.
41. Dijkgraaf E, Gradus RHJM. Cost savings in
unit-based pricing of household waste: The case of The Netherlands. Resource and Energy Economics, 2004; 26: 353-371.
42. Wilfred KS, Moindi MN. Recycling of wastes as a strategy for environmental conservation in the lake Victoria Basin: The case of women groups in Kisumu, Kenya. African J. Environmental Science and technology, 2008; 2(10): 318-325.
43. Muzamdar NB. Muncipal solid waste management
the Indian perspectives. Environment Monitor, 1994; 12(2): 257-269.
44. Rathi S. Alternative approaches for better municipal
solid waste management in Mumbai, India. J. Waste Management, 2006; 26(10): 1192-1200.
45. Misra V, Pandey SD. Hazardous waste, impact on