3520 FORMULATION AND OPTIMIZATION OF CONTROLLED RELEASE PAROXETINE
HYDROCHLORIDE TABLETS USING RESPONSE SURFACE METHODOLOGY
Priyanka Kunamaneni1, Surya Prakasarao Kovvasu2*, Kalyan Chakravarthy Janjanam3
1
Department of Pharmaceutics, Vel’s College of Pharmacy, Tamil Nadu Dr.
M.G.R. Medical
University, Chennai- 600 117, Tamil Nadu, India
2
University College of Pharmaceutical Sciences, Andhra University, Visakhapatnam-
530 003, Andhra Pradesh, India
3
Sri Ramakrishna College of Para Medical Sciences, Tamil Nadu Dr. M.G.R. Medical
University, Chennai- 600032, Tamil Nadu, India
*Corresponding Author: [email protected]
ARTICLEINFO
ABSTRACT
Keywords
:Paroxetine hydrochloride, response surface methodol-ogy, design of experiments, central composite design, reference listed drug (RLD)
Controlled drug delivery has taken an important position in pharmaceutical devel-opment due to improving the tolerability and patient compliance with prescribed dosing regimens. Paroxetine IR antidepressant efficacy may compromised by ear-ly discontinuation of treatment secondary to common, treatment-emergent side effects, including nausea, agitation and somnolence. This study is to develop a generic controlled release Paroxetine hydrochloride matrix tablet, which is stable, robust and an acceptable formulation when compared to Paxil CR a reference listed drug (RLD). A central composite design (CCD) with α =1 was employed as
per the standard protocol. HPMC K4M (x1), HPMC K100 (x2) and ethyl cellulose 7CPS (x3) are selected as independent factors, studied at two levels each. In case of dissolution at 60 minutes time point the model F-value of 30.44 implies the model is significant. In case of dissolution at 240 minutes time point the model F-value of 483.88 implies the model is significant. All the runs compared for disso-lution profiles against the pealed Paxil CR to check the similarity factor. Out of the 12 runs, run 2 (F2) has shown higher similarity factor when compared against pealed Paxil CR and the same has been confirmed with the reproducible run 10 (F10). Acryl-EZE coating weight build-ups of 6.0%, 7.0% and 8.0% w/w were given on the run 2 composition. It can be highly postulated that the Higuchi model could best express in vitro release profile of all the matrix formulations. Formula-tion F14 was finalized, 30’s count were filled into HDPE bottle 75cc/ 33 mm screw neck and loaded for stability along with RLD bottles. No difference in the dissolution profile between the initial and 3 months accelerated stability samples with Paxil CR and F14 formulations. The results from the in vitro alcohol study showed that alcohol increased the release of the drug from the formulation, but a dose dumping effect per se was not observed.
INTRODUCTION
Controlled release is a term referring to the presentation or delivery of compounds in re-sponse to stimuli or time. Time-release is a mechanism used in several dosage forms to
dissolve a drug over time in order to be re-leased slower and steadier into the blood stream while having the advantage of being taken at
Journal of Global Trends in Pharmaceutical Sciences
3521 less frequent intervals than
immediate-release (IR) formulations of the same drug.
Paroxetine hydrochloride1-3 is an orally admin-istered psychotropic drug. It is the hydrochlo-ride salt of a phenylpiperidine compound. Par-oxetine is a selective serotonin reuptake inhibi-tor, chemically unrelated to tricyclic, tetracy-clic, or other antidepressants; presumably, the inhibition of serotonin reuptake from brain syn-apse stimulated serotonin activity in the brain. Paroxetine IR antidepressant efficacy may be compromised by early discontinuation of treatment secondary to common, treatment-emergent side effects, including nausea, agita-tion and somnolence. Paroxetine controlled release (CR) was developed to improve general tolerability and in particular, gastrointestinal tolerability. Matrix-based CR tablet formula-tions are the most popular and easiest to formu-late on a commercial scale. The matrix tablets can be prepared via wet granulation4 or by di-rect compression5-6. Many polymers have been used in the formulation of matrix-based CR drug delivery systems. Reports were found on usage of hydrophilic polymers such as hydrox-ypropyl methyl cellulose (HPMC), methyl cel-lulose, sodium carboxy methyl celcel-lulose, car-bopols etc., for the purpose of controlled re-lease7-11 formulations of different drugs. In this study as Paroxetine hydrochloride is a water soluble drug, mixture of hydrophilic polymer HPMC and hydrophobic polymer ethyl cellu-lose were used to control the drug release and coated with Acryl-EZE12-14 coating which con-tains methacrylic acid copolymer type C, sodi-um carbonate, talc, silica, sodisodi-um lauryl sulfate and triethyl citrate so as to minimize/ prevent initial drug release in stomach that will reduce the possible gastro irritant effects of the drug. A normal conventional optimization process, a single independent variable is varied while all others are kept constant at a specific set of con-ditions. It is not possible to change more than one parameter at a time during the formulation development. This method may lead to unrelia-ble results and improper conclusions besides wastage of production cost and man power. A computer based factorial design is an alterna-tive to overcome the above mentioned difficul-ties. A response surface methodology15 (RSM) is a widely practiced approach in the develop-ment and optimization of drug delivery devices. Based on the principal of design of experiments (DOE), the methodology encompasses the use
of various types of experimental designs, gen-eration of polynomial equations, and mapping of the response over the experimental domain to determine the optimum formulation(s). The technique requires minimum experimentation and time, thus proving to be far more effective and cost-effective than the conventional meth-ods of formulating dosage forms. A central composite design (CCD) can be run sequential-ly because it can be naturalsequential-ly partitioned into two subsets of points; the first subset estimates linear and two-factor interaction effects while the second subset estimates curvature effects. The second subset need not be run when analy-sis of the data from the first subset points indi-cates the absence of significant curvature ef-fects. CCDs are very efficient, providing much information on experiment variable effects and overall experimental error in a minimum num-ber of required runs. CCDs are very flexible. The availability of several varieties of CCDs enables their use under different experimental regions of interest and operability.
The objective of the present study is to prepare Paroxetine hydrochloride core tablets by using HPMC K4M, HPMC K100M, ethyl cellulose and Povidone as release controlling polymers by using factorial study16-19. Coating optimiza-tion was done with Acryl-EZE to evaluate the dissolution rate of Paroxetine hydrochloride tablets in comparison with Paxil CR. In vitro release kinetic study20-22 and stability studies were performed for the prepared Acryl-EZE coated Paroxetine hydrochloride CR tablet. This study is to develop a generic Paroxetine hydrochloride CR tablet which is stable, robust and an acceptable formulation when compared to Paxil CR.
MATERIALS AND METHODS Materials
Paroxetine hydrochloride was procured from Milton Drugs Pvt. Ltd., Puducherry, spray dried lactose and hydroxylpropyl methyl cellulose (HPMC) were obtained from Dow Chemical Company, USA, ethyl cellulose 7CPS (Etho-cel), aerosil and magnesium stearate were ob-tained from Rankem Limited, Mumbai, Pov-idone K30 was purchased from Signet Chemi-cal, Mumbai, Acryl-EZE from Rohm GmbH, Thane.
3522 Formulation design of controlled release
matrix tablets
For preparation of Paroxetine hydrochloride CR matrix tablets direct compression method was adopted. All the formulations were pre-pared according to CCD model and the respec-tive compositions were shown in Table 1& 2. Accurate quantities of all the ingredients were weighed and passed through sieve #40. The sieved materials were mixed thoroughly by tumbling method in a polythene bag and the dry blend was lubricated with aerosil and magnesi-um stearate. After lubrication, the formulations were evaluated for flow properties like angle of repose, bulk density, compressibility index pri-or to compression. Then the lubricated dry blends were subjected to punching using a tab-let punching machine with punch size: 8.3 mm round concave punches having upper punch
embossed with ‘N’ and lower punch embossed with ‘37.5’. Tablet weight was adjusted to 230 mg and hardness was adjusted to 5-7 kg/cm2. Then the prepared tablet formulations were evaluated for post compression parameters like thickness, weight variation, hardness, friability, drug content and in vitro dissolution studies. Acryl-EZE coating of Paroxetine hydrochloride CR matrix core tablets
A 20% w/w of Acryl-EZE in water was pre-pared with continuous stirring for 1 hour. It contains methacrylic acid copolymer type C, sodium carbonate, talc, silica, SLS and tri-ethylcitrate. The final solution was passed through #100 and pH of the final solution was 5.3. Enteric coating was done by using standard 24-inch Accela-cota make with spray nozzle of 0.040 inch fluid orifice. The speed of the pan was 22-26 rpm and speed of the pump was 1-3 rpm, temperature of 550C with spray rate of 1.2 kg/cm2. After spraying the total volume of solu-tion, compressed air was stopped and the tab-lets were rolled for another 10 minutes for complete drying. Average weight of the coated tablets was calculated. The enteric coated tab-lets were evaluated for various post compres-sion parameters.
EVALUATION
Particle size of pure drug
Mechanical sieve shaker (Make: Electrolab, Mumbai) was used to measure the particle size of the active pharmaceutical ingredient (API). A series of standard sieves were stacked one
above the other so that sieves with larger pore size (less sieve number) occupy top position followed by sieves with smaller pore size (greater sieve number towards the bottom). Par-ticle size was calculated based on the percent drug retained.
FTIR spectral studies
FTIR study was performed to verify any physi-cal or chemiphysi-cal interaction between drug and excipients used in the formulation. FTIR spec-tra of the pure drug Paroxetine hydrochloride, pure polymers and mixture of both drug and polymers were carried out by comparing the obtained spectra for the presence of functional groups. It was done by potassium bromide (KBr) pellet method. Formulations were taken in a KBr pellet using BOMEN MB SERIES FTIR instrument. Approximately 5 mg of sam-ples were mixed with 50 mg of spectroscopic grade KBr; samples were scanned in the IR range from 500 to 3500 cm-1, with a resolution of 4 cm-1.
Evaluation of pre compression parameters Micromeritic properties like angle of repose, bulk density, tapped density and compressibility index (Carr’s index) were performed to know the flow properties of powder blend.
Evaluation of Paroxetine hydrochloride matrix core tablets
As part of In-process tests and quality control checks weight variation, thickness, diameter, hardness and friability tests of Paroxetine hy-drochloride matrix core tablets were performed. As the formulations are of controlled release matrix tablets there is no scope for disintegra-tion test.
Assay of Paroxetine hydrochloride matrix core tablets
3523
In vitro release study
In vitro release studies were carried out using dissolution test apparatus USP type II (n=6). For each sample, dissolution was performed in 750 mL of 0.1N hydrochloric acid at 150 rpm using USP type II apparatus for 2 hours fol-lowed by 1000 mL of Tris buffer pH 7.5 main-tained at 37°C ± 0.5°C with 150 rpm. Aliquot samples were withdrawn for a period of 6 hours, filtered through a 0.45 µm millipore fil-ter and replaced by an equivalent volume of fresh dissolution medium. The amount of drug dissolved was determined by HPLC method using HPLC Dvelosil C8 (33x4.6 mm) column at a flow rate of 2.0 mL/minute, column tem-perature 30oC, run time 5 minutes at a wave length of 295 nm.
Optimized core formulation by central com-posite design
The optimization of controlled release formula-tion of Paroxetine hydrochloride was done by using design expert software. A central
compo-site design (CCD) with α =1 was employed as
per the standard protocol. HPMC K4M (x1), HPMC K100 (x2) and ethyl cellulose (x3) were selected as the independent factors, studied at two levels each. All the other formulation and processing variables were kept invariant throughout the study. Table 1 summarizes an account of the 12 experimental runs studied, their factor combinations, and the translation of the coded levels to the experimental units em-ployed during the study. Percent of drug release in 60 minutes (rel60min) and drug release in 240 minutes (rel240min) were taken as the responsible variables.
Release kinetic study
To study the mechanism of drug release from the optimized formulation of matrix tablets, the release data were fitted to following equations: Zero- order equation: Qt= Q0 +k0t
Where, Qt is the amount of drug release
in time t, Q0 is the initial amount of
drug in the solution (most times, Q0=
0) and k0 is the zero order release rate.
First- order equation: ln Qt= ln Q0 +k1t
Where, Qt is the amount of drug release
in time t, Q0 is the initial amount of
drug in the solution and k1 is the first order release rate constant.
Higuchi’s equation: ln Q= kHt1/2
Where, Q is the amount of drug release at time t, and kH is the Higuchi diffusion rate
constant.
Korsmeyer–Peppas equation: Mt/M∞= Ktn
Where, Mt is the amount of drug leased at time t, M∞ is the amount of drug re-leased after infinite time, and K is a kinetic constant incorporating structural and geometric characteristics of the tablet and n is the diffu-sion exponent indicative of the drug release mechanism. The mechanism of drug release was dependent on the value of ‘n’.
Dissolution equivalency
The similarity factor (f2) was employed to evaluate the release profiles of various formula-tions compared with the ideal release profile.
f2= 50 + log {[1+ (1/n) n∑t=1 (Rt-Tt)2]-0.5 *100}
In vitro alcohol dose dumping study
An in vitro study was conducted to evaluate if alcohol had an effect on the release characteris-tics of the test CR formulation and Paxil CR. Testing conditions were used are apparatus II, 150 rpm, 750 mL of 0.1 N hydrochloric acid mixed with 5.0% and 40.0% v/v alcohol at 37°C.
Stability of optimized formulation
For all the pharmaceutical dosage forms it is important to determine the stability of the dos-age form. Stability studies were conducted at different conditions of 40ºC/ 75% RH and 25ºC/ 60% RH for about 3 months in stability chamber (Thermo Lab). Samples were collect-ed at 1, 2 and 3 months intervals.
RESULTS AND DISCUSSION
From the particle size distribution curve the d90 value of the pure drug was 297 microns. Bulk density (g/cm3) and tapped density of pure API were observed to be 0.206± 0.02 and
0.466± 0.009. Carr’s index (%) and Hausner’s
3524 The FTIR of Paroxetine hydrochloride pure
drug stretching’s at 3402.68 cm-1, 1606.26 cm-1, 2954.94 cm-1 corresponding to the functional groups, NH, C=C and C-H bending as shown in Figure 1. The FTIR of drug and excipients shown intense bands at 3403.24 cm-1, 1606.37 cm-1, 2923.51 cm-1 indicates no change in the functional groups NH, C=C and C-H as shown in Figure 2. The FTIR of placebo shown that there are no intense bands at groups NH, C=C and C-H this shows that drug peaks are missing in it as shown in Figure 3. From the above
stretching’s there is no major shifting in the
frequencies of above said functional groups. Drug and polymers are compatible with each other.
As part of In-process test specifications quality control checks like weight variation, thickness, diameter, hardness and friability tests of Parox-etine hydrochloride matrix core tablets were performed. All the In process specifications were fixed stringently to have an advantage at scale up stage. Assay of Paroxetine hydrochlo-ride matrix core tablets prepared as per CCD were in the range of 95.0- 105.0%. In process test specifications for Paroxetine hydrochloride CR matrix core tablets were given in Table 3. For the statistical approach drug release in 60 and 240 minutes were chosen as the dissolution profile impact was more significant and distin-guish at these time points. A response surface methodology (RSM) with central composite design, quadratic process order and manual se-lection were chosen. Utilizing the equation to make predictions about the response for given levels of each factor. The coded equation is useful for identifying the relative impact of the factors by comparing the factor coefficients. In vitro drug release studies for the uncoated CR matrix tablets were done in 1000 mL of pH 7.5 Tris buffer. As the tablets were not coated with delayed release polymer, the acid stage testing was skipped. The data was incorporated in to the software and below are the observa-tions.
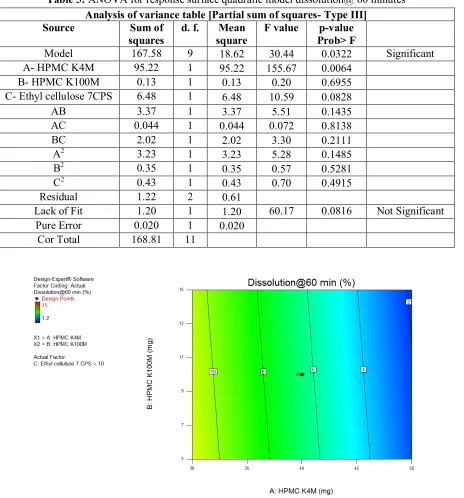
In case of dissolution at 60 minutes time point the model F-value of 30.44 implies the model is significant. There is only a 3.22% chance that an F-value this large could occur due to noise. Values of "Prob> F" less than 0.0500 indicate model terms are significant. In this case A is a significant model term. There is 8.16% chance that a "Lack of Fit F- value" this large could occur due to noise. The "Pred R-Squared" of 0.1407 is not as close to the "Adj R-Squared"
of 0.9601 as one might normally expect i.e. the difference is more than 0.2. All empirical mod-els should be tested by doing confirmation runs. "Adeq Precision" measures the signal to noise ratio. A ratio of 19.329 indicates an adequate signal. This model can be used to navigate the design space. ANOVA data was given in Table 5, contour and response plots were represented in Figures 5& 6.
In case of dissolution at 240 minutes time point the model F-value of 483.88 implies the model is significant. There is only a 0.21% chance that an F-value this large could occur due to noise. Values of "Prob> F" less than 0.0500 indicate model terms are significant. In this case A, C, AB and A2 are significant model terms. Values greater than 0.1000 indicate the model terms are not significant. If there are many insignifi-cant model terms (not counting those required to support hierarchy), model reduction may improve this model. The "Lack of Fit F-value" of 1.50 implies the Lack of Fit is not significant relative to the pure error. There is a 43.59% chance that a "Lack of Fit F-value" this large could occur due to noise. Non-significant lack of fit is good, want the model to fit. ANOVA data was given in Table 6, contour and re-sponse plots were represented in Figures 7& 8. The "Pred R-Squared" of 0.9663 is in reasona-ble agreement with the "Adj R-Squared" of 0.9975 i.e. the difference is less than 0.2. "Adeq Precision" measures the signal to noise ratio. A ratio of 72.053 indicates an adequate signal. This model can be used to navigate the design space.
Mathematical relationship in the form of poly-nomial equation for the measured (release in 60 and 240 minutes) were obtained with the stat- ease software. The polynomial equation relat-ing the different response and independent var-iables are given below:
Dissolution@ 60 minutes= +6.32 4.88 *A -0.18 *B -1.27 *C -1.30*AB +0.15*AC -1.00 *BC +0.73 *A2 -0.24 *B2 -0.27 *C2
Dissolution@ 240 minutes= +22.03 9.19 *A -0.78 *B -3.04 *C -3.09*AB +0.37*AC -0.64 *BC +0.90 *A2 +0.30 *B2 +0.50 *C2
3525 From the response surface plots of 60 and 240
minutes time points, it was observed that with the increase in concentration of HPMC K4M and HPMC K100M the dissolution rate was decreased. In contour and response surface plots ethyl cellulose was taken as actual factor at a concentration of 10 mg. AC & BC interac-tion effects were also shown the same observa-tion and their corresponding contour and re-sponse surface plots were not represented in this paper.
From the optimization part, numerical data as per criteria has shown several solutions. Among those, a solution of HPMC K4M (A): 40 mg, HPMC K100M (B): 10 mg and ethyl cellulose 7CPS (C): 10 mg was shown a
3526 Figure 1: FTIR spectra of pure drug (spectra divided in to two portions)
Figure 2: FTIR spectra of API +Excipients (spectra divided in to two portions)
3527 Table 1: Central composite design
Std Run
Factor 1 A: HPMC K4M
(mg)
Factor 2 B: HPMC K100M
(mg)
Factor 3
C: Ethyl cellulose 7CPS (mg)
3 1 30 15 15
11 2 40 10 10
8 3 40 17.07 10
7 4 40 2.93 10
1 5 50 15 5
9 6 40 10 2.93
6 7 54.14 10 10
2 8 50 5 15
10 9 40 10 17.07
12 10 40 10 10
5 11 25.86 10 10
4 12 30 5 5
Table 2: Formula of preliminary Paroxetine hydrochloride matrix core tablets as per central composite design
Ingredient (mg/tab)
RUN
F1 F2 F3 F4 F5 F6 F7 F8 F9 F10 F11 F12
Paroxetine
hydrochloride* 42.66 42.66 42.66 42.66 42.66 42.66 42.66 42.66 42.66 42.66 42.66 42.66 HPMC K4M 30.00 40.00 40.00 40.00 50.00 40.00 54.14 50.00 40.00 40.00 25.86 30.00 HPMC K100M 15.00 10.00 17.071 2.93 15.00 10.00 10.00 5.00 10.00 10.00 10.00 5.00 Ethyl cellulose 7CPS 15.00 10.00 10.00 10.00 5.00 2.93 10.00 15.00 17.07 10.00 10.00 5.00 Povidone 10.00 10.00 10.00 10.00 10.00 10.00 10.00 10.00 10.00 10.00 10.00 10.00 Spray dried lactose 111.34 111.34 104.27 118.41 101.34 118.41 97.198 101.34 104.27 111.34 125.48 131.34
Aerosil 2.00 2.00 2.00 2.00 2.00 2.00 2.00 2.00 2.00 2.00 2.00 2.00
Magnesium stearate 4.00 4.00 4.00 4.00 4.00 4.00 4.00 4.00 4.00 4.00 4.00 4.00 Total weight (mg) 230.00 230.00 230.00 230.00 230.00 230.00 230.00 230.00 230.00 230.00 230.00 230.00
*Paroxetine hydrochloride 42.66 mg is equal to Paroxetine 37.5 mg (As is basis calculations were included), weights were rounded for convenience
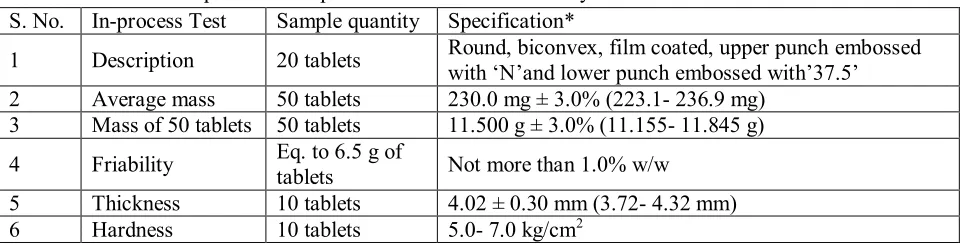
Table 3: In-process test specifications for Paroxetine hydrochloride matrix core tablets S. No. In-process Test Sample quantity Specification*
1 Description 20 tablets Round, biconvex, film coated, upper punch embossed with ‘N’and lower punch embossed with’37.5’ 2 Average mass 50 tablets 230.0 mg ± 3.0% (223.1- 236.9 mg)
3 Mass of 50 tablets 50 tablets 11.500 g ± 3.0% (11.155- 11.845 g) 4 Friability Eq. to 6.5 g of tablets Not more than 1.0% w/w
5 Thickness 10 tablets 4.02 ± 0.30 mm (3.72- 4.32 mm) 6 Hardness 10 tablets 5.0- 7.0 kg/cm2
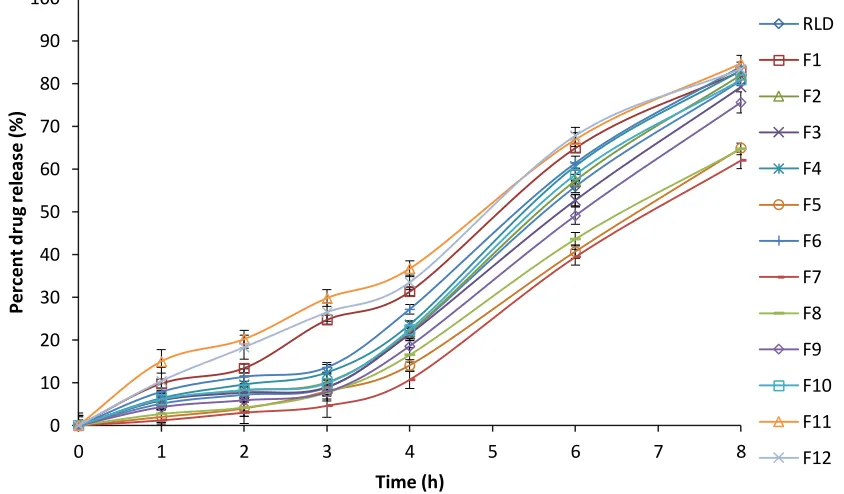
3528 Table 4: In vitro drug release study of Paroxetine hydrochloride matrix core tablets as per central composite design
Figure 4: Percent drug release profile of Paroxetine hydrochloride matrix core tablets prepared as per central composite design
0 10 20 30 40 50 60 70 80 90 100
0 1 2 3 4 5 6 7 8
P
erc
en
t
d
ru
g
rel
e
as
e
(%
)
Time (h)
RLD
F1
F2
F3
F4
F5
F6
F7
F8
F9
F10
F11
F12 Time
(h) RLD F1 F2 F3 F4 F5 F6 F7 F8 F9 F10 F11 F12 % Drug release in buffer stage
0.0 0.0 0.0 0.0 0.0 0.0 0.0 0.0 0.0 0.0 0.0 0.0 0.0 0.0 1.0 ±2.01 5.1 ±1.20 9.8 ±2.35 5.9 ±1.21 5.9 ±2.89 6.4 ±2.31 2.0 ±2.34 7.9 ±2.58 1.2 ±1.96 2.7 ±3.46 4.3 ±2.13 6.1 ±2.75 15.0 ±3.21 10.4
2.0 ±1.45 7.2 ±1.11 13.4 ±2.10 8.2 ±0.97 7.7 ±1.12 9.6 ±1.70 4.0 ±1.98 11.4 ±2.54 3.0 ±2.01 4.2 ±2.48 5.9 ±2.02 8.3 ±2.11 20.2 ±2.78 18.3
3.0 ±1.64 8.9 ±0.96 24.7 ±1.56 10.1 ±1.56 9.0 ±2.01 12.4 ±1.82 8.1 ±1.85 13.6 ±2.63 4.6 ±1.54 7.7 ±2.01 7.8 ±2.34 9.9 ±1.95 29.8 ±2.11 26.5
4.0 ±0.86 21.7 ±0.98 31.3 ±1.89 21.9 ±1.89 21.4 ±1.84 23.6 ±1.12 14.1 ±1.11 27.2 ±2.01 10.7 ±1.67 16.5 ±2.05 18.6 ±2.01 22.4 ±1.85 36.7 ±1.69 33.5
6.0 ±1.24 55.9 ±1.35 64.9 ±1.56 57.3 ±1.56 52.7 ±0.89 60.7 ±1.34 40.7 ±1.08 61.4 ±1.88 39.4 ±1.58 43.6 ±2.00 49.1 ±1.54 58.7 ±1.64 66.9 ±1.98 67.8
3529 Table 5: ANOVA for response surface quadratic model dissolution@ 60 minutes
Analysis of variance table [Partial sum of squares- Type III] Source Sum of
squares
d. f. Mean square
F value p-value Prob> F
Model 167.58 9 18.62 30.44 0.0322 Significant
A- HPMC K4M 95.22 1 95.22 155.67 0.0064
B- HPMC K100M 0.13 1 0.13 0.20 0.6955
C- Ethyl cellulose 7CPS 6.48 1 6.48 10.59 0.0828
AB 3.37 1 3.37 5.51 0.1435
AC 0.044 1 0.044 0.072 0.8138
BC 2.02 1 2.02 3.30 0.2111
A2 3.23 1 3.23 5.28 0.1485
B2 0.35 1 0.35 0.57 0.5281
C2 0.43 1 0.43 0.70 0.4915
Residual 1.22 2 0.61
Lack of Fit 1.20 1 1.20 60.17 0.0816 Not Significant
Pure Error 0.020 1 0.020
Cor Total 168.81 11
3530 Figure 6: Response surface plot showing the effects of the amount of polymer HPMC K4M and HPMC K100M
on drug release at 60 minutes from Paroxetine hydrochloride matrix core tablets Table 6: ANOVA for response surface quadratic model for dissolution@ 240 minutes
Analysis of variance table [Partial sum of squares- Type III] Source Sum of
squares
d. f Mean square
F value p-value Prob> F
Model 680.46 9 75.61 483.88 0.0021 Significant
A- HPMC K4M 338.00 1 338.00 2163.20 0.0005
B- HPMC K100M 2.42 1 2.42 15.49 0.0589
C- Ethyl cellulose 7CPS 36.98 1 36.98 236.67 0.0042
AB 19.10 1 19.10 122.26 0.0081
AC 0.28 1 0.28 1.77 0.3145
BC 0.83 1 0.83 5.28 0.1483
A2 4.86 1 4.86 31.10 0.0307
B2 0.54 1 0.54 3.46 0.2041
C2 1.50 1 1.50 9.60 0.0903
Residual 0.31 2 0.16
Lack of Fit 0.19 1 0.19 1.50 0.4359 Not significant
Pure Error 0.13 1 0.13
3531 Figure 7: Contour plot showing the effects of the amount of polymer HPMC K4M and HPMC
K100M on drug release at 240 minutes from Paroxetine hydrochloride matrix core tablets
Figure 8: Response surface plot showing the effects of the amount of polymer HPMC K4M and HPMC K100M on drug release at 240 minutes from Paroxetine hydrochloride matrix core tablets
Table 7: In vitro drug release study of Acryl-EZE coated Paroxetine hydrochloride CR tablets
Time (h) RLD (6.0% w/w) F13 (7.0% w/w) F14 (8.0% w/w) F15 % Drug release in acid stage
0.0 0.0± 0.0 0.0± 0.0 0.0± 0.0 0.0± 0.0
2.0 0.0± 0.0 0.0± 0.0 0.0± 0.0 0.0± 0.0
% Drug release in buffer stage (acid+buffer)
3.0 4.8± 2.8 6.9± 3.2 5.2± 1.98 3.2± 1.86
4.0 6.4± 2.4 8.2± 2.8 6.5± 2.04 5.6± 1.78
5.0 10.9± 1.9 14.5± 2.9 12.6± 2.01 8.5± 1.93 6.0 20.4± 1.87 25.2± 2.1 22.7± 1.98 15.4± 1.55 8.0 57.2± 1.54 64.1± 1.67 59.7± 1.99 45.3± 1.46 10.0 81.6± 1.67 89.3± 1.73 82.6± 2.04 72.3± 1.88
3532 Figure 9: Percent drug release profile of Paroxetine hydrochloride CR formulations
coated with Acryl-EZE of different weight build ups
Table 8: In vitro release kinetics of Paroxetine hydrochloride CR tablets Trial No. Zero order ‘R2’ First order ‘R2’ Higuchi ‘R2’ Korsmeyer–Peppas‘R2’
Paxil CR 0.8815 0.8226 0.9136 0.9753
F13 0.8947 0.8124 0.9283 0.9715
F14 0.8877 0.8312 0.9242 0.9665
F15 0.8723 0.8159 0.8959 0.9866
Figure 10: Alcohol dose dumping studies for Paxil CR and F14 in 0.1 N hydrochloric acid containing 40.0% alcohol
0 10 20 30 40 50 60 70 80 90 100
0 1 2 3 4 5 6 7 8 9 10
P
erc
en
t
d
ru
g
rel
ea
se
(%
)
Time (h)
RLD
F13 (6.0% w/w)
F14 (7.0% w/w)
F15 (8.0% w/w)
0 10 20 30 40 50 60 70 80 90 100
0 60 120 180 240 300 360
P
e
rc
e
n
t
d
ru
g
rel
e
as
e
(%
)
Time (min)
Paxil CR
3533 All the runs were compared for dissolution
pro-files against the pealed RLD to check the similar-ity factor. Out of the 12 runs, run 2 (F2) has shown higher similarity factor when compared against pealed RLD and the same has been con-firmed with the reproducible run 10 (F10). Nu-merical solution from the software was confirmed by similarity factor. The dissolution profile data and graphs of Paroxetine hydrochloride CR ma-trix core tablets were illustrated in Table 4 and Figure 4. Run 2 (F2) composition was selected for Acryl-EZE coating trials. Acryl-EZE coating weight build ups of 6.0%, 7.0% and 8.0% w/w were given on the run 2 composition and named F13, F14 and F15 respectively. The dissolution profile data and graphs of Paroxetine hydrochlo-ride CR matrix core tablets were illustrated in Table 7 and Figure 9. The release kinetics data were evaluated by applying the equation of zero order, first order, Higuchi and Korsmeyer- Pep-pas equation. The regression coefficient values of different release kinetic equations were evaluated from the dissolution profiles of developed formu-lations and were given in Table 8.
It can be highly postulated that in vitro release profile of all the matrix formulations could be best expressed by the Higuchi model. The plot showed high linearity in comparison to other release kinetic equations. Release of drug from CR matrix tablet generally follows diffusion for water soluble drug and erosion or relaxation for water insoluble drug. Paroxetine hydrochloride is a water soluble drug and follows diffusion mechanism. Formulation F14 was finalized as per the similarity factor and loaded in 40°C/75% RH condition for accelerated
stabil-ity. F14 tablets of 30’s count were filled into
HDPE bottle 75cc/ 33 mm screw neck and loaded for stability as per the sampling re-quirement. Paxil CR bottles were also loaded in to stability chamber to check the stability per-formance. Test and Paxil CR samples were withdrawn at specified time intervals and ob-served for the physico chemical properties. There was no difference in the dissolution pro-file with respect to initial time points and 3 months accelerated stability. Alcohol dose dumping studies were performed to check the effect of alcohol concentration on the release profile. At 5.0% v/v concentration, no drug was release with Paxil CR and F14 formulations. At 40.0% v/v concentration F14 has shown a simi-larity factor of 67.2 with respect to Paxil CR. At the end of 6 hours 71.0% and 80.0% drug release was observed with Paxil CR and F14
formulations respectively. The results from the in vitro alcohol study showed that alcohol in-creased the release of the drug from the formu-lation, but a dose dumping effect per se was not observed. Alcohol dose dumping graphs were given in Figure 10.
CONCLUSION
Response surface methodology with central composite design was used to optimize and evaluate the Paroxetine hydrochloride con-trolled release tablets. Dissolution time points 60 and 240 minutes were shown that the model was highly significant.
Numerical solution
from the software was confirmed by
simi-larity factor.
Selected ranges of HPMC K4M, HPMC K100M and ethyl cellulose 7CPS were found to be significant with respect to release rate. In vitro release profiles of all the Acryl-EZE coated matrix formulations were follow-ing Higuchi model. Paxil CR and F14 samples were shown similarity in dissolution profile at initial and accelerated conditions. A generic Paroxetine hydrochloride CR tablet was devel-oped.ACKNOWLADGEMENTS
The authors are grateful to Natco Pharma, San-ath Nagar, Hyderabad for providing the facili-ties to carry out the research project.
REFERENCES
1. Marks DM, Park MH, Ham BJ, Han C, Patkar AA, Masand PS, Pae CU. Par-oxetine: safety and tolerability issues. Expert Opin Drug Saf. 2008 Nov; 7(6): 783-94.
2. http://www.drugbank.ca/drugs/DB00715 3. https://www.medicines.org.uk/emc/medi
cine/26634
4. Chowdary KPR, Surya Prakasarao K. Individual and combined effects of cy-clodextrins, Poloxamer and PVP on the solubility and dissolution rate of BCS class II drug. Asian J. of Chemistry. 2011; 23(10).
5. Sathyanarayana, Pruthvipathy R, Grego-ry A, Prakash R. Direct compression controlled release tablets using ethyl cel-lulose matrices. Drug Dev. and Ind. Pharm. 2008 Oct; 19(4): 449-460. 6. Chowdary KPR, Surya Prakasarao K.
3534 Prosolve by direct compression method.
Asian J. of Chemistry. 2009; 21(8). 7. Golden RN, Nemeroff CB, McSorley
P, Pitts CD, Dube EM. Efficacy and tol-erability of controlled-release and im-mediate-release paroxetine in the treat-ment of depression. J. of Clin. Psych. 2002 Jul; 63(7): 577-84.
8. Gurvinder SR, Ranjani VN, Ajaz SH, Lloyd GT, Henry JM, Larry LA. Identi-fication of critical formulation and pro-cessing variables for metoprolol tartrate extended-release (ER) matrix tablets. J. of Cont. Release.1999 June; 59(3): 327–
342.
9. Fundamental concepts of controlled lease. Kydonieus AF(ed) Controlled re-lease technologies: methods, theory and applications. CRC, Boca Raton, FL, pp1-19.
10. Colombo P, Bettini R, Santi P, Peppas NA. Swellable matrices for controlled drug delivery: gel-layer behavior, mech-anisms and optimal perfor-mance. Pharm. Sci. Technol. To-day. 2000; 3(6): 198–204.
11. FDA, Guidance for industry- modified release solid oral dosage forms/Scale-up and post approval changes: chemistry, manufacturing, and controls. In vitro dissolution testing and In vivo bioequiv-alence documentation. 1997, 6th Octo-ber.
12. Durriya H, Shoaib MH, Zafar AM, Bushra R, Ismail R, Yousuf, Fahim L. Development of en-teric coated flurbiprofen tablets using Opadry/Acryl-EZE system- A technical note. AAPS PharmSciTech. 2008 Mar; 9(1): 116.
13. http://www.colorcon.com/products
for-mulation/all-products/film coatings/
en-teric-release/Acryl-EZE. Acryl-EZE
Preparation and Use Guidelines,”
tech-nical information, Colorcon Limited, West Point, PA.
14. Rajesh Kumar P, Somashekar S, Gouda MM, Shanta Kumar SM. Development of tablet formulations of enteric coated esomeprazole with Acryl-EZE. Pelagia Res. Library, Der Pharmacia Sinica. 2011; 2(3): 31-42.
15. Ashwini RM, Bhalekar MR, Kolhe VJ, Kenjale KD. Formulation and opti-mization of sustained release tablets of
venlafaxine resonates using response surface methodology. Indian J. of Pharm Sci. 2009 Jul-Aug; 71(4): 387–394. 16. Chowdary KPR, Surya Prakasarao K.
Formulation development of etoricoxib
tablets employing HP β cyclodextrin- Poloxamer 407- PVP K30: A factorial study. Asian J. of Clin. Res.2012; 5(1): 161-164.
17. Gohel MC, Amin AF. Formulation op-timization of controlled release diclo-fenac sodium microspheres using facto-rial design. J. of Cont. Release. 1998 Feb; 51(2-3): 115–122.
18. Chowdary KPR, Surya Prakasarao K. A
factorial study on the effects of HP β
cyclodextrin, Poloxamer 407 and PVP K30 on the solubility and dissolution rate of pioglitazone. Der Pharmacia Let-tre. 2011; 3(5): 146.
19. Peck GE, Johnson AD, Anderson VL. A statistical approach for the development of an oral controlled release matrix tab-let. Pharm. Res.1990; (7): pp.1092–
1097.
20. Korsmeyer RW, Meerwall ED, Peppas NA. Solute and penetrant diffusion in swellable polymers II. Verification of theoretical models. J. Polym. Sci. Polym. Physics.1986; 24: 409–434. 21. Higuchi T. Rate of release of
medica-ments from ointment bases containing drugs in suspension. J. of Pharm. Sci. 1961 Oct; (50): 874-875.