R E S E A R C H A R T I C L E
Open Access
Native fluorescent detection with sequential
injection chromatography for doping
control analysis
Abubakr M Idris
1*and Ahmed O Alnajjar
2Abstract
Background:Sequential injection chromatography (SIC) is a young, ten years old, separation technique. It was proposed with the benefits of reagent-saving, rapid analysis, system miniaturization and simplicity. SIC with UV detection has proven to be efficient mostly for pharmaceutical analysis. In the current study, a stand-alone multi-wavelength fluorescence (FL) detector was coupled to an SIC system. The hyphenation was exploited for developing an SIC-FL method for the separation and quantification of amiloride (AML) and furosemide (FSM) in human urine and tablet formulation.
Results:AML and FSM were detected using excitation maxima at 380 and 270 nm, respectively, and emission maxima at 413 and 470 nm, respectively. The separation was accomplished in less than 2.0 min into a C18 monolithic column (50 × 4.6 nm) with a mobile phase containing 25 mmol/L phosphate buffer (pH 4.0): acetonitrile: (35:65, v/v). The detection limits were found to be 12 and 470 ng/mL for AML and FSM, respectively.
Conclusions:The proposed SIC-FL method features satisfactory sensitivity for AML and FSM in urine samples for the minimum required performance limits recommended by the World Anti-Doping Agency, besides a downscaled consumption of reagents and high rapidity for industrial-scale analysis of pharmaceutical preparations.
Keywords:Sequential injection chromatography, High performance liquid chromatography, Amiloride, Furosemide, Method validation
Background
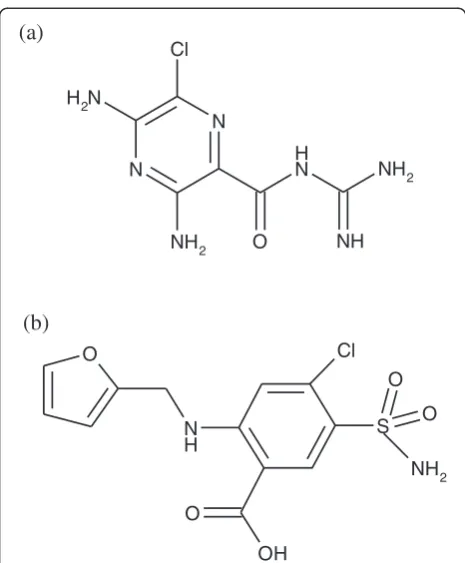
Furosemide (FSM) is a loop diuretic. It is an anthranilic acid derivative, which is chemically 4-chloro-N-furfuryl-5-sulfamoylanthranilic acid (Figure 1a). FSM acts inhibi-ting the co-transportation of sodium, potassium and chloride. It further causes the excretion of calcium, mag-nesium and bicarbonate ions [1,2]. In another context, amiloride (AML) is chemically N-amidino-3,5-diamino-6-chloropyrazine-2-carboxamide (Figure 1b). AML, as another potent loop diuretic, acts primarily by blocking sodium and chloride reabsorption in the ascending limb of the loop of Henle. FSM helps to conserve potassium and minimize the risk of alkalosis. It is also used in the treatment of oedema associated with hepatic cirrhosis and congestive heart failure [3,4].
The association of AML and FSM furnishes a valuable natriuretic agent with a diminished kaliuretic effect and minimizes the risk of alkalosis in the treatment of refrac-tory oedema associated with hepatic cirrhosis or con-gestive heart failure [5]. Due to the benefits of their simultaneous use, AML and FSM are being prepared as binary dosage forms. Accordingly, the development of assay methods for those two drugs is desirable for the purpose of quality control. In this issue, various analyt-ical techniques were exploited including high perform-ance liquid chromatography [4,6,7], spectrophotometry [8-10], fluorometry [2] and electroanalytical [11].
On the other hand, athletes use diuretics, in general, for flushing previously taken prohibited substances with forced diuresis [12] to achieve acute weight loss. Hence, the World Anti-Doping Agency (WADA) prohibits the use of diuretics [13]. Besides being an ethically condemned practice, the risk to the athletes’health has to be consid-ered since they are generally self-administconsid-ered in a wrong * Correspondence:[email protected]
1
Department of Chemistry, College of Science, King Khalid University, P.O. Box 9004, Abha, Saudi Arabia
Full list of author information is available at the end of the article
manner; i.e. overdoses, interactions with other drugs or even the use of drugs of illicit origin [14-16]. Evidently, a sensitive and reliable analytical method to determine di-uretics in urine and/or plasma is a prerequisite in sport ac-tivities. Toward this end, WADA establishes a minimum detection capability for testing methods called the Mini-mum Required Performance Limits (MRPL). This is to en-sure that all doping control laboratories can report the presence of prohibited substances uniformly. The limit for each analyte in the class of diuretics is 250 ng/mL [17,18].
The dominant techniques used for screening diuretics in control urinalysis are GC and HPLC. However, both tech-niques have the limitations of the high cost of instrumen-tation and maintenance. Moreover, other challenges in GC namely are the low volatility of the compounds and the necessity of the additional step of derivatization. HPLC has also the limitation of large consumption of solvent volumes, which is due to the continuous flow of mobile phase and large instrumentation dimension.
Recently, sequential injection chromatography (SIC) was introduced to overcome some challenges in separation techniques [19]. In principle, the procedure of SIC is based on a sequential injection, i.e. a discontinuous-flow ap-proach, of a mobile phase and samples. The separation process is usually carried out into a monolith column using programmable miniaturized modules. The association of the three approaches of the discontinuous-flow approach, monolith separation column and system miniaturization
renders SIC procedure simple, rapid and reagent-saving [20-22]. On the other side, the major limitation of SIC is the limited pressure of the syringe pump. The maximum is 900 psi. This causes back-pressure in separation column and hence limits the use of long separation column and hence reduces the separation capability of many analytes. However, nineteen chromatographic peaks for amino acids were observed in an SIC profile in a previous study [23]. Another limitation of SIC is that the limited volume of the syringe. The commercially available syringe volume is 10 mL, which might not be sufficient for eluting all com-pounds from a separation column. However, this problem could be solved by refilling the syringe.
In the current study, a SIC system was coupled with a fluorescence (FL) detector to provide an analytical method for the separation and quantification of AML and FSM in human urine and pharmaceutical formulation. The cap-abilities of that couple were exploited in terms of reagent-saving, analysis time, sensitivity and selectivity.
Results and discussion
Method optimization
A short monolith column (50 × 4.6 mm) was examined and, initially, it has been found to be sufficient for the separation of the two drugs. With respect to column di-mension, the practicable flow rate of 20–40 μL/s in SIC was tested [24-30]. It is well known that high flow rate accelerates analysis and sharpens peaks. In contrast, high flow rates increases the back-pressure in a separation column. Accordingly, the optimum flow rate set in the current study was 25 μL/s. On the other hand, with re-spect to peak height and peak shape, the practicable range of sample volume is 40–60μL [24-30]. At a large sample volume, peak height was significantly improved while acceptable peak shape was not achieved. Hence, the optimum sample volume has been found to be 30μL.
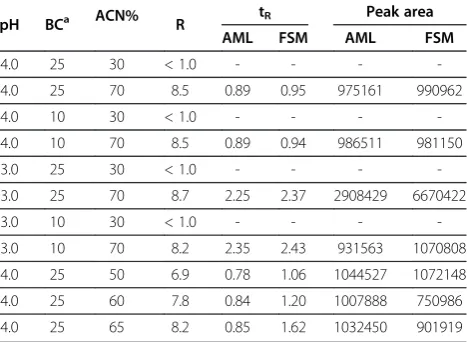
For the optimization of mobile phase composition, acetonitrile, primarily, shows better separation than methanol. Moreover, phosphate buffer was found be es-sential for satisfactory separation. The preliminary study indicated the possible ranges of pH, buffer concentration and the percentage volume of acetonitrile (Table 1). The 23full-factorial design was adopted to screen the effect of those three conditions on resolution, retention time and
N
N H
NH2 N
O NH
N H2
Cl
NH2
(a)
O N H
OH
O Cl
S O
O
NH2
(b)
Figure 1Chemical structures of (a) amiloride and (b) furosemide.
Table 1 Minimum and maximum levels of pH, buffer concentration and percentage volume of acetonitrile adopted for the 23full-factorial design matrix for method
optimization
Condition Minimum Maximum
pH 3.0 4.0
Buffer concentration (mmol/L) 10 25
peak area. UV detection at 380 and 270 nm for AML and FSM, respectively, was adopted for optimization. There-after, the optimum conditions were applied for fluores-cence detection for further studies, namely method validation and application. The results obtained are com-piled in Table 2. More than sufficient separation with a resolution of≥4.5 was obtained at high percentage volume of acetonitrile and different levels of pH and buffer con-centration. At those conditions, the retained FSM was eluted at 0.94 to 2.43 min. Also, relatively, large peak area of both drugs was obtained at those conditions. In con-trast, low percentage volume of acetonitrile, with either high level or low level of pH and buffer concentration, did not exhibit sufficient separation. Table 2 shows the condi-tions and results of three additional experiments, which were carried out with fixing pH and buffer concentration at their high levels. Table 2 shows that the mobile phase composition of 25 mmol/L phosphate: acetonitrile (35:65, v/v) at pH 4.0 achieved more than sufficient separation with a resolution of 8.2 and short retention times of both AML and FSM. Additionally, fully symmetrical peak of AML (1.00) and semi-symmetrical peak of FSM (0.89) were achieved (Figure 2). Eventually, Table 3 presents the optimum instrumental and chemical conditions proposed to the current SIC-FL method.
Method validation
The validation metrics including linearity, recovery and sim-ple and comsim-plex precision as well as the limits of detection and quantitation were determined from measurements.
For linearity studies, samples were prepared using the highest calibrators, namely 100μg/mL AML and 200μg/mL
FSM. Serial dilutions were made to achieve AML con-centrations of: 0.1, 0.5, 1.0, 2.0, 3.0 and 4.0μg/mL; and FSM concentrations of: 2.0, 3.0, 4.0, 6.0, 8.0 and 10.0 μg/mL. Linearity was determined via the least squares linear regression analysis of the data obtained from the average of three replicates from each of the levels described above. A previous spectrofluorimetric method [5] reported linear ranges of 3.7 × 10⁻⁴-0.8 and 1.2 × 10⁻³-4.0 μg/mL for AML and FSM, respectively. Despite these ranges are lower than the corresponding of the current SIC-FL method, the latter are sufficient for drug detection in urine and more suitable for phar-maceutical analysis.
Simple (within-run) precision was evaluated through the analysis of three spiked urine samples, which were run seven times. The first sample included 0.02 AMLμg/ mL and 0.40 FSMμg/mL. The second sample included 0.03 AMLμg/mL and 0.80 FSMμg/mL. The third sample included 0.40 AMLμg/mL and 1.20 FSMμg/mL. The samples were injected into the SIC-FL system after SPE with a preconcentration factor of 5. Mean and RSD were assessed at each level. Complex (between-run) precision for the method was determined through the analysis of the aforementioned samples injected once per day for five days. Once again, mean and RSD were evaluated. In general, Table 4 shows acceptable precision, at its two levels simple and complex, for both AML and FSM quantification.
The LOD was determined at a signal-to-noise ratio of 3 whereas the LOQ was determined at a signal-to-noise ratio of 10. The noise was assessed using drug-free hu-man urine samples after SPE. Interestingly, the LOQs of AML and FSM (Table 4) achieved from the current SIC-FL match the MRPL that was recommended by WADA [17,18]. A previous HPLC screening test was presented for some diuretics of doping interest in human urine [16]. In that method, the LOD for AML and FSM were 0.750 and 0.125 μg/mL, respectively. These levels are not in consistence with the current SIC-FL method. This could be attributed to the use of liquid-liquid extraction for sample treatment and UV for the detection in the previous HPLC method [16] while SPE and fluorescence detection were used in the current SIC method.
Method application
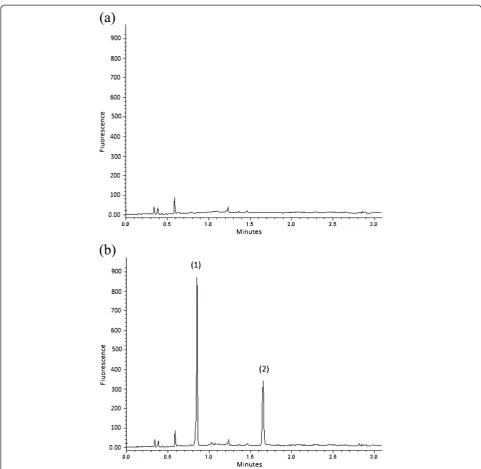
The proposed SIC-FL method was applied to four urine samples. All samples were subjected to SPE. One sample was free from AML and FSM in order to examine the efficiency of SPE for sample clean-up and to calculate the LODs and LOQs. The chromatogram of one sample as an example is depicted in Figure 2a. Acceptable base-line was obtained indicating acceptable efficiency of the sample clean-up step in the adopted SPE procedure [31]. The other samples were spiked with different quantities Table 2 23full-factorial design matrixaand further
experimentsbfor screening the effect of pH buffer concentration and percentage volume of acetonitrile on resolution (R), retention time (tR, min) and peak area
pH BCa ACN% R tR Peak area
AML FSM AML FSM
4.0 25 30 < 1.0 - - -
-4.0 25 70 8.5 0.89 0.95 975161 990962
4.0 10 30 < 1.0 - - -
-4.0 10 70 8.5 0.89 0.94 986511 981150
3.0 25 30 < 1.0 - - -
-3.0 25 70 8.7 2.25 2.37 2908429 6670422
3.0 10 30 < 1.0 - - -
-3.0 10 70 8.2 2.35 2.43 931563 1070808
4.0 25 50 6.9 0.78 1.06 1044527 1072148
4.0 25 60 7.8 0.84 1.20 1007888 750986
4.0 25 65 8.2 0.85 1.62 1032450 901919
a
the first eight rows compile the 23
full-factorial design matrix;b
of AML and FSM as described in the subsection entitled
“Method validation”. As an example, Figure 2b shows the chromatogram of 3.0 μg/mL AML and FSM in a urine sample. The pre-concentration factor obtained from SPE was 5. Hence, the level of AML and FSM injected into the SIC-FL system was 0.6 μg/mL. The recovery obtained (Table 4) was acceptable indicating the accuracy of the SPE procedure [31] and the proposed SIC-FL method.
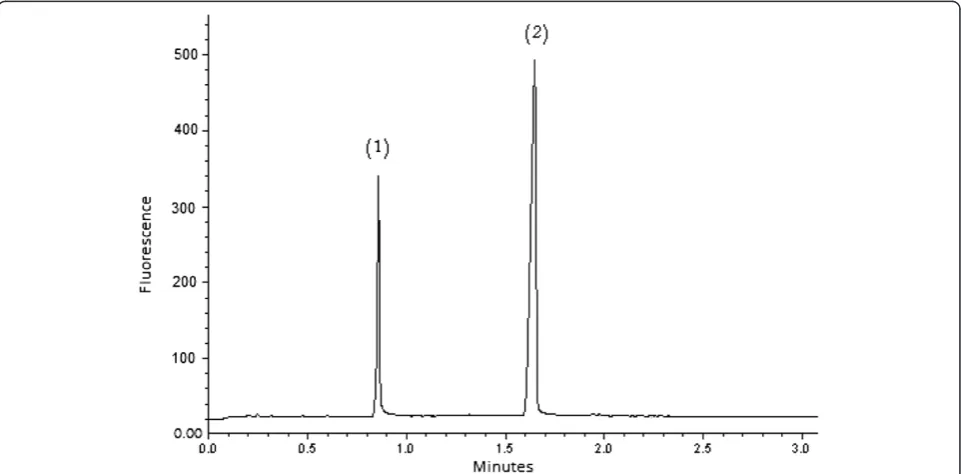
The SIC-FL method was also applied to tablet formu-lation using three levels of AML and FSM as discussed in the section entitled“Preparation of reagents and sam-ples”. As an example, Figure 3 shows an SIC profile of Figure 2SIC profiles following fluorescence of: (a) urine sample after solid-phase extraction and (b) urine sample spiked with (1) amiloride and (2) furosemide to get concentration of 3.0μg/mL of each drug.
Table 3 Optimal analytical conditions of the SIC-FL method
Analytical character AML FSM
Separation column (50 × 4.6 mm)
Mobile phase composition 25 mm phosphate : acetonitrile (35:65 v/v, pH 4.0)
Sample volume (μL) 30
Flow rate (μL/s) 25
Excitation wavelength (nm) 380 270
0.5 μg/mL AML and 4.0 μg/mL FSM extracted from Frumil® Tablets. In general, the chromatograms obtained indicate the applicability of the SIC-FL method to the separation and quantification of AML and FSM to both urine samples and tablet formulation.
Unique SIC analytical features
One of the interesting advantages of the proposed SIC-FL method over HPLC methods is mainly the reagent-consumption. The total volume of the consumed re-agent, i.e. mobile phase for column conditioning and separation, was 4.5 mL. Hence, in routine analysis, SIC consumes milliters per day versus centiliters per day for HPLC. As previously mentioned, the reduction of re-agent consumption in SIC is due to the discontinuous-flow, downscaled-dimension of instrumentation and the use of monolithic column. Accordingly, the waste pro-duction of SIC is less than that of HPLC and hence the frontal is greener than the latter. On the other side, the use of monolithic column and the miniaturization of SIC work hand in hand to provide a rapid analysis. The total analysis time including column conditioning and elution, without SPE, was 4.7 min. Hence, the sample frequency was 13 samples/h. Furthermore, the instru-mentation simplicity of SIC offers less instruinstru-mentation cost. In addition, the simplicity in SIC instrumentation makes its maintenance cost less.
Experimental
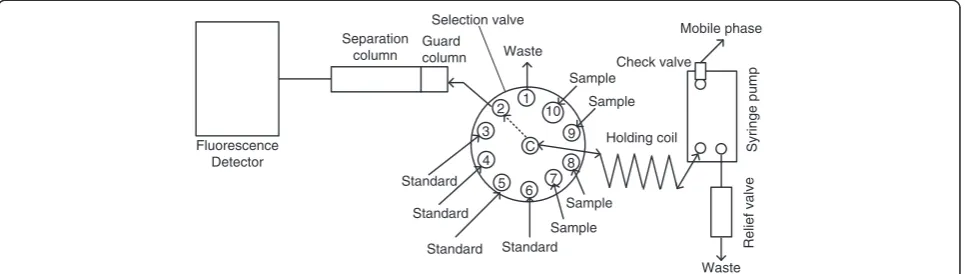
Instrumentation
The SIC system used in the current study was SIChrom®. It was assembled by FIALab® (Medina, WA US). The SIC system (Figure 4) included syringe pump (SP), selec-tion valve (SV), and tubings. The SV was 10 T-0179H Cheminert® high-pressure stainless-steel (up to 5000 psi) with 10 ports. It was manufactured by Valco Instrument Co. (Houston, TX, US). The SP was S17 PDP® with a Table 4 Validation metrics results of the SIC-FL method
Analytical character Result
Resolution 8.2
Consumed mobile phase
volume (mL) 4.5
Total analysis time (min) 4.7
Sample frequency (samples/h) 13
AML FSM
Retention time (min) 0.85 1.62
Peak symmetry 1.00 0.89
Theoretical plates 671.55 937.95
Regression equation PAa= 1.6387Cb+ 566.28
PAa= 26.667Cb+ 23.333
Correlation coefficient 0.9971 0.9987
Linear range (μg/mL) 0.1-4.0 2.0-10.0 Within-run precision (RSD, %) 1.98 2.02 Between-run precision (RSD, %) 0.57 2.81
Recovery in urine samples (%) 89 91
Recovery in tablets (%) 99.1 for 1.0μg/mL 98.7 for 8.0μg/mL 97.5 for 0.5μg/mL 98.1 for 4.0μg/mL 97.0 for 0.5μg/mL 96.5 for 0.5μg/mL
LOD (μg/mL) 0.012 0.470
LOQ (μg/mL) 0.060 1.500
a
peak area;bconcentration (μg/mL)
reservoir of 4 mL. It was manufactured by Sapphire En-gineering (Pocasset, MA, US). Pump tubing of 0.03" I.D. Teflon type was supplied from Upchurch Scientific, Inc. (Oak Harbor, WA, USA). It was used to connect various devices of the SIC manifold and to make a holing coil (200 cm long). (vi) PC equipped with FIALab Software® for Windows® version 5.9 was supplied from FIAlab (Medina, WA, USA).
The detector was 2475 Multi λ Florescence Detector from Waters (Milford, CT, US). The light source was a xenon lamb with excitation wavelength in the range of 200–900 nm. The detector was equipped with excitation and emission monochromators.
The solid phase extraction (SPE) columns of 6-mL size, which were used for urine sample treatment, were Discovery DSC-18. They were supplied by Supleco (Bellefonte, PA, US).
Chemicals, reagents and samples
Double-distilled deionized water was used throughout the experimental work. All chemicals and reagents were of analytical reagent grade. AML hydrochloride hydrate, FSM, acetonitrile, sodium hydrogen phosphate, ortho-phosphoric acid were purchased from Sigma-Aldrich (Taufkirchen, Germany).
Preparation of reagents and samples
100 μg/mL of AML and 200 μg/mL of FSM as stock standard solutions were prepared by dissolving appropri-ate amounts in mobile phase. Working standard solu-tions were prepared by dilution in an appropriate way.
10 mL of urine samples were obtained from eight healthy volunteers. All samples were filtered through Whatman® paper No 1. Two samples were then subjected directly to SPE without spiking drugs. The other samples were spiked in duplicate with three concentrations of each drug as described in the subsection entitled“Method val-idation”. Thereafter, the three replicate samples were
subjected to SPE. 2.5 mL of urine were cleaned through the SPE columns by 3 mL of water and eluted with 2 mL of methanol. The methanolic extract was evaporated to dryness under nitrogen stream and reconstituted in 2 mL mobile phase. Blank urine was treated in same manner [31].
Frumil® tablets (5 mg of AML hydrochloride and 40 mg of FSM), which were prepared by Sanofi-Aventis (Dublin, Ireland), were examined. Twenty tablets were accurately weighed and finely powdered. Three portions were accurately weighed and transferred into 100-mL calibrated flasks. The first portion was equivalent to 5 mg of AML and 40 mg of FSM. The second portion was equivalent to 2.5 mg of AML and 20 mg of FSM. The third portion was equivalent to 1.25 mg of AML and 10 mg of FSM. The drugs were extracted by the mo-bile phase with shaking and filtration. The solutions were diluted fifty-times. The recovery in tablet formula-tion was examined using a previous HPLC method as a reference [4].
SIC procedure
A rapid protocol controlling the proposed SIC proced-ure was programmed. 1.0 mL of the mobile phase was aspirated through the check valve in the syringe pump at a flow rate of 150μL/s. For column conditioning, the mobile phase was introduced into the separation column through port-2 and the guard column (Figure 4) at a flow rate of 30 μL/s. The syringe was filled again with 3500 μL of the mobile phase at a flow rate of 150μL/s. 30μL of standards/samples were loaded into the holding coil through port-3 to port-10 at a flow rate of 10μL/s. The sample and mobile phase were then injected into the guard and separation columns through port-2 at a flow rate of 25 μL/s. During this step, the fluorescence detector was set at excitation and emission wavelengths as presented in Table 3.
7 5 4 3 2
6 1
8 Selection valve
Syringe
pump
Holding coil C
Guard column Separation
column
Standard Standard
Sample
Mobile phase
Waste
Relief
valve
Waste
Standard
9 10
Check valve
Standard
Sample
Sample
Sample Fluorescence
Detector
Conclusions
A fluorescence detector was hyphenated to an SIC sys-tem to generate a sensitive and direct method for the separation and quantification of AML and FSM. The hy-phenation also permitted a simple, inexpensive, rapid and reagent-saving procedure. The SIC-FL method was validated and it demonstrated to be reliable for the de-termination of both drugs, being linear, accurate and precise. Therefore, the SIC-FL method can be consid-ered suitable for the quantification of both drugs in hu-man urine samples. The SIC-FL method is also thought to be ideally suited for a rapid routine analysis for the quality control of pharmaceutical products.
Competing interests
The authors declare that they have no competing interests.
Authors' contributions
AMI proposed the design of the study and drafted the manuscript. AOA carried out the hyphenation of SIC-FL and other bench-works. Both authors read and approved the final manuscript.
Authors’information
Dr. Abubakr M. Idris is a Sudanese associate professor of analytical chemistry at the Department of Chemistry, College of Science, King Khalid University, Abha, Saudi Arabia. Idris has authored more than sixty-five papers and books published in international refereed journals and conferences. His research focuses on developing microfluidic analytical technologies and their methodologies. He has some publications on environmental issues as well. Idris joints the editorial board of American Journal of Analytical Chemistry, Development in Analytical Chemistry and Novus Scientia Journals. He also gained awards for funding more than fifteen research projects from various institutes. On the other hand, Idris has many activities on the issues of academic development and quality. He is currently the chairman of the Unit of Academic Development and Quality, College of Science, King Khalid University.
Acknowledgments
This work was supported by the grant from King Abdulaziz City for Science and Technology (KACST), Riyadh, Saudi Arabia, award number M-T-5-8. The financial contribution is gratefully acknowledged. Dr. Idris thanks the Department of Chemistry, College of Science, King Khalid University for encouraging him to join the KACST Research Team at. Dr. Alnajjar also thanks the Department of Chemistry, College of Science, King Faisal University for allowing them to conduct this research in their laboratories.
Author details
1Department of Chemistry, College of Science, King Khalid University, P.O. Box 9004, Abha, Saudi Arabia.2Department of Chemistry, College of Science, King Faisal University, Hofuf, Saudi Arabia.
Received: 16 April 2013 Accepted: 5 July 2013 Published: 28 August 2013
References
1. Foye WO, Lemke TL, Williams DA:Principles of Medicinal Chemistry.4th edition. USA: Williams and Wilkins; 1995:405.
2. Peraltac CM, Fernandeza LP, Masi AN:A novel application of immobilization on membranes for the separation and spectrofluorimetric quantification of amiloride and furosemide in pharmaceutical samples.Anal Chim Acta2010,661(1):85–90. 3. Tripathi KD:The Kidney and Hypertension. In Essential of Medical
Pharmacology.5th edition. New Delhi: Jaypee Brothers Medical Publishers; 2003:605.
4. Nagori BP, Solanki R:RP-HPLC method for simultaneous estimation of frusemide and amiloride hydrochloride in tablet formulation.
Indian J Pharm Sci2010,72(3):384–387.
5. Peralta CM, Fernandez LP, Masi AN:Solid phase extraction using nylon membranes with fluorescence detection as a fast and sensitive method for Amiloride and Furosemide determination in urine samples.
Microchem J2011,98(1):39–43.
6. Domingo EB, Hernandez MJM, Ramos GR, Alvarez-Coque MCG:Evaluation of diuretics in pharmaceuticals by high-performance liquid
chromatography with a 0.05 mol dm−3 sodium dodecyl sulfate-3% propanol mobile phase.Analyst1992,117(5):843–847.
7. Argekar AP, Raj SV, Kapadia SU:Simultaneous determination of amiloride hydrochloride and frusemide in pharmaceutical preparations by HPTLC.
Indian Drugs1995,32(4):166–171.
8. Erram SV, Tipnis HP:Simple spectrometric analysis of frusemide and amiloride hydrochloride from combined pharmaceutical dosages.Indian Drugs1993,30(8):371–376.
9. Ferraro MCF, Castellano PM, Kaufman TS:A spectrophotometric-partial least squares (PLS-1) method for the simultaneous determination of furosemide and amiloride hydrochloride in pharmaceutical formulations.
J Pharm Biomed Anal2001,26(3):443–451.
10. Ines Toral M, Pope S, Quintanilla S, Richter P:Simultaneous determination of amiloride and furosemide in pharmaceutical formulations by first digital derivative spectrophotometry.Int J Pharm2002,249(1–2):117–126. 11. Begona Barroso M, Alonso RM, Jimenez RM:Electrochemical
determination of the loop diuretics piretanide and furosemide in pharmaceutical formulations and urine.Anal Chim Acta1995, 305(1–3):332–339.
12. Delbeke FT, Debackere M:The influence of diuretics on the excretion and metabolism of doping agents part IV–caffeine.Biopharm Drug Dispos
1988,9(2):137–145.
13. The world anti-doping code, the 2008 prohibited list, WADA (world anti-doping agency), Montreal; 2008. http://www.wada-ama.org/en/.
14. Segura J:Doping control in sports medicine.Ther Drug Monit1996, 18(4):471–476.
15. Verroken M:Drug use and abuse in sport.Baillieres Best Pract Res Clin Endocrinol Metab2000,14(1):1–23.
16. Moreira V, Moreau RLM:Liquid chromatographic screening test for some diuretics of doping interest in human urine.J Liq Chromatogr Relat Technol2005,28(17):2753–2768.
17. WADA Technical Document–TD2004MRPL:Minimum required performance limits for detection of prohibited substances; 2004.
18. Morra V, Davit P, Capra P, Vincenti M, Di Stilo A, Botre F:Fast gas chromatographic/mass spectrometric determination of diuretics and masking agents in human urine. Development and validation of a productive screening protocol for antidoping analysis.J Chromatogr A
2006,1135(2):219–229.
19. Satinsky D, Solich P, Chocholous P, Karlicek R:Monolithic columns-a new concept of separation in the sequential injection.Anal Chim Acta2003, 499(1–2):205–214.
20. Idris AM:Overview of generations and recent versions of flow injection techniques.Crit Rev Anal Chem2010,40(3):150–158.
21. Idris AM:Flow injection, overlooked techniques in forensic analysis.Crit Rev Anal Chem2010,40(4):218–225.
22. Chocholous P, Solich P, Satinsky D:An overview of sequential injection chromatography.Anal Chim Acta2007,600(1–2):129–135.
23. Rigobello-Masini M, Masini JC:Improvements in the separation capabilities of sequential injection chromatography: determination of intracellular dissolved free amino acid profiles in three taxonomic groups of microalgae.Phytochem Anal2013,24(3):224–229. 24. Idris AM, Elgorashe REE:Sequential injection chromatography for
separation and quantification of chlorpromazine in human urine and pharmaceutical formulations.J AOAC Int2013,96(2):282–289(8). 25. Idris AM:Sequential injection chromatography for biofluidic analysis:
application to promethazine assay.J Liq Chromatogr Relat Technol2012, 35(20):2884–2899.
26. Idris AM, Naheid SA, Elgorashe REE, Alanajjar AO, Eltayeb MAH: Multi-response optimization of sequential injection chromatographic method for simultaneous determination of lisinopril and hydrochlorothiazide.
Analytical Methods2012,4(7):2081–2087.
27. Idris AM, Elgorashe REE:Sequential injection chromatography with a miniaturized multi-channel fiber optic detector for separation and quantification of propranolol and hydrochlorothiazide.Chem Cent J
28. Idris AM, Naheid SA, Eltayeb MAH, Elgorashe REE, Al-Akra HN: Reversed-phase sequential injection liquid chromatographic method for sildenafil assay.J Liq Chromatogr Relat Technol2011,34(19):2256–2270.
29. Idris AM, Elgorashe REE:Sequential injection chromatography against HPLC and CE: Application to separation and quantification of amoxicillin and clavulanic acid.Microchem J2011,99(2):174–179.
30. Idris AM, Elgorashe REE, Assubaie FN, Alnajjar AO:Inexpensive green method for diclofenac assay utilizing sequential injection chromatography.Chromatographia2011,73(5–6):431–437.
31. Thieme D, Grosse J, Lang R, Mueller RK, Wahl A:Screening, confirmation and quantitation of diuretics in urine for doping control analysis by high-performance liquid chromatography-atmospheric pressure ionisation tandem mass spectrometry.J Chromatogr B2001,757(1):49–57.
doi:10.1186/1752-153X-7-144
Cite this article as:Idris and Alnajjar:Native fluorescent detection with sequential injection chromatography for doping control analysis. Chemistry Central Journal20137:144.
Open access provides opportunities to our colleagues in other parts of the globe, by allowing
anyone to view the content free of charge.
Publish with
Chemistry
Central and every
scientist can read your work free of charge
W. Jeffery Hurst, The Hershey Company.
available free of charge to the entire scientific community peer reviewed and published immediately upon acceptance cited in PubMed and archived on PubMed Central yours you keep the copyright
Submit your manuscript here: