Published online November 20, 2013 (http://www.sciencepublishinggroup.com/j/jeee) doi: 10.11648/j.jeee.20130104.17
Objective image quality evaluation model for JPEG2000
coded images based on edge information measures
Z. M. Parvez Sazzad
1, Rayeen Sultana
1, Hajera Siddiqa
1, Manika Rani Dey
21Dept. of Applied Physics, Electronics and Communication Engineering, University of Dhaka, Dhaka-1000, Bangladesh
2Department of Information and Communication Technology, Mawlana Bhasani Science and Technology University, Tangail, Bangladesh
Email address:
[email protected](Z. M. P. Sazzad), [email protected](R. Sultana), [email protected](H. Siddiqa), [email protected](M. R. Dey)
To cite this article:
Z. M. Parvez Sazzad, Rayeen Sultana, Hajera Siddiqa, Manika Rani Dey. Objective Image Quality Evaluation Model for JPEG2000 Coded Images Based on Edge Information Measures. Journal of Electrical and Electronic Engineering. Vol. 1, No. 4, 2013, pp. 101-106. doi: 10.11648/j.jeee.20130104.17
Abstract:
In this paper, a no-reference objective quality assessment model is proposed for JPEG2000 coded images. It is well established that human visual system is very sensitive to edge information; consequently we believe that perceptual artifacts of any image are strongly dependent on local features such as edge and non-edge areas. Therefore edge and non-edge area based distortions are evaluated in this model. Performance of the model is evaluated by using the subjective experiment results of the LIVE Texas’s database. The performance is also compared with other existing methods and the result is inevitably sufficient.Keywords:
JPEG2000, MOS, Edge, Zero-crossing, Segmentation1. Introduction
People have been eager to understand how the human vision system responds to the visual world for a long time. Among many vision functions, comparison is a natural capability that everyone takes for granted. With this ability, people can notice the differences between two similar images. But teaching a computer to perceive the differences in a human manner is frustrating. There are several reasons that limited success has been achieved [1]. Storing image digitally has been practiced for many years. Digital images have opened the door to many applications previously unimaginable, as data, video, images and voice information may all be transmitted simultaneously. A link previously capable of transmitting only alphanumeric data now becomes capable of transmitting all the other media too, hence the name multimedia [2], [3]. The capacity to transmit multimedia data has brought with it requirements for real-time transmission, higher image quality, and all this over lower bandwidth links. Due to the advanced development of different image compression techniques and processing systems, there is a very big concern about the image quality levels both for users and providers in many application of image processing from compression to printing. Obviously, in these applications digital images
principal component analysis is performed on edge points, beforehand classified as distorted or not, in order to measure both of blurring and ringing effects and also the combination of spatial ringing and blurring measures are presented in [9]. In [10] an NR algorithm is proposed that measure several distortions and ringing artifact (anisotropic diffusion). However, the results were reported on the individual distortion measure for only one image without comparison of the subjective quality. In [11], a method is proposed to measure distortion and then quantifies the amount of distortions. Saad et al. [12] presented a blind image quality index based on statistics of local DCT coefficients. In [13] an image quality assessment for JPEG2000 coded images was proposed based on pixel distortion and edge information measure. In [14] a Kurtosis-based NR image quality assessment is proposed which predicts that kurtosis of DCT coefficients increases with increased blurring.
It is well established that the human visual system (HVS) is very sensitive to edge information of images. In this paper an objective no-reference (NR) image quality assessment model is proposed for JPEG2000 coded images based on edge information measures.
2. Proposed Model
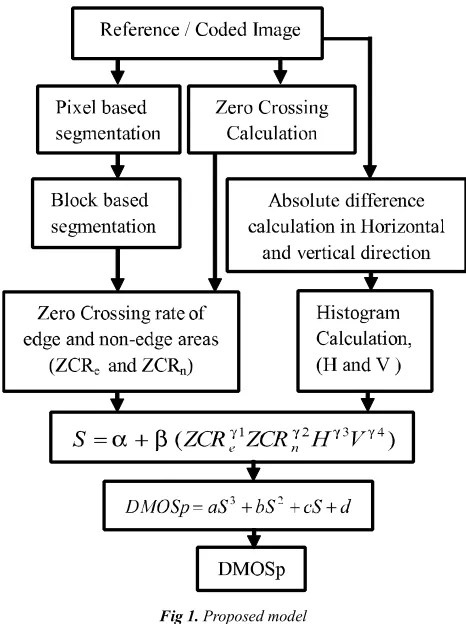
The model is proposed mainly for JPEG2000 coded images and the features are calculated in a spatial domain.A previous instantiation of this approach was made in [13], and the results were promising though the number of parameters was large which increases the complexity of the algorithm. In this paper, the algorithm is simpler as the number of parameters is less than that of the previous work. The obtained results are sufficient. The block diagram of the model is shown in Fig. 1. For simplicity, only the luminance component is considered to make quality prediction of the color images, though this should not be considered generally true for color image quality assessment. In this model the original images are first segmented into edge and non-edge blocks using the block based segmentation algorithm [15]. For edge information measure, the zero crossing rate of edge and non-edge areas are calculated and then the histogram measure is evaluated both for horizontal and vertical direction. Finally, the features are combined by a features combined equation to get the quality prediction score.
2.1. Block Based Segmentation
In this work, a simple block-based segmentation algorithm which is proposed in [15] is used to classify the edge and non-edge areas of an image. At first, a simple pixel classification algorithm is employed to classify every pixel of the image into either edge or non-edge pixel is established. Initially, standard deviation (STD) of each pixel is estimated within its 3×3 and 5×5 neighborhood pixels. For all corner pixels, extra rows (upper and lower two rows) and columns (left and right two columns) are introduced and zero values are padded for the unavailable pixels for the STD measure.
Let STD3×3(m, n), and STD5×5(m, n) be the standard deviated images of 3×3 and 5×5 neighborhoods, respectively.
Fig 1. Proposed model
Standard deviated image means its every pixel value came from STD of 3×3 or 5×5 neighborhood pixels of the reference image. We then calculate absolute difference,
) , (m n
Da by the following equation:
| ) , ( )
, ( | ) ,
(m n STD33 m n STD55 m n
Da = × − × (1)
where m = 1, 2,....M and N = 1, 2,....N. Here, M and N are the total number of rows and columns. Subsequently, we calculate STD ofDa(m,n) by
∑
×=
−
×
=
M Ni
ai
a
D
D
N
M
D
1
2
)
(
1
(2)
We then use the following algorithm to classify edge and non-edge pixels of the image:
≥
=
otherwise nonedge
D n m D if edge n
m
P a
) (
0
) , ( )
( 1 ) ,
( (3)
where “1” and “0” denote edge and non-edge pixels respectively. Secondly, we classify each block (8×8) of the image into either edge or non-edge block by using the following segmentation algorithm.
The block-based segmentation algorithm:
n
e n
n
where neand nnare respectively the number of edge, and non-edge pixels per (8×8) block. Therefore, the “Sum” is the total number of pixels per block.
If
> e e th sum
n then the block is “edge” else the block is
“non-edge” where “the” is the algorithmic threshold. The value of the threshold is 0.13 which is estimated empirically.
2.2. Edge Information Measure
Edge information is estimated using two features, zero crossing rate and histogram measures.
2.2.1. Zero-Crossing Rate Measure
Zero-crossing (ZC) rate is estimated in both horizontal and vertical directions of the image.
For horizontal direction: Since the test image signal is
)
,
(
m
n
x
form
∈
[
1
,
M
]
and, n∈[1,N]. A differencing signal along each horizontal line is calculated by:) 5 ( ) , ( ) 1 , ( ) ,
(m n x m n x m n
dh = + −
] 1 , 1 [ − ∈ N
n and m∈[1,M ]
For the horizontal zero-crossing (ZC):
< − > = − otherwise n m d if n m d if n m d h h sign h 0 0 ) , ( 1 0 ) , ( 1 ) ,
( (6)
)
1
,
(
)
,
(
×
+
=
− −−
d
m
n
d
m
n
d
h mul h sign h sign (7)We define for n∈[1,N −2]:
< = − otherwise d if n m
Zh h mul
0
1 1
) ,
( (8)
where the size of Zh(m,n) is M × (N − 2). Similarly the vertical Zero Crossing Zv(m,n)is estimated, where the differencing along each vertical line is calculated by the following equation:
( , ) ( 1, ) ( , )
v
d m n =x m+ n −x m n (9)
The overall zero-crossing (ZC), is then evaluated by performing logical OR operation between Zh(m,n) and
) , (m n Zv :
( , ) h( , ) v( , )
Z C m n = Z m n ∨ Z m n (10)
Finally the zero-crossing rate (ZCR) of each 8×8 block,
b
ZCR is calculated by:
8 8 1 1 1 ( , ) 64 b i j
Z C R ZC i j
= =
=
∑ ∑
(11)Consequently, the average zero-crossing rate for edge, and non-edge areas of the image are calculated by:
1
1 Ne
e b
e b
ZCR ZCR
N =
=
∑
(12)1
1 Nn
n b
n b
ZCR ZCR
N =
=
∑
(13)where Ne, and Nn are respectively the number of edge, and
non-edge blocks of the image.
2.2.2. Histogram Measure
The second edge information measure is the histogram measure. In this process an absolute differences calculations are estimated between two neighborhood pixels separately in horizontal and vertical directions by the following equations: ] 1 , 1 [ |, ) , ( ) 1 , ( | ) ,
(m n = x mn+ −x mn n∈ N−
Dh (14)
] 1 , 1 [ |, ) , ( ) , 1 ( | ) ,
(m n = x m+ n −xm n m∈ M −
Dv (15)
where the image signal is
x
(
m
,
n
)
for m∈[1,M] and ], 1
[ N
n∈ . The absolute difference value (ADV) of edge and texture pixels are increased and diverged to high level range of horizontal scale of the histogram. Therefore, considering only low level horizontal scale value of the histogram gives relatively more insight into the edge information of the image. We consider the histogram values of horizontal scale level of 0, 1 and 2. Let h0, h1, and h2 respectively be the number of absolute difference amplitude pixels that lied on position 0, 1 and 2 on the histogram and also let V and H be
the horizontal and vertical histogram features, respectively, of the image of size M × N, then the horizontal histogram feature can be estimated as follows:
( 0 1 2) ( )
h h h H
M N
+ + =
× (16)
Similarly, the vertical histogram feature, V is calculated by the following equation:
( 0 1 2 )
( )
v v v V
M N
+ +
=
× (17)
2.3. Features Combination
There are many different ways to combine the spatial features to constitute a quality assessment model. One method that gives good prediction performance is given by the following equation:
)
(
γ1 γ2 γ3 γ4β
α
ZCR
ZCR
H
V
S
=
+
e n (18)3 2
DMOSp=aS +bS + +cS d (19)
where a,b,c,d are the parameters of the logistic function.
3. Results
In order to verify the performance of the proposed model, JPEG2000 coded images of LIVE database (DMOS scale, 1-100) is considered [18]. There are 227 JPEG2000 coded images in the database. To use the database, we randomly divide the database into two parts for training and testing and also there is no overlapping between training and testing. The proposed model’s parameters are optimized with the training images by using PSO algorithm. The parameters are summarized in Table 1. The parameters of the logistic function are also estimated using the PSO algorithm. The obtained parameters of the logistic function are
84746 . 8 , 442981 . 9 , 207297 .
0 = =−
= b c
a and
862328 . 2
=
d
Table 1. Model parameters.
α = -2.20391 β =12.6351 γ1=0.948758
2
γ =1.128848 γ3=0.592983 γ4=0.059937
Table 2. Performance evaluation of our proposed model.
Proposed model
Training(113 images)
CC AAE RMSE SROCC 0.938 6.649 8.383 0.916
Testing (114 images) 0.933 7.085 9.083 0.931
Table 3.Performance comparison of our proposed model with other models.
Proposed model, NR
All images (227 images) (Train + Test)
CC AAE RMSE SROCC 0.935 6.87 8.74 0.928 Zhang et al., NR [14] 0.920 N/A 10.00 0.910 Sheikh et al., NR [7] 0.930 8.05 N/A N/A Marziliano et al., [6] 0.850 N/A N/A N/A
In order to provide quantitative measures on the performance of our proposed NR quality assessment model, we followed the standard performance evaluation procedures employed in the video quality experts group (VQEG) FR-TV Phase II test [19], where mainly Pearson linear correlation coefficient (CC), average absolute error (AAE), root mean square error (RMSE), and Spearman Rank order correlation coefficient (SROCC) between objective (predicted, DMOSP) and subjective scores (DMOS)
were used for evaluation. The evaluation result of the proposed model (JPEG2000, NR) is summarized in Table 2.
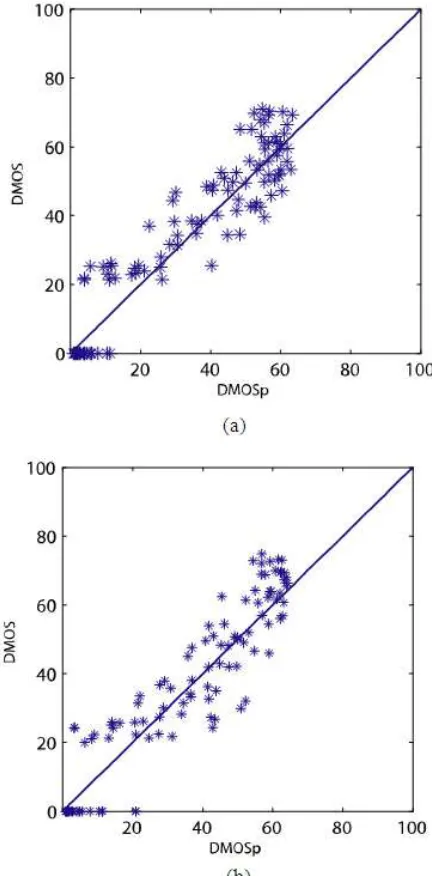
It is observed from Table 2 that the proposed model’s performance is sufficient for every one of the evaluation metrics both for the training and the testing datasets. It has also been observed from the Table 2 that the proposed method provides sufficient prediction accuracy (higher CC, lower AAE, and RMSE), and sufficient prediction monotonicity (higher SROCC). The DMOS versus DMOSp prediction performances of the proposed model for training and testing images are respectively shown in Figures 2(a) and 2(b). The figures also show that the model’s performance are sufficient both for train and test images.
Fig 2. Proposed model’s performance on (a) Train images; (b) Test images.
(because researchers have no information about the reference image) compared to FR evaluation and also difficult to estimate DMOSp within confidential interval of DMOS scores, our proposed NR model performances are better for almost every one of the evaluation metrics compared to [14], [7], and [6] (see Table 3). It has been clear from these Tables (2 and 3) and Fig. 2. that our proposed model’s performance is sufficient and better than the others recently published methods.
4. Conclusion
In this paper, a no-reference image quality assessment model irrespective of any predefined specific artifacts of JPEG2000 images is proposed. We claimed that any kind of artifact creates edge distortions and human visual perception is very sensitive to edge information. Therefore, we presented a new method of image quality assessment model of JPEG2000 based on edge information. The proposed model has given good agreement with the DMOS of LIVE database. Although the approach is used only for JPEG2000 images, future research can be extended to generalize the approach irrespective of any kind of artifacts of different coded and distorted images.
Appendix
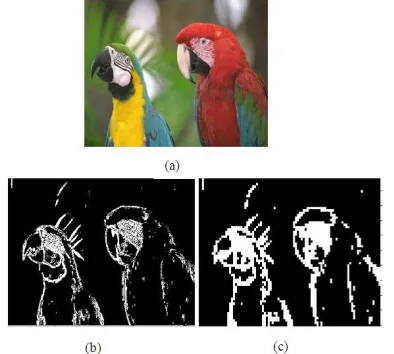
In this appendix the segmented images (both pixel based and block based) are provided for a reference image. Fig. 3 (a), (b) and (c) show the reference image, pixel based segmented image and the block based segmented image respectively. The histogram plots of reference and the corresponding coded images are also given in Figures 4 and 5. It has been observed from Figures 4 and 5 that most of the absolute difference pixel (ADP) amplitudes are in the low level range of the horizontal scale. Therefore considering only the low level amplitude values of the horizontal scale gives relatively more details about the edge information of the image.
Fig 3. Reference image (a); Pixel based segmented image (b); Block based segmented image (c)
Fig 4. Histogram plots of reference image (a); Horizontal (b); Vertical (c)
Fig 5. Histogram plots of coded image (a); Horizontal (b); Vertical (c)
References
[1] D. Zhang, “Information Theoretic Criteria for Image Quality Assessment Based on Natural Scene Statistics,” PhD Thesis, Dept. of System Design Engineering, University of Waterloo, Ontario, Canada, 2009.
[2] N. D. Kenyon, “Infrastructure standards for digital audiovisual systems,” British Telecomm Technical Journal, (3): 55-61, July 1990.
[3] J. R. Forrest, “Digital vision-where the superhighway will lead,” IEE Review, pp 245-249, November 1994.
[5] P. Marziliano, F. Dufaux, S. Winkler, and T. Ebrahimi, “A no-reference perceptual blur metric,” in Proc. of the Int. Conf. on Image Processing, vol. 3, pp. 57-60, Rochester, NY, 2002.
[6] P. Marziliano, F. Dufaux, S. Winkler, and T. Ebrahimi, “Perceptual blur and ringing metrics: Applications to JPEG2000,” Signal Proc.: Image Commu., 19(2) pp.163-172, 2004.
[7] H. R. Sheikh, A. C. Bovik, and L. Cormack “No reference quality assessment using natural scene statistics: JPEG2000,” IEEE Trans. on Image Process, vol. 14, no. 11, pp. 1918-1927, Nov., 2005.
[8] Tong H., et al., “No reference quality assessment for JPEG2000 compressed images,” in Proc. Intl. Conf.on image processing, ICIP’04,2004, Singapore, pp. 3539–3542.
[9] Barland, R., and A. Saadane, “Reference free quality metric for JPEG2000 compressed images,” in Proc. ISSPA, 2005, Sydney, Australia, pp. 351–354.
[10] X. Li, “Blind image quality assessment,” IEEE Int. Conf. Image Processing, Rochester, NY, Sept. 2002, pp. 449–452.
[11] A.K. Moorthy and A.C. Bovik, “A two-step framework for constructing blind image quality indices, IEEE Signal Processing Letters, 17 (5) (2010), pp. 513–516.
[12] M.A. Saad, A.C. Bovik and C. Charrier, “A DCT statistics-based blind image quality index”, IEEE Signal Processing Letters 17(6) (2010), pp.583-586
[13] Z. M. Parvez Sazzad, Y. Kawayoke, and Y. Horita, “Spatial features based no reference image quality assessment for JPEG2000,” IEEE Intl. Conf. on Image Processing. ICIP2007, San Antonio, USA, Sept. 2007.
[14] J. Zhang, S.H. Ong, T. M. Le, “Kurtosis-based no-reference quality assessment of JPEG2000 images,” Elsevier, Signal processing: Image Communication, vol.26 (2011), pp. 13-23.
[15] Roushain Akhter, Z. M. Parvez Sazzad, and Y. Horita, and J. Baltes “No reference stereoscopic image quality assessment,” Proc. SPIE, Vol. 7524, San Jose, CA, USA, Jan. 18-20, 2010.
[16] J. Kennedy and R. Eberhart, “Particle Swarm Optimization,” Proc. IEEE ICNN, Perth, Australia, pp. 1942-1948, Nov. 1995.
[17] Video Quality Expert Group (VQEG) Multimedia test plan, final version, 2007.
[18] H. R. Sheikh, Z. Wang, L. Cormack, and A. C. Bovik (2003) LIVE Image Quality Assessment Database. [Online]. Available: http://live.ece.utexas.edu/ research/quality.