DEMOGRAPHIC RESEARCH
VOLUME 32, ARTICLE 14, PAGES 421
−
442
PUBLISHED 12 FEBRUARY 2015
http://www.demographic-research.org/Volumes/Vol32/14/ DOI: 10.4054/DemRes.2015.32.14
Research Article
Two period measures for comparing the fertility
of marriage and cohabitation
Benoît Laplante
Ana Laura Fostik
©2015 Benoît Laplante & Ana Laura Fostik.
This open-access work is published under the terms of the Creative Commons Attribution NonCommercial License 2.0 Germany, which permits use, reproduction & distribution in any medium for non-commercial purposes, provided the original author(s) and source are given credit.
1 Introduction 422
2 Measuring the fertility of marriage and cohabitation 423
2.1 Previous research 423
2.2 The problem of measuring fertility of marriage and cohabitation 424 2.3 Decomposing age-specific fertility rates and the total fertility rate 427
3 An example using Canadian data 429
3.1 Context 429
3.2 Data and method 432
3.3 Results 433
4 Conclusions 439
5 Acknowledgements 440
Two period measures for comparing the fertility of marriage and
cohabitation
Benoît Laplante1
Ana Laura Fostik2
Abstract
BACKGROUND
The diffusion of cohabitation and, presumably, of childbearing within cohabitation, inspires interest in measuring the respective contribution of childbearing within marriage and within cohabitation to overall fertility. However, there is no consensus on a proper way to do so.
OBJECTIVE
Contribute to the development of tools for assessing the relative importance of marriage and cohabitation to overall fertility by developing period measures closely related to age-specific fertility rates and the total fertility rate.
METHODS
We introduce two measures: 1) the contribution of the conjugal state (living alone, living in a cohabiting union, being married) to age-specific fertility rates (CASFR) and 2) the contribution of the conjugal state to the TFR (CTFR). These measures are similar in construction to the marital (legitimate) fertility rates and marital (legitimate) TFR, but they are weighted by the proportion of women living alone, cohabiting, or being married at each age, so that their sum is the overall TFR. Taken together, they represent the fertility of the average woman of a synthetic cohort who moves across the various conjugal states (living alone, cohabiting, being married) over her life course. They provide “realistic” estimates of completed fertility within each conjugal state.
CONCLUSION
CASFRs provide a description of the fertility, over her life course, of a synthetic woman who would have spent her reproductive years living alone, cohabiting, and being married as the average woman of the synthetic cohort. CTFR provides a decomposition of the
1 Centre Urbanisation Culture Société, Institut national de la recherche scientifique, Université du Québec,
Montreal, Canada. E-Mail: [email protected]. 2
cumulative fertility of this synthetic woman. Over her life course, she would have had exactly the number of children computed using the overall TFR, but CTFR details the proportion of these children she would have had while living alone, while cohabiting, and while being married.
COMMENTS
Despite being defined as a conditional ASR weighted by the age-specific proportion of women living alone, cohabiting, or being married, computing the CASFR does not require that one know the population distribution of women by conjugal status, as this quantity cancels out. As a consequence, CASFR and CTFR may be computed without this information, as the parity-specific ASFR may be computed without knowing the population distribution of women by parity.
1. Introduction
Over the last decades, unmarried cohabitation has become a common mode of union formation in many Western countries and is becoming an established method of family formation in some of them. Consequently, childbearing within cohabitation is believed to have become common in a number of countries, and one could suspect that births within cohabitation account for a significant portion of overall fertility in countries were cohabitation is widespread. However, despite cohabitation becoming more common, there is not yet an easy and recognised way of assessing the respective contributions of marriage and cohabitation to fertility.
In this article, we introduce two measures that allow us to estimate the respective contributions of marriage and cohabitation to overall period fertility. These measures are based on a decomposition of the total fertility rate, in which the TFR is expressed as the sum of a series of contributions from conjugal status (i.e. living alone, cohabiting, or being married), and these contributions are expressed as the sum of weighted age-specific fertility rates, conditional on conjugal status. Unlike the marital (legitimate) or non-marital (illegitimate) ASFRs and TFR, whose values are typically larger than observed ASFRs and completed fertility, these measures take values that are “realistic” by design.
2. Measuring the fertility of marriage and cohabitation
2.1 Previous research
Fertility is commonly estimated using vital statistics. Vital statistics commonly report whether children are born to married parents or an unmarried mother, but do not commonly report whether the unmarried mother is cohabiting with the child’s father. Vital statistics are still largely computed following the traditional distinction between marital and non-marital fertility historically, legitimate and illegitimate fertility , not acknowledging the social phenomenon of unmarried cohabitation. For this reason, fertility estimates for cohabitation based on vital statistics are a rarity; when available, they are limited to the number or proportion of children born to cohabiting women (Klüsener, Perelli-Harris, and Sánchez Gassen 2013). There is no established way to compare the fertility of marriage and cohabitation. A review of attempts performed since the 1990s shows that the proposed solutions are many, and gives insight into the difficulties of such a comparison.
Verdugo Lazo (1994) used an approach developed by Rodriguez and Cleland (1988) and survey data to estimate the fertility of four forms of union (civil and religious, civil only, religious only, and consensual) in Brazil. The technique relies on exposure time measured from the beginning of the union, and requires that women do not change the form of their union after its onset.
Dumas, Bélanger, and Smith (1998) compared the fertility of marriage and cohabitation in Canada using data from a retrospective biographical survey. They estimated five-year age group birth rates for each of the two forms of union, for two ten-year periods, 1975–1984 and 1985–1994, and for two regions: Quebec, and Canada without Quebec. They computed the total fertility rate (TFR) for each region and period, based on the conjugal status of the mother at the time of the birth of the child. They concluded that the fertility of cohabitation was lower than that of marriage in both regions and in both periods, but that the difference between the fertility level of marriage and cohabitation was smaller in Quebec than in the rest of Canada. These authors, despite using data from a biographical survey, based their comparison on the TFR, using the conjugal status at the time of birth to compute the denominators of the age-specific rates (ASFRs). Apparently, they were aware that basing ASFRs on the time spent in each conjugal state produces misleading results (see section 2.2 below).
Raley (2001) used survey data and a decomposition technique to investigate whether the increasing number of births occurring to women living in cohabiting unions in the USA was a consequence of the increasing number of such women, or changes in the behaviour of cohabiting women. Her decomposition relies on, among other things, estimates of rates within marriage and cohabiting unions. She concluded that most of the growth in the proportion of births to cohabitors is the result of increases in the proportion of women cohabiting, rather than changes in union formation behaviour surrounding pregnancies.
Hoem and Mureşan (2011b) generalised the piecewise-constant intensity model of the TFR proposed in Hoem and Mureşan (2011a) so that it could be used to estimate the expected number of children within different types of unions, conditional on the duration of union rather than on age. This approach reduces the overestimation of the expected number of children due to the high values at lower ages that are typical of the marital fertility rate. The use of a regression-like model allows further modelling of the TFR using covariates. The authors used data from a Romanian biographical survey to estimate a duration-based TFR within three different types of unions: cohabitation, direct marriage, and marriage preceded by pre-marital cohabitation. This strategy allowed them to show that the fertility of the three types of union is similar, and that fertility is related to the time elapsed since the beginning of the union, rather than to the type of the union.
Hoem, Jalovaara, and Mureşan (2013) used a similar approach with a sample from Finnish register data, but took advantage of the large size of the sample to define a series of time-varying categories of union types, based on the number of years lived in cohabitation before marriage. Marriage without previous cohabitation, cohabitation never followed by marriage, marriage within one year of the beginning of cohabitation, marriage within two years of the beginning of cohabitation, and so on, are used as different time-varying categories, and they estimated a different set of duration-based rates for each of these categories. Their results show that the TFR was highest for marriage without cohabitation, and was higher for marriage within up to six years after the beginning of cohabitation than for cohabitation never followed by marriage.
2.2 The problem of measuring fertility of marriage and cohabitation
Besides introducing the difficulties of the comparison of interest to us, this review illustrates the variety of possible approaches and makes clear that these are highly dependent on the focus of the analysis and on the available data.
themselves may have different timings. Given that the problems are intertwined, we discuss them jointly, using the time-varying nature of conjugal status as the main thread. A somewhat “natural” way to deal with the time-varying nature of conjugal status is to model fertility within the framework of biographical analysis and using hazard models. The straightforward solution takes into account the time at risk, or exposure time, spent within each of the states. This can be done by modelling conjugal status as a three-modality time-varying covariate. However, this approach has some problems, best illustrated using a little thought experiment. Let us imagine two women who have their first child at the same age. Both started living with their partner in a cohabiting union at the same age, but one got married during her pregnancy. One of the two children is born to unmarried parents, whereas the other is born within marriage. Let’s assume a society made of pairs of such women with the age at the formation of the cohabitation, and the age at the first birth being the same within each pair, but varying across pairs and the marriage of the second woman always occurring during her first pregnancy. In such a society, half the first-born children are born to married parents and half to cohabiting parents. However, in this approach, the denominator of the cohabitation fertility rate is estimated using the time spent in cohabitation by all women, whereas the denominator of the marriage fertility rate is estimated using the time spent in marriage solely by married women. For this reason, estimations based on straightforward event history modelling would conclude that fertility is higher within marriage than within cohabitation, even in societies where the probability of being born to married or cohabiting parents is the same. Similarly, integrating over the estimated hazard functions would produce cumulative hazards TFRs higher for marriage than for cohabitation. Thus, as soon and as long as, in a society, cohabitation precedes marriage for some women, and some women have children outside of marriage, the comparison of the fertility of the two forms of union made using biographical data and the statistical models typical of event history analysis will almost inevitably lead to the conclusion that fertility is higher within marriage than within cohabitation. None of the authors who compared fertility within marriage and cohabitation using biographical data took such an approach. Van Hook and Altman (2013), which we have not cited yet, avoided the problem completely. In their didactic article on the computation of fertility measures from event history models estimated with logistic regression, they steered clear of the difficulty by limiting the space state of conjugal status to “married” and “unmarried”. Still, the choice is intriguing, as their data source, the National Survey of Family Growth, had already been used to estimate that in 2002, half of American women aged 15–44 had already cohabited (Goodwin, Mosher, and Chandra 2010).
the state at the beginning of the union; in Brown and Dittgen (2000), births are allocated to the state at the longest known duration of the union.
The approach developed by Hoem and his co-authors deals nicely with the overestimation of conditional TFRs and allows modelling the TFR in regression-like equations. However, the TFRs estimated using this approach are related to the conventional TFR conceptually, but not algebraically, which limits comparison.
Dumas, Bélanger, and Smith (1998) and Raley (2001) used very different techniques, but they all based their estimates on the conjugal status of the mother at the time of birth rather than the time spent in any conjugal state. This approach avoids the paradox of fertility rates conditional on conjugal status being at odds with the probability of being born within a given conjugal state. In other words, in the imagined case we described above, comparing period ASFRs and TFR computed using nothing more than the conjugal status at the time of birth would show that fertility is the same in marriage and cohabitation. These ASFRs and TFRs are those of three synthetic cohorts of women who would have lived out of union, in a cohabiting union or would have been married during all of their reproductive years. They are nothing more than extensions of the marital and non-marital ASFRs and TFRs, with their known limitations. The sum of marriage ASFRs typically leads to a value of the TFR that is far above of any observed value of completed fertility because ASFRs at lower ages are typically very high although very few women are married at age 15 or 16. Pressat (1973: 179) provides a classic representation of a smoothed distribution of the legitimate ASFRs and its relation to overall ASFRs, which depicts clearly how the legitimate ASFRs lead to “unrealistic” values of the TFR.
2.3 Decomposing age-specific fertility rates and the total fertility rate
Despite their limitations, the conditional ASFRs and TFR may be used as the basis for a different set of ASFR and TFR-related measures that allow the assessment of the contribution of each conjugal state to fertility in a given period, and lead to realistic estimates of conditional expected completed fertility. Conceptually, these new measures rely on the weighting of each ASFR by the age-specific proportion of women in the corresponding conjugal state. The sum of the weighted ASFRs over conjugal status is the overall ASFR. The sum of the weighted ASFRs over age is a TFR adjusted to the proportion of women living in each conjugal state. The sum of the adjusted TFRs is the overall TFR. Formally, these relations may be written as
A
sx sx sx
f
p f
, (1)
1 k
A
x sx
s
f
f
, (2)49
15
,
A A
s sx
x
F
f
(3)and
49
1 1 15
k k
A A
s sx
s s x
F
F
f
, (4)where
f
sxA is the adjusted age-specific fertility rate at age x for conjugal state s, psx is theproportion of women living in conjugal state s at age x, fsx is the age-specific fertility rate at
age x for conjugal state s, fx is the age-specific fertility rate, A s
proportions of the overall TFR, the adjusted TFRs may be interpreted as the proportion of fertility that can be attributed to each conjugal state. By definition, the adjusted ASFRs and TFRs are related algebraically to the overall TFR. By definition, they lead to realistic estimates of completed fertility. Conceptually, they assume conjugal status to be dynamic. We explain below they also have a substantive interpretation. Because of this interpretation and to avoid further use of the word adjusted, we will from now refer to the adjusted ASR
A
sx
f
as the contribution of a given conjugal status to the overall ASFR (CASFR) and tothe adjusted TFR
F
sA as the contribution of a given conjugal status to the overall TFR(CTFR).
Equation 1 seems to imply that computing CASFR and CTFR requires the distribution of women by conjugal status and age. However, there is no such requirement, as these frequencies cancel out, being at the same time the numerator of the age-specific proportion of women in a given conjugal status and the denominator of the corresponding conditional age-specific fertility rate. In other words, CASFR may be computed as the quotient of the number of births to women of a given age living in a given conjugal state and of the number of women of a given age, and CTFR may be computed as the sum of such quotients over age. As a consequence, the overall TFR may also be expressed as a sum of such quotients. Formally, these relations may be written as
A sx sx sx sx
sx sx sx sx
sx x sx x
b
w
b
b
f
p f
p
w
w w
w
, ((5)
49 49
15 15
A A sx
s sx
x x x
b
F
f
w
((6)
and
49 49
1 1 15 1 15
k k k
A A sx
s sx
s s x s x x
b
F
F
f
w
, k(7)
where bsx is the number of births to women living in conjugal state s at age x and wx is the number of women of age x.
This property is not unknown in fertility measurement. The conditional ASFR, fsx, is akin to the parity-specific ASFR of the first kind, whose denominator is the number of women of age x who are truly at risk of having the next child, say wpx, whereas CASFR,
A sx
f
, is akin to the parity-specific ASFR of the second kind, whose denominator is the total number of women of age x regardless of the number of children they gave birth to, that iswx. As the parity-specific ASFR of the second kind, but unlike the parity-specific ASFR of the first kind, CASFR may be used in a decomposition of the overall TFR (see Vallin and Caselli 2006: 177–178). In other words, CASFR is a contribution to the age-specific fertility rate in the same way as the parity-specific ASR is a contribution to the overall age-specific fertility rate, as well as CTFR is a contribution to the TFR in the same way as the parity-specific TFR is a contribution to the overall total fertility rate.3
We present CASFR and CTFR for one-year intervals because the data we use in the example permit us to use such intervals, and because one-year intervals allow us to use a simpler notation. If necessary, they may be computed for five-year intervals, making the appropriate adjustments.
3. An example using Canadian data
3.1 Context
Interest in comparing the fertility of marriage and cohabitation arises “naturally” when looking at Canada because, over the last decades, unmarried cohabitation has become institutionalised through case law and legislative changes. This interest is also fostered by the case of Quebec one of the ten Canadian provinces where, since the mid-1990s, most children are born to women living in a cohabiting relationship.
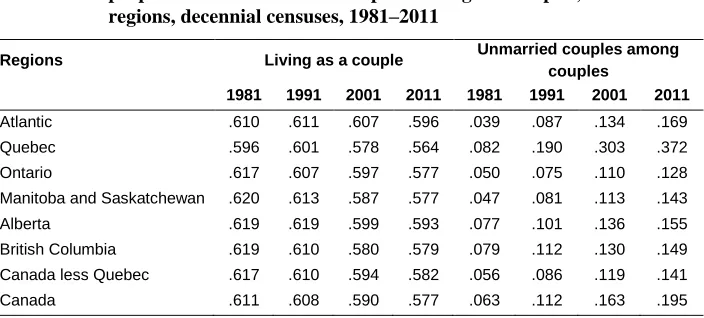
Cohabitation was already more common in Quebec than in most other provinces in 1981, when census data was first used to estimate the number of people living in consensual relationships, but not much more than in British Columbia or Alberta. However, the gap between Quebec and the rest of Canada became obvious by the 1986 Census of Population, and has become wider since (see Table 1).
Table 1: Proportion of the population aged 15 or more living as a couple and proportion of unmarried couples among all couples, Canada and regions, decennial censuses, 1981–2011
Regions Living as a couple Unmarried couples among couples
1981 1991 2001 2011 1981 1991 2001 2011
Atlantic .610 .611 .607 .596 .039 .087 .134 .169
Quebec .596 .601 .578 .564 .082 .190 .303 .372
Ontario .617 .607 .597 .577 .050 .075 .110 .128
Manitoba and Saskatchewan .620 .613 .587 .577 .047 .081 .113 .143
Alberta .619 .619 .599 .593 .077 .101 .136 .155
British Columbia .619 .610 .580 .579 .079 .112 .130 .149
Canada less Quebec .617 .610 .594 .582 .056 .086 .119 .141
Canada .611 .608 .590 .577 .063 .112 .163 .195
Source: Dumas and Bélanger (1998:130), based on the 1981 and 1991 Censuses of Canada; authors’ estimation based on the 2.7%
sample Public Use Microdata File of the 2001 Census of Canada; authors’ estimation based on Statistics Canada’s Topic-based tabulation 98-312-XCB2011039 of the 2011 Census of Canada.
Figure 1 shows the evolution of the proportion of births to unmarried mothers and of the Total Fertility Rate in the Canadian provinces over the last decades. Quebec has the highest proportion of births to unmarried mothers, and it has been so since at least the beginning of the 1990s. Given the spread of unmarried cohabitation in Quebec, the high proportion of children being born to unmarried women does not come as a surprise. However, when comparing the two panes of Figure 1, there seems to be little correlation between the proportion of births to unmarried mothers and the TFR. Since the start of the diffusion of unmarried cohabitation in the mid-1980s, the TFR has been fluctuating in most provinces, including Quebec, whereas the proportion of births to unmarried mothers has increased in most of them.
Figure 1: Proportion of births to unmarried mothers 1991–2011 (left) and Total Fertility Rate 1986–2011 (right), Canadian provinces, vital statistics
AB BC MB NB NL NS ON PE QC SK 0.2 0.3 0.4 0.5 0.6 P ro p o rti o n o f b ir th s to u n m a rr ie d m o th e rs
1991 1996 2001 2006 2011
Year QC NL PE NS NB ON MB SK AB BC 1.2 1.4 1.6 1.8 2.0 T o ta l F e rti lity Ra te
1986 1991 1996 2001 2006 2011
Year
AB Alberta, BC British Columbia, MB Manitoba, NB New Brusnwick, NL Newfoundland, NS Nova Scotia, ON Ontario, PE Prince-Edward Island, QC Quebec, SK Saskatchewan
Investigating this topic requires the comparison of fertility within marriage, and within cohabitation, across provinces and over time. To keep things tractable and within the limits of an example, we restrict the comparison to two provinces: Quebec and Ontario. Quebec has the largest proportion of births to unmarried mothers, and Ontario is among those with the lowest; fertility has been slightly higher in Ontario than in Quebec from 1986 until 2005, but is now higher in Quebec; Ontario is the Canadian province with the largest population, Quebec ranking second; Quebec and Ontario are neighbours, and have similarly diversified economies.
We use within-conjugal-state ASFRs and cumulative fertility to compare fertility patterns across conjugal status in each province. If the distribution of ASFRs and cumulative fertility within marriage and within cohabitation are similar, both conjugal states are likely to be acceptable for childbearing and child rearing for the individuals who live in the province, as well as acceptable according to the norms prevailing in the province.
Finally, we compare the ASFRs and the TFR across censuses as a way to assess the extent to which the social acceptance of cohabitation as a setting for childbearing and child rearing increased over time. We compare, in the same fashion, contributions to ASFR and to TFR to assess variation in the contribution of cohabitation and marriage to fertility over time.
3.2 Data and method
As we explain in section 2.3, CASFR and CTFR may be computed from a variety of data types, including biographical data, vital statistics data if they include information on the relation between the fathers and the unmarried mothers , other forms of register data as well as census data, depending on the availability of information in each given source, the objectives of the study and sample size. Two sources of data contain the information we need: Statistics Canada’ retrospective biographical survey on the family realised every five years or so since the mid-1990s as part of the General Social Survey program, and the 20% samples from census records available to researchers in Statistics Canada’s Research Data Centres. The biographical data have the advantage of allowing us to order events precisely, which leads to a low probability of misclassifying a birth as occurring in a given conjugal state, when it actually occurred when the mother was in another one. However, these data are not well suited for our purpose. They are designed to perform life course analysis per se: they are fine for cohort analysis within the framework of life course analysis, but they are not very well suited for comparing periods, which is what we are interested in. We rather use the 20% samples from census records. Unlike biographical data, census data provide provincial subsamples of sizes that allow us to estimate ASFRs using one-year intervals for the two provinces we are comparing. Using the own-children method (Grabill and Cho 1965; Rindfuss 1976; Cho, Retherford, and Choe 1986) and focusing on births that occurred in the 12-month period before the census allows us to produce estimates of all the quantities we wish to estimate. This level of precision allows the graphing of cumulative fertility Fx and Fsx as a function of age and the contribution of each
conjugal state to cumulative fertility
F
sxA as a function of age.long one. Researchers have access to the data from the long form. We use individual data from the 20% sample of the Canadian population who answered the 1986, 1996, and 2006 long form of the census. The 1981 Census did not include questions that clearly allowed couples to declare living together without being married; the estimates reported in Table 1 are reasonable approximations for a population, but they are based on a procedure that was not designed to generate reliable information at the individual level. The 2011 Census of Population and National Household Survey microdata were not yet available to researchers when we conducted the analyses.
Canadian official statistics classify persons according to conjugal status in three categories that are states of a state space: 1) not living in a conjugal union, 2) being married and living with one’s spouse or 3) living in a cohabiting union. We take advantage of the richness of census data to estimate five different measures: the proportion of women in each conjugal state by age (psx); age-specific fertility rates by conjugal status (fsx); the total fertility rate by conjugal status (Fs), not previously formally introduced; the contribution of
each conjugal state to age-specific fertility rates (CASFR or
f
sxA); and the contribution ofeach conjugal state to the total fertility rate (CTFR or
F
sA). Each measure is computed foreach of the three censuses. For each census, each measure is computed for each of the two provinces we compare. We report results mostly as figures.
3.3 Results
Figure 2: Conjugal status of women by age, women aged 15–49, Quebec and Ontario, 1986, 1996, and 2006. Census data, 20% sample
0.00 0.20 0.40 0.60 0.80 1.00
15 20 25 30 35 40 45 49
Qu e b e c 1986 0.00 0.20 0.40 0.60 0.80 1.00
15 20 25 30 35 40 45 49
1996 0.00 0.20 0.40 0.60 0.80 1.00
15 20 25 30 35 40 45 49
2006 0.00 0.20 0.40 0.60 0.80 1.00
15 20 25 30 35 40 45 49
On ta ri o 1986 0.00 0.20 0.40 0.60 0.80 1.00
15 20 25 30 35 40 45 49
1996 0.00 0.20 0.40 0.60 0.80 1.00
15 20 25 30 35 40 45 49
2006
Marriage Not in union Cohabitation
Figure 3: Age-specific fertility rates by conjugal status, women aged 20–49,
Quebec and Ontario, 1986, 1996, and 2006. Census data, 20% sample
0.00 0.10 0.20 0.30
20 25 30 35 40 45 49
Q u e b e c 1986 0.00 0.10 0.20 0.30
20 25 30 35 40 45 49
1996
0.00 0.10 0.20 0.30
20 25 30 35 40 45 49
2006
0.00 0.10 0.20 0.30
20 25 30 35 40 45 49
O n ta ri o 1986 0.00 0.10 0.20 0.30
20 25 30 35 40 45 49
1996
0.00 0.10 0.20 0.30
20 25 30 35 40 45 49
2006
Figure 4: Cumulative fertility rates by conjugal status, women aged 15–49, Quebec and Ontario, 1986, 1996, and 2006. Census data, 20% sample
0.0 1.0 2.0 3.0 4.0
15 20 25 30 35 40 4549
Q u e b e c 1986 0.0 1.0 2.0 3.0 4.0
15 20 25 30 35 40 45 49
1996 0.0 1.0 2.0 3.0 4.0
15 20 25 30 35 40 45 49
2006 0.0 1.0 2.0 3.0 4.0
15 20 25 30 35 40 4549
O nt ar io 1986 0.0 1.0 2.0 3.0 4.0
15 20 25 30 35 40 45 49
1996 0.0 1.0 2.0 3.0 4.0
15 20 25 30 35 40 45 49
2006
Total Marriage Cohabitation Not in union
Figure 5: Contribution of each conjugal state to age-specific fertility rates, women
aged 15–49, Quebec and Ontario, 1986, 1996, and 2006. Census data, 20% sample
0.00 0.05 0.10 0.15
15 20 25 30 35 40 4549
Q u e b e c 1986 0.00 0.05 0.10 0.15
15 20 25 30 35 40 45 49
1996
0.00 0.05 0.10 0.15
15 20 25 30 35 40 45 49
2006
0.00 0.05 0.10 0.15
15 20 25 30 35 40 4549
O n ta ri o 1986 0.00 0.05 0.10 0.15
15 20 25 30 35 40 45 49
1996
0.00 0.05 0.10 0.15
15 20 25 30 35 40 45 49
2006
Figure 6: Contribution of each conjugal state to cumulative fertility, women aged 15–49, Quebec and Ontario, 1986, 1996, and 2006. Census data, 20% sample 0.0 0.5 1.0 1.5 2.0
15 20 25 30 35 40 45 49
Q u e b e c 1986 0.0 0.5 1.0 1.5 2.0
15 20 25 30 35 40 45 49
1996 0.0 0.5 1.0 1.5 2.0
15 20 25 30 35 40 45 49
2006 0.0 0.5 1.0 1.5 2.0
15 20 25 30 35 40 45 49
O n ta ri o 1986 0.0 0.5 1.0 1.5 2.0
15 20 25 30 35 40 45 49
1996 0.0 0.5 1.0 1.5 2.0
15 20 25 30 35 40 45 49
2006
Marriage Cohabitation Not in union
Figure 3 reports the age-specific fertility rates of women aged 20–49 by conjugal status. Few women are cohabiting, and even fewer are married before age 20, but ASFRs are very high among them. As we pointed out in section 2.2, this is a known feature of measures of marital fertility. The contribution to fertility of births for women younger than age 20 is negligible, whether married or cohabiting (see Figure 6), but displaying the corresponding ASFRs in a graph would dwarf its most relevant portion. Among Quebec women, the peak distribution of age-specific rates is located between age 25 and 30, and remains at the same level from the first census to the last one, but its location shifts from left to right. In all censuses, the rates are consistently much higher within marriage than within cohabitation up to age 30, but similar between age 30 and 40. From the first census to the second, rates increased within cohabitation. In Ontario, even in the most recent census, the rates are higher within marriage than within cohabitation until the late 30s.
first to the second census. In the third one, cumulative fertility is higher within cohabitation than within marriage until age 25. Except for this difference, cumulative fertility within marriage and within cohabitation is similar in the two provinces in 2006.
Figure 5 reports the contribution of each conjugal state to age-specific fertility rates. The striking difference is the radical change in Quebec from 1986 to 2006. In 1986, marriage had by far the largest contributions to age-specific fertility rates. In 2006, the contributions of cohabitation were higher. In 1996 and 2006, the contributions of marriage reach their peak at a later age than the contributions of cohabitation. This underlines the fact that although age-specific fertility rates are higher within marriage than within cohabitation in general and especially at younger ages, few women are married at these ages. In Ontario, the contributions of marriage are overwhelming in all censuses. Contributions to age-specific rates of Ontario in 2006 are similar to Quebec in 1986.
Figure 6 reports the contribution of each conjugal state to cumulative fertility. In Quebec, in 1986, the contributions of living without a husband or partner and living in a cohabiting union were about the same, much lower than that of marriage. In 1996, the contributions of marriage and cohabitation were about the same. In 2006, the contribution of cohabitation was larger than that of marriage. In Ontario, the contribution of marriage to cumulative fertility is overwhelming in all three censuses.
Conditional ASFRs and TFRs are higher within marriage than within cohabitation in all censuses and both provinces. However, in Quebec, in 2006, the ASFRs within marriage are higher for younger ages at which very few women are married; as a consequence, these high rates add little to the contribution of marriage to overall cumulative fertility. For those ages, the ASFRs within cohabitation are lower, but as more women are cohabiting than being married, they add more to the contribution of cohabitation to overall cumulative fertility. At older ages, the ASFRs within cohabitation are similar to those of marriage, and a higher proportion of women are married. A significant portion of the contribution of marriage to cumulative fertility depends on those lower rates at higher ages. Given the high proportion of cohabiting women and the not-so-low ASFRs of cohabitation at ages in which women do cohabit, the synthetic woman of 2006 Quebec has a higher fraction of her expected completed fertility while cohabiting than while being married. From a different perspective, lower ASFRs within cohabitation than within marriage at younger ages suggest that, in Quebec, young cohabiting women control their fertility more than young married women, or that having a child is a higher priority for young married women than for young cohabiting ones.
ones do, or that having a child is a higher priority for young cohabiting women than for young married ones.
In Quebec, the fertility of marriage is substantively higher than that of cohabitation at ages where very few women are married. Consequently, fertility within cohabitation is replacing fertility within marriage as cohabitation becomes more common, although with a different timing. In Ontario, few women live in a cohabiting union and the fertility of cohabitation is higher than that of marriage at ages in which few women are living in a conjugal union. Consequently, fertility remains concentrated within marriage. Extending the inquiry to other Canadian provinces is beyond the scope of this example.
Table 2: Total fertility rate and contributions of each conjugal state to TFR, Quebec and Ontario, 1986, 1996 and 2006 censuses. Comparison of estimates based on unique (U) and multiple (M) births
Quebec Ontario
1986 1996 2006 1986 1996 2006
U M U M U M U M U M U M
Total Fertility Rate 1.376 1.716 1.570 1.987 1.563 1.962 1.562 2.043 1.600 2.155 1.558 2.010
Contribution to TFR
Marriage 1.044 1.261 0.738 0.913 0.607 0.751 1.377 1.714 1.229 1.558 1.163 1.459
Cohabitation 0.204 0.243 0.663 0.808 0.824 1.019 0.075 0.094 0.181 0.225 0.210 0.260
Not in union 0.128 0.212 0.169 0.265 0.032 0.190 0.111 0.234 0.190 0.371 0.185 0.290
Proportion of TFR
Marriage 0.759 0.735 0.470 0.460 0.388 0.383 0.881 0.839 0.768 0.723 0.746 0.726
Cohabitation 0.148 0.141 0.423 0.407 0.527 0.519 0.048 0.046 0.113 0.104 0.135 0.129
Not in union 0.093 0.124 0.107 0.134 0.085 0.097 0.071 0.114 0.119 0.172 0.119 0.144
Source: Census data, 20% sample. Own children method, weighted estimation.
4. Conclusions
Comparing the fertility of marriage and of cohabitation is of interest, given the current rise of cohabitation and the accompanying rise of childbearing within cohabitation. Current vital statistics do not provide a satisfactory way to do this, because they usually do not make a distinction between births to cohabiting unmarried women and births to unmarried women living alone. Proportions of children born to unmarried mothers, when available, do not provide information about the age distribution of births within marriage and cohabitation. They are not related to the total fertility rate, which is the main indicator of period fertility. Methods based on biographical data rely on the life experience of real cohorts. They are well suited for cohort analysis and the study of changes across cohorts, but not for comparison across periods and even less for portraying recent trends and the current situation.
Conditional ASFRs and TFR, similar in their construction to marital age-specific fertility rates and the marital TFR, allow the assessment of whether or not, in a given period and in a given society, having a child is as likely within cohabitation as it is within marriage. This is useful when one is interested in comparing the two conjugal states from a normative perspective. However, the conditional rates do not allow us to estimate the relative importance of each conjugal state for overall fertility. The conditional TFR does not provide an estimate of completed fertility, as it relies on the assumption that a woman would live alone, be married, or live in an unmarried, cohabiting relationship continuously during all her reproductive years.
synthetic woman who would have spent her reproductive years living alone, cohabiting, and being married as the average woman of the synthetic cohort. The contributions to the TFR provide a decomposition of the cumulative fertility of this synthetic woman. Over her life course, she would have had exactly the number of children computed using the overall TFR, but using the contributions would allow detailing the proportion of these children she would have had while living alone, while cohabiting, and while being married. From a macro-perspective, these two measures help us to comprehend the relative importance of marriage and cohabitation in fertility in an elegant way, as they are algebraically related to the overall ASFRs and TFR. Given their similarity with the parity-specific ASR and TFR of the second kind, the two measures may be computed from a variety of data sources, including vital statistics, without knowing the number or proportion of women living in an unmarried cohabiting relationship, as long as the conjugal status of the mother is known. Using them should provide a better understanding of the changing relation between fertility and conjugal status.
5. Acknowledgments
This research was supported by a Standard Research Grant from the Social Sciences and Humanities Research Council of Canada.
References
Brown, E. and Dittgen, A. (2000). Fertility of married and unmarried couples in Europe.
Paper presented at the FFS flagship conference Partnership and fertility–A revolution?. Brussels, May 29–31, 2000.
Caron-Malenfant, É. and Bélanger, A. (2006). The fertility of visible minority women in Canada. In: Bélanger, A. (ed.). Report on the demographic situation in Canada 2003 and 2004. Ottawa: Statistics Canada:79–94.
Cho, L.-J., Retherford, R.D., and Choe, M.K. (1986). The own-children method of fertility estimation. Honolulu: University of Hawaii Press.
Dumas, J., Bélanger, A., and Smith, G. (1998). Common-law unions in Canada at the end of the 20th century. In: Dumas, J., Bélanger, A., and Smith, G. (eds.). Report on the demographic situation in Canada 1996. Ottawa: Statistics Canada: 121–186.
Goodwin P.Y., Mosher, W.D., and Chandra, A. (2010) Marriage and cohabitation in the United States: A statistical portrait based on Cycle 6 (2002) of the National Survey of Family Growth.Vital Health Stat 23(28):1-45.
Grabill, W.H. and Cho, L.-J. (1965). Methodology for the measurement of current fertility from population data on young children. Demography 2(1): 50–73. doi:10.2307/
2060106.
Hoem, J.M., Jalovaara, M., and Mureşan, C. (2013). Recent fertility patterns of Finnish women by union status: A descriptive account. Demographic Research 28(14): 409–420. doi:10.4054/DemRes.2013.28.14.
Hoem, J.M. and Mureşan, C. (2011a). An Extension of the Conventional TFR. European Journal of Population 27(4): 389–402. doi:10.1007/s10680-011-9247-9.
Hoem, J. M. and Mureşan, C. (2011b). The Total Marital Fertility Rate and its extensions.
European Journal of Population 27(3):295–312. doi:10.1007/s10680-011-9237-y.
Klüsener, S., Perelli-Harris, B., and Sánchez Gassen, N. (2013). Spatial aspects of the rise of nonmarital fertility across Europe since 1960: The role of states and regions in shaping patterns of change. European Journal of Population 29(2):137–165.
doi:10.1007/s10680-012-9278-x.
Lapierre-Adamcyk, É. and Lussier, M.-H. (2003).De la forte fécondité à la fécondité désirée. In, Piché, V. and Le Bourdais, C. (ed.). La démographie québécoise. Enjeux du XXIe siècle. Montréal: Presses de l’Université de Montréal: 66–109.
O’Leary, L., Natamba, E., Jefferies, J., and Wilson, B. (2010). Fertility and partnership status in the last two decades. Population Trends 140(1): 5–35. doi:10.1057/
pt.2010.10.
Pressat, R. (1973). L’analyse démographique. Paris: Presses universitaires de France.
Raley, R.K. (2001). Increasing fertility in cohabiting unions: Evidence for the Second Demographic Transition in the United States? Demography 38(1): 59–66.
doi:10.1353/dem.2001.0008.
Rindfuss, R.R. (1976). Annual fertility rates from census data on own children: Comparisons with vital statistics data for the United States. Demography 13(2): 235–249. doi:10.2307/2060803.
Rodriguez, G. and Cleland, J. (1988). Modelling marital fertility by age and duration: an empirical appraisal of the Page model. Population Studies 42(2): 241–257. doi:10.1080/0032472031000143346
St-Amour, M. (2013). Les écarts de fécondité .selon la situation conjugale au Québec.
Données sociodémographiques en bref 17(2): 6–9.
Vallin, J. and Caselli, G. (2006). The hypothetical cohort as a tool for demographic analysis. In Caselli, G., Vallin, J., and Wunsch, G. (eds). Demography, analysis and synthesis. A treatise in population studies, Volume I. Burlington MA: Academic Press: 163–195.
Van Hook, J. and Altman, C.E. (2013). Using discrete-time event history fertility models to simulate total fertility rates and other fertility measures. Population Research and Policy Review 32(4): 585–610. doi:10.1007/s11113-013-9276-7.