Estimation of Furrow Irrigation Sediment Loss
Using an Artificial Neural Network
Bradley A. King, P.E.
1; David L. Bjorneberg, P.E.
2; Thomas J. Trout, P.E.
3; Luciano Mateos, Aff.M.ASCE
4;
Danielle F. Araujo
5; and Raimundo N. Costa
6Abstract:The area irrigated by furrow irrigation in the United States has been steadily decreasing but still represents about 20% of the total irrigated area in the United States. Furrow irrigation sediment loss is a major water quality issue, and a method for estimating sediment loss is needed to quantify the environmental effects and estimate effectiveness and economic value of conservation practices. Artificial neural network (NN) modeling was applied to furrow irrigation to predict sediment loss as a function of hydraulic and soil conditions. A data set consisting of 1,926 furrow evaluations, spanning three continents and a wide range of hydraulic and soil conditions, was used to train and test a multilayer perceptron feed forward NN model. The final NN model consisted of 16 inputs, 19 hidden nodes in a single hidden layer, and 1 output node. Model efficiency (ME) of the NN model was ME¼0.66for the training data set and ME¼0.80for the test data set. The prediction performance for the complete data set of 1,926 furrow evaluations was ME¼0.70with an absolute sediment loss prediction error of less than5,10,20, and30kg per furrow for 35, 53, 72, and 85% of the data set values, respectively. The NN model is applicable to predicting sediment loss rates between 1 and 300 kg per furrow for furrow lengths between 30 and 400 m, slopes between 0.1 and 4%, flow rates between 5 and 75L min−1, and silt or sand particle–sized fractions between 0.1 and 0.75. DOI: 10.1061/(ASCE)IR.1943-4774 .0000932.© 2015 American Society of Civil Engineers.
Introduction
The area irrigated by furrow irrigation in the United States has been steadily decreasing but still represents about 20% of the total irri-gated area or 4,400,000 ha (USDA NASS 2009). In furrow irriga-tion, water is introduced into small, equally spaced, human-made channels at the upslope end of a field and allowed to flow down-slope and infiltrate, storing water in the root zone for crop growth. Water flow rate must be sufficient to ensure water advances to the end of the field in a reasonable amount of time to allow sufficient time for water to infiltrate along the full length of the field. Water in excess of infiltration flows off the field and often enters nearby water bodies. As water flows in furrows it detaches soil particles which are transported downslope. Furrow flow rate decreases
downslope due to infiltration such that suspended soil particles can no longer be transported and are deposited in the furrow. Water leaving the field carries sediment along with absorbed chemicals which degrades the quality of receiving water bodies. Soil loss from furrow irrigation often exceeds2–11Mg ha−1(Koluvec et al. 1993) and rates of up to100Mg ha−1have been measured in experimen-tal studies (Berg and Carter 1980;Evans et al. 1995;Trout 1996; Fernández-G ´omez et al. 2004). Crop yield reductions up to 25% have been documented at furrow inflow ends of fields due to soil loss from 80 years of furrow irrigation erosion (Berg and Carter 1980;Carter et al. 1985;Carter 1993). Furrow irrigation sediment loss is a major water quality issue, and a method for estimating sediment loss is needed to quantify the environmental effects and estimate effectiveness and economic value of conservation practices.
Acquiring field data for developing process-based furrow ero-sion models is challenging (Mateos and Giráldez 2005). Physical models used to predict furrow erosion are based on predominantly empirical equations used to model rainfall-induced rill erosion (Bjorneberg et al. 2000). The conditions used during experimental development of governing equations limit use of the equations to field conditions similar to experimental conditions. The physical conditions used to define the functional relationships of rill erosion under rainfall runoff differ from furrow irrigation in several aspects (Bjorneberg et al. 2000). For example, water initially flows on dry soil during furrow irrigation, but rainfall wets the soil before water begins to flow in rills. Instantaneous wetting of soil aggregates replaces air absorbed on internal soil particle surfaces which can actually break apart soil aggregates (Carter 1990), increasing soil erodibility. This is a possible reason why furrow erosion often occurs with less than critical hydraulic shear (Kemper et al. 1985). Relatively clean water is introduced into furrows while sediment-laden water enters rills under rainfall erosion. Furrow flow rate decreases with distance, which is not typically the case for rainfall runoff. Flow in furrows usually lasts 12–24 h, considerably longer than a rainfall-runoff event. Initially, sediment detachment during 1Research Agricultural Engineer, USDA-ARS Northwest Irrigation and
Soils Research Laboratory, 3793N. 3600E., Kimberly, ID 83341-5076 (corresponding author). E-mail: [email protected]
2Supervisory Research Agricultural Engineer, USDA-ARS Northwest
Irrigation and Soil Research Laboratory, 3793N. 3600E., Kimberly, ID 83341-5076. E-mail: [email protected]
3Supervisory Research Agricultural Engineer, USDA-ARS Water
Management Research Unit, 2150 Centre Ave., Bldg. D, Suite 320, Fort Collins, CO 80526. E-mail: [email protected]
4Research Scientist, Insituto de Agricultura Sostenible, CSIC, Alameda
del Obispo, 14080 C´ordoba, Spain. E-mail: [email protected]
5Former Graduate Student, Departamento de Engenharia Agrícola,
Universidade Federal do Ceará, DENA, Bloco 804, Caixa-Postal 12168, Pici, CEP 60451-970, Fortaleza, Ceará, Brazil. E-mail: dannyellearaujo@ gmail.com
6Professor, Departamento de Engenharia Agrícola, Universidade
Federal do Ceará, DENA, Bloco 804, Caixa-Postal 12168, Pici, CEP 60451-970, Fortaleza, Ceará, Brazil. E-mail: [email protected]
Note. This manuscript was submitted on February 6, 2015; approved on May 20, 2015; published online on July 8, 2015. Discussion period open until December 8, 2015; separate discussions must be submitted for indi-vidual papers. This paper is part of theJournal of Irrigation and Drainage Engineering, © ASCE, ISSN 0733-9437/04015031(8)/$25.00.
furrow irrigation may be similar to rill erosion, but after several hours head cuts and side cuts become important mechanisms for sediment detachment (Bjorneberg et al. 2000) which are not con-sidered in rainfall-induced rill erosion.
Trout and Neibling (1993) provided a review of erosion and sedimentation processes in furrow irrigation along with field study results. They found that the processes of detachment, transport, and deposition occurring in furrow irrigation are not adequately quan-tified by rill erosion equations based on hydraulic shear. Nearing et al. (1991) investigated particle detachment in rills at low slopes (0–2%) and shear stresses (0.5–2 Pa) and found that detachment rate was not a function of shear stress nor was it related to the existence of a critical shear. They found that the logarithm of de-tachment rate was well correlated with flow depth, slope, and soil aggregate size (R2¼0.94). While rill erosion–based equations do not adequately predict erosion for furrow irrigation, they do provide insight into the factors and important relationships (Fernández-G ´omez et al. 2004). Trout and Neibling (1993) concluded that while process-based models are important for understanding fur-row erosion processes, current models can predict furfur-row sediment loss no better than empirical models relating sediment loss to measurable hydraulic parameters such as slope, flow rate, and soil characteristics such as texture. Bjorneberg et al. (1999) evaluated furrow irrigation erosion predicted by the water erosion prediction project (WEPP) model (Nearing et al. 1989), a process-based model, and concluded that the steady-state WEPP was not appli-cable to furrow erosion based on field evaluations for a single soil. Baseline erodibility and critical shear values developed under rainfall-runoff conditions were higher than calibrated values for furrow irrigation. Sediment deposition based on transport capacity also did not match measured deposition in furrows. Bjorneberg et al. (2010) reviewed the current status of furrow sediment loss predic-tion and concluded that an empirical model may be as good as or better than a process-based model where the parameters cannot be quantified for field conditions.
Development of empirical models for predicting furrow irriga-tion sediment loss has been a subject of research for over half a century. Koluvek et al. (1993) noted that the first published equa-tion for predicting furrow erosion was based on research in Utah which directly related erosion to exponential functions of furrow flow rate and slope with exponents greater than 1 (Israelson et al. 1946). Regression models have been developed to predict sediment loss with limited success (Fornstrom and Borrelli 1985;O’Donkor 1978). More recently, an empirical surface irrigation soil loss (SISL) model was developed by the Idaho Natural Resources Con-servation Service (NRCS) in 1991 to estimate annual soil loss from furrow irrigated fields to assess benefits of conservation practices, such as converting from furrow to sprinkler irrigation (Bjorneberg et al. 2007). A base soil loss value is multiplied by several factors to account for variations in soil erodibility, previous crop, conserva-tion practices, and irrigaconserva-tion management. SISL was based on over 200 field-years of data from southern Idaho. An evaluation of the SISL model with measured furrow irrigation erosion from two studies in Idaho and one in Washington showed that the model pre-dicted the relative effects of conservation tillage practices of straw mulching and surge irrigation reasonably well; however, the abso-lute differences between measured and predicted soil loss were sometimes large. Number of irrigations per season is embedded in the base soil loss so SISL cannot be applied when irrigation appli-cation frequency varies significantly from typical southern Idaho conditions. Bjorneberg et al. (2007) also noted that the baseline soil loss was less than field measured soil loss on occasions, indi-cating that a different method is needed for calculating baseline soil loss.
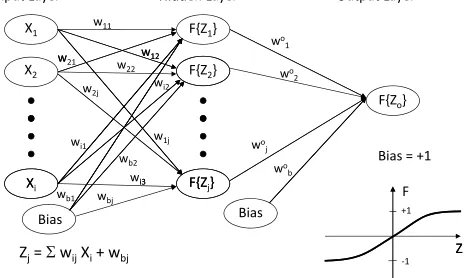
Artificial neural network (NN) models represent a collection of relatively new modeling approaches that are rapidly finding uses in branches of engineering and science. Initially developed as a means of duplicating the functioning of a biological neuron, NN modeling techniques suitable for predicting physical proc-esses have been developed over the past 50 years. A common basic NN architecture is the multilayer perceptron feed-forward NN which consists of multiple layers of simple computing nodes (neurons) that operate as nonlinear summing devices which are interconnected between layers by weighted links (wij, Fig. 1), where numerical computation proceeds left to right without feed-back to a previous layer. Input valuesXi (furrow irrigation field variables, Fig.1) and interconnection weights are used to calcu-lateZjfor each hidden layer neuron. Output from the neuron is calculated from the transfer (activation) function F using Zj (Fig. 1), which becomes the input vector to the output layer where the output from the neural network is calculated in the same manner as for the hidden layer. The functionality of a neuron is to sum the product of the weights and input vectors plus a bias weight (wbj, Fig. 1) and process the sum through a nonlinear transfer (activation) function. Each weight is determined when measured data are presented to the network during a training process. Successful training of a NN results in a numerical model that can perform tasks such as predicting an outcome value, classifying an object, approximating a func-tion, or recognizing a pattern. Artificial neural networks can an-alyze multisource data sets and are considered to be universal classifiers or approximators (Haykin 2009).
Artificial neural networks are appropriate where the phys-ical processes are complex, unknown, or difficult to represent mathematically. These three conditions apply in the case of furrow irrigation sediment loss. Artificial neural networks are data-driven models requiring a representative data set for training. Thus, appli-cations where data are limited and/or subject to large variability limit the applicability and success of a NN. Soil erosion data are inherently noisy data as there are many extraneous random factors that can influence soil erosion. Rainfall-runoff erosion data com-monly contains a few extreme events that add considerable variabil-ity to the data set. In furrow irrigation, gravvariabil-ity can cause sloughing of furrow side walls that have been weakened by wetting and/or undercut by erosion, creating a flush of sediment loss. Compacted subsurface layers such as tillage pans may stop the erosion process. Head cuts and side cuts form when, at points of localized high shear, the surface seal or a resistant soil layer is eroded away and the furrow bed elevation drops. The accelerating water at the drop Fig. 1.Schematic structure of the feed-forward neural network used in this study
erodes a pool that undercuts the resistant layer so the head cut moves upstream, producing large amounts of sediment (Trout and Neibling 1993).
Artificial neural networks have been successfully used for many applications closely related to soil erosion such as rainfall-runoff modeling, stream flow forecasting, groundwater modeling, water quality modeling, water management, precipitation forecasting, hydrological time series, and reservoir operations (ASCE 2000). Licznar and Nearing (2003) developed a NN model to predict soil loss from 2,879 erosion events on plots located at eight sites in the eastern United States. They compared measured erosion with pre-dicted values using the WEPP model and NN models trained using a subset of the erosion events. The NN model provided a better prediction of soil loss than the process-based WEPP model. Kim and Gilley (2008) developed and evaluated NN models for pre-dicting soil erosion and nutrient concentrations in runoff from animal waste land application sites under simulated rainfall. Com-parison of predicted versus measured values resulted in coefficient of determination values (R2) ranging from 0.62 to 0.92. Application of NN modeling to soil erosion prediction has not been exten-sively studied and does not appear to have been applied to furrow irrigation.
The objective of this project was to investigate development and performance of a multilayer perceptron feed-forward NN to predict sediment loss resulting from furrow irrigation using a large data set representing a variety of soil, crop, and environmental conditions.
Materials and Methods
Furrow irrigation sediment loss data used to develop, train, validate, and test NN models to estimate sediment loss were obtained from a combination of published research reports, theses, and dissertations along with field data collected by the authors over three decades of field studies. Data sources used in this study are listed in Table1 along with general locations where the data were collected. Collec-tively 2,257 furrow sediment loss values were obtained covering a wide range of soil, field, and crop conditions spanning three continents, with the majority of the data obtained from Fornstrom and Borrelli (1985) and the authors’past field studies. Nine initial independent variables were considered: freshly cultivated or previ-ously eroded prior to irrigation; compacted by wheel traffic or noncompacted; irrigation duration (T, h); cumulative number of prior irrigations; furrow length (L, m), inflow (Q, L min−1), and
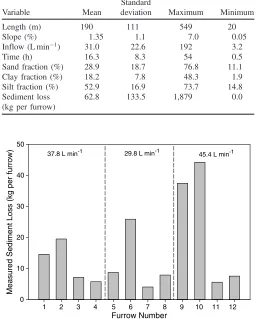
slope (S, %); and soil sand and clay fractions (%). The collec-tive furrow irrigation sediment loss data set represents surface irrigation–induced erosion across a wide range of hydraulic, soil, and cropping practices (Table2). Average furrow irrigation sedi-ment loss for the data set was 62.8 kg per furrow with a standard deviation of 133.5 kg per furrow, double the average value, which reflects the inherent variability in furrow sediment loss and the wide range of values present in the data set (0–1,879 kg per furrow). Furrow irrigation sediment loss can vary by nearly an order of mag-nitude (Fig. 2) between adjacent furrows in the same field with the same inflow rates, which makes sediment loss prediction chal-lenging with any model. The data set included 890 values for compacted (wheel) furrows and 1,367 values for noncompacted (nonwheel) furrows. There were 1,075 values for freshly tilled fur-rows and 1,182 values for previously eroded furfur-rows. There were 1,682 values for silt loam, 20 for sandy clay loam, 68 for clay loam, 203 for loam, and 284 for sandy loam soils.
Data from some sources were incomplete in regards to the se-lected variables so some were estimated based on existing data and standard cropping practices at the time. For example, the on-farm Washington data set (King et al. 1984) was the most incomplete data set used. They expressed sediment loss in kg ha−1rather than kg per furrow and did not specifically include furrow spacing or irrigation duration. The data set did include Kostiakov infiltration parameters, infiltrated depth, deep percolation, inflow rate, length, and irrigation efficiency for each furrow evaluation. Sediment loss
Table 1.Data Sources Used in This Study along with General Locations Where the Data Were Collected
Data source General location
Number of furrows
Fornstrom and Borrelli (1985)
Worland, Powell, and Torrington, WY
745
King et al. (1984) Royal City, WA 190
Fitzsimmons et al. (1978), O’Donkor (1978), and Allen (1977)
Parma, Notus, Nampa, and Kimberly, ID
59
Lou (1994) Kimberly, ID 32
Tunio (1994) Ontario, OR 108
Fernández-G ´omez (1997) C ´ordoba and Seville, Spain
30
Araújo (2014) Ceará, Brazil 74
Trout (unpublished) Patterson, CA 318
Bjorneberg and Trout (unpublished)
Kimberly, ID 872
Table 2.Range of Hydraulic, Soil, and Cropping Practices in the Data Set Used in This Study
Variable Mean
Standard
deviation Maximum Minimum
Length (m) 190 111 549 20
Slope (%) 1.35 1.1 7.0 0.05
Inflow (L min−1) 31.0 22.6 192 3.2
Time (h) 16.3 8.3 54 0.5
Sand fraction (%) 28.9 18.7 76.8 11.1
Clay fraction (%) 18.2 7.8 48.3 1.9
Silt fraction (%) 52.9 16.9 73.7 14.8
Sediment loss (kg per furrow)
62.8 133.5 1,879 0.0
Furrow Number
1 2 3 4 5 6 7 8 9 10 11 12
Measured Sediment Loss (kg per furrow)
0 10 20 30 40 50
37.8 L min-1 29.8 L min-1 45.4 L min-1
Fig. 2.Furrow irrigation sediment loss measured by Fornstrom and Borrelli (1985) from a block of 12 noncompacted previously eroded furrows irrigated at the same time with three different flow rates
per furrow was estimated for an assumed furrow spacing of 76 cm. Irrigation duration was estimated by volume balance using esti-mated furrow spacing and given inflow rate, infiltrated depth, and irrigation efficiency provided in the report. The resulting irrigation durations were near multiples of 12 h, usually 24 h, which was described as common irrigation times on commercial farms in the study area, indicating realistic estimates of unknown parameters. Recently tilled furrows have a higher infiltration rate than furrows previously irrigated and eroded, affecting advance times and sedi-ment loss. For the Washington data set, Kostiakov infiltration val-ues for each furrow were used to estimate if the furrow was recently tilled or previously eroded prior to an irrigation event. In other cases, advance time was used to estimate if the furrow was recently tilled or previously irrigated and eroded. The cumulative number of prior irrigation events during the season was estimated when nec-essary based on estimated planting date and date of the irrigation event. For data sets where wheel traffic furrows were not specified, the data were assumed to be from noncompacted furrows. When not specified in published reports, soil texture was estimated based on study location using USDA soil survey data. Uncertainty added by estimating missing data was considered minimal and less impor-tant than securing a data set that represented a wide range of con-ditions across a diverse geographic area. The primary disadvantage of estimating unknown values is degradation of prediction perfor-mance of derived models due to addition of errors in the data set. Neural network development software NeuroIntelligence was used to develop, train, and evaluate NN models. 68% of the data set was used for training, 16% for validation, and 16% for testing. Furrow data records were assigned to the training and testing data sets randomly. Continuous input variables were linearly scaled to a range of−1to 1 using the maximum and minimum values of mea-sured variables in the composite data set (Table2), which is a nor-mal procedure for NN modeling to prevent large numbers from suppressing smaller values and premature saturation of hidden neu-rons impeding the learning algorithm (Kim and Gilley 2008). Binary data values (compacted and cultivated) were assigned −1 for false andþ1for true. A multilayer perceptron feed-forward NN architecture was used to estimate furrow irrigation sediment loss. Hidden layer neurons used a hyperbolic tangent activation function and the single output neuron used a logistic activation function. Neural network architectures having only one hidden layer with up to 30 neurons were evaluated. The quasi-Newton method with minimization of sum of square error (Haykin 2009) was used to train the network using the training data set. The best NN architec-ture (number of hidden layer neurons, input parameters) was selected based on maximizing model efficiency (ME) (Nash and Sutcliffe 1970), while using a minimum number of neurons to re-duce risk of overtraining the NN to the data. Model efficiency, which is commonly used for hydrologic model evaluation (Moriasi et al. 2007), is defined as
ME¼1−
P
ðyi−ypredÞ2 P
ðyi−yaveÞ2 ð1Þ
whereyi=ith data value;ypred= model predicted value foryi; and yave= mean of the data values. Model efficiency is similar to the correlation coefficient associated with linear regression in that its value ranges from−∞to 1. A value of 1 means the model is a per-fect fit to the data, but a negativeMEvalue signifies that the data mean is a better estimate of the data than the model.
The dependent variable, furrow sediment loss, was logarithmic transformed prior to linear scaling to eliminate the prediction of negative sediment loss (Kim and Gilley 2008). In addition to the nine independent input variables, three functional relationships
were individually evaluated as a possible additional input variable to improve neural network prediction performance. The functional relationships evaluated wereQ1.5,QSL−1, andQTL−1. Trial and error searching was used to determine the best combination of input parameters and number of hidden layer neurons.
Results and Discussion
Neural network models developed using the nine initial input parameters resulted in good ME values (∼0.6) for logarithm trans-formed furrow sediment loss, but when back-transtrans-formed the re-sulting ME values were typically less than 0.4. Neural network models developed without logarithm transformation of furrow sedi-ment loss also resulted in ME values typically less than 0.4, indi-cating there was no advantage in logarithm transformation of furrow sediment loss. The use of functional relationships Q1.5, QSL−1, and QTL−1 as input parameters also did not materially improve prediction performance of NN models. Consequently, log-arithm transformation of furrow sediment loss and the functional relationships were abandoned in further development of furrow sediment loss NN models. The large range in measured furrow sediment loss (0.0–1,879 kg per furrow), along with an associated high degree of variability in sediment loss among furrows during the same irrigation (Fig. 2), appeared to limit prediction perfor-mance of the NN models.
The potential application of a furrow irrigation sediment loss prediction model is estimating sediment loss reduction from a change in furrow irrigation management practice or more likely conversion from furrow irrigation to sprinkler irrigation or micro-irrigation. In practice, furrow irrigation sediment loss less than 5 kg per furrow per irrigation is uncommon, with the exception of late season irrigations, close growing crops, and sandy soils. Sediment loss greater than 300 kg per furrow per irrigation is excessive and certainly not sustainable due to the negative effects on agricultural production practice and environmental impact on runoff receiving water bodies. Therefore the furrow irrigation sediment loss data set was filtered to include only records with sediment loss in the range of1–300kg per furrow in an attempt to improve NN model pre-diction performance. Filtering the sediment loss data set eliminated 331 data records with about 2=3being <1kg per furrow and 1=3being>300 kg per furrow and had a minor effect on the cumulative distribution of furrow irrigation sediment loss values (Fig.3) for <300kg per furrow sediment loss. Prediction perfor-mance of NN models developed using the filtered data set increased ME to 0.55.
Comparison of NN predicted furrow irrigation sediment loss with measured sediment loss revealed that the number of prior irrigations had minimal influence on predicted sediment loss even though an effect was apparent in the data set. The architecture of the NN model was modified to consider the number of prior irrigations as a categorical rather than a continuous variable. Examination of the number of records for each irrigation event revealed that there were few data values for prior irrigations greater than eight. Con-sequently, irrigation number values greater than eight were grouped together as a single category (eight). Irrigation number was repre-sented in the revised NN model architecture as a one-of-N categori-cal value. Thus, eight inputs were added to the NN model, where irrigation number one through eight were separate inputs, with each assigned either a−1if false orþ1if true depending upon irrigation number of the data value. This increased the number of variables in the input layer to 16. Prediction performance of the modified NN model resulted in ME>0.65. Substituting silt fraction for clay fraction as an input variable along with multiple sequential training
sessions increased prediction performance to ME∼0.70, which likely represents about the best prediction performance that can be expected due to variability in furrow irrigation sediment loss field measurements in diverse regions not captured by the input varia-bles. Additional improvements in NN model prediction perfor-mance were not pursued as they were deemed to be incremental at best using the chosen NN architecture.
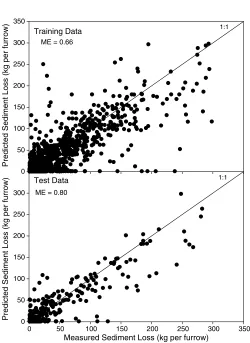
The final NN model architecture for predicting furrow irrigation sediment loss consisted of 16 input nodes, a single hidden layer with 19 nodes, and 1 output layer node, conventionally denoted as 16-19-1. Prediction performance of the NN model for the filtered training data set was ME¼0.66and ME¼0.80 (Fig.4) for the testing data set. The prediction performance of the NN model for the complete filtered data set (training, testing, validation com-bined) was ME¼0.70 (R2¼0.71) (Fig. 5). Visually, there ap-peared to be a slight tendency for the NN model to underpredict furrow irrigation sediment loss, especially for high sediment loss conditions. There were several instances with measured sediment loss for which the NN model predicted zero sediment loss, indicat-ing the furrow erosion processes were not fully represented. These uncaptured processes could include sloughing of furrow sidewalls or presence of head cutting that can contribute substantial amounts of sediment. These high sediment loss events are difficult to pre-dict by any model. Absolute furrow sediment loss prepre-diction of the NN model was5,10,20, and30kg per furrow for 35, 53, 72, and 85% of the combined filtered data set values, respec-tively (Fig.6).
Measured Sediment Loss (kg per furrow)
0 50 100 150 200 250 300 500 1000 1500 2000
Cumulative Fraction of Measurements
0.0 0.1 0.2 0.3 0.4 0.5 0.6 0.7 0.8 0.9 1.0
Full Data Set Filtered Data Set
Fig. 3. Cumulative distribution of furrow irrigation sediment loss values for the filtered data set used to develop NN models to predict furrow sediment loss compared to the full data set
Test Data
Measured Sediment Loss (kg per furrow)
0 50 100 150 200 250 300 350
Predicted Sediment Loss (kg per furrow) 0
50 100 150 200 250
300 ME = 0.80
Training Data
Predicted Sediment Loss (kg per furrow)
0 50 100 150 200 250 300 350
ME = 0.66
1:1
1:1
Fig. 4.Furrow irrigation sediment loss neural network model predic-tion performance on the training and test data sets
Measured Sediment Loss (kg per furrow)
0 50 100 150 200 250 300 350
Predicted Sediment Loss (kg per furrow)
0 50 100 150 200 250 300 350
ME = 0.70 1:1
Fig. 5.Furrow irrigation sediment loss neural network model predic-tion performance for the combined filtered training, validapredic-tion, and testing data sets
Error in Predicted Sediment Loss (± kg per furrow)
0 10 20 30 40 50 60 70 80 90 100
Cumulative Fraction of Values
0.0 0.1 0.2 0.3 0.4 0.5 0.6 0.7 0.8 0.9 1.0
Fig. 6.Cumulative probability distribution of absolute prediction error in neural network model estimated sediment loss
The furrow irrigation sediment loss NN model with 16 inputs, 19 hidden nodes, and 1 output node consists of 20 linear equations with a total of 343 coefficients and 20 nonlinear activation func-tions to evaluate. Solution of the NN model is impractical for a handheld calculator but could easily be coded into a standalone
program or a procedure added to a hydrological or geographical information system model.
The performance of the NN furrow irrigation sediment loss model surpassed results obtained in other studies using much smaller data sets. For example, Fornstrom and Borrelli (1985) obtained an
Furrow Length (m)
Number of Furrows
0 100 200 300 400 500
Furrow Slope (%)
Number of Furrows
0 100 200 300 400 500 600 700 800
Furrow Flow Rate (L min-1)
Number of Furrows
0 100 200 300 400 500 600 700
Irrigation Duration (hr)
Number of Furrows
0 200 400 600 800 1000
Sand Fraction (%)
Number of Furrows
0 200 400 600 800 1000
Silt Fraction (%)
0 50 100 150 200 250 300 350 400 450 500 550 0 1 2 3 4 5 6 7
0 25 50 75 100 125 150 175 200 0 10 20 30 40 50
10 15 20 25 30 35 40 45 50 55 60 65 70 75 80 10 15 20 25 30 35 40 45 50 55 60 65 70 75 80
Number of Furrows
0 200 400 600 800 1000
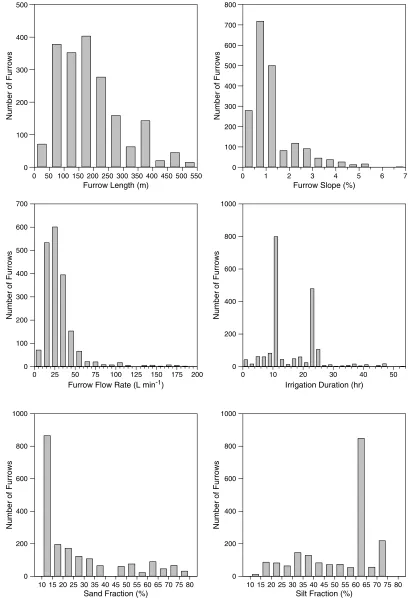
Fig. 7.Histograms of continuous input variables used to develop the neural network model
R2¼0.37for predicting seasonal furrow sediment loss using expo-nential regression on all furrows in their Wyoming study. They ob-tainedR2values as great as 0.62 using subsets of the data such as tilled noncompacted furrows. O’Donkor (1978) used multiple linear regressions to predict seasonal sediment loss with anR2>0.9based on a single year’s data from 60 furrows on medium textured soils in Idaho. Regression results, however, were not consistent across years or locations, limiting the ability of these regression relationships to predict sediment loss for fields that were not measured in the study. Predicted annual soil loss from the SISL model correlated relatively well with measured soil loss (R2¼0.73,ME¼0.62) for 30 mea-surements from three different studies (Bjorneberg et al. 2007). These results, however, were skewed by a few high soil loss values from one study and without these high values,R2¼0.40andME¼0.37.
The NN furrow sediment loss model is an empirical model and as such will not provide useful estimates of sediment loss for conditions beyond the numerical limits of the data base used to develop the model. Histograms of the continuous variables in the data base used to develop the model (Fig.7) provide some guid-ance in regards to practical input value limits that can be used in the NN model to obtain reliable estimates of sediment loss. The largest number of the furrow observations was for furrow lengths less than 300 m (Fig.7). The limited number of furrow observations with furrow lengths greater 300 m limits training of the NN model to the point that sediment loss predictions for furrow lengths greater than 400 m are likely subject to considerable error. Only about 25% of the furrow observations were for furrow slopes greater than 1.5% with very few observations for furrow slopes greater than 4% (Fig. 7). The limited number of furrow observations for furrow slopes greater than 1.5% resulted in very limited NN training for greater furrow slopes. Approximately 98% of the furrow observa-tions were for flow rates less than50L min−1, resulting in very lim-ited NN training for higher furrow flow rates. Irrigation durations on commercial farms are commonly a multiple of 12 h for convenience with longer set times used on longer furrow lengths. There were rel-atively few furrow observations in the data set with irrigation dura-tions exceeding 24 h (Fig.7), which further limited training of the NN model for longer irrigation durations. Nearly 50% of the furrow observations were for silt particle size fractions between 65 and 70% (Fig.7) despite having soil fractions spanning a large range. Simi-larly, nearly 50% of the furrow observations were for sand particle size fractions between 10 and 15%. From a practical application viewpoint, furrow irrigation sediment loss predictions of the NN model are probably limited to furrow lengths between 30 and 400 m, slopes between 0.1 and 4%, flow rates between 5 and75L min−1, and silt or sand particle–sized fractions between 0.1 and 0.75.
In addition to limits on input values based on the data set used for the NN model development, combinations of inputs that are not feasible in the physical world will result in a numerical output from the NN model due to its empirical nature. Input combinations such as a flow rate that will not advance to the end of the field can be input into the NN model and a value for sediment loss will be returned. While limits on input values can be easily imposed in computer code, infeasible combinations of inputs are much more difficult to screen. Inputs to the NN model should be checked for feasibility using a surface irrigation simulation model or be from field data of on-farm irrigation practices.
Conclusions
Artificial neural network modeling was applied to furrow irrigation to predict sediment loss as a function of hydraulic and soil condi-tions. A data set consisting of 1,926 furrow evaluations, spanning
three continents and a wide range of hydraulic and soil conditions, was used to train and test a multilayer perceptron feed-forward NN model. The final NN model consisted of 16 inputs, 19 hidden nodes in a single hidden layer, and 1 output node. Prediction performance of the NN model for the training data set was ME¼0.66 and ME¼0.80for the testing data set. The prediction performance for the complete data set of 1,926 furrow evaluations was ME¼0.70 with an absolute sediment loss prediction error of5,10,20, and 30kg per furrow for 35, 53, 72, and 85% of the data set values, respectively. Sediment loss prediction performance of the NN model surpassed the performance of previous sediment loss prediction models, either physical or empirical, for a much larger data set covering a wide range of hydraulic and soil conditions and geographic locations. The resulting furrow irrigation sediment loss prediction model is suitable for inclusion as a component of a water quality model.
Acknowledgments
The participation of L. Mateos was as part of the project CTM2013-45666-R (Spanish Program R+D+i).
References
Allen, R. G. (1977).“Water quality management with controlling furrow irrigation flow rates.”M.S. thesis, Univ. of Idaho, Moscow, ID. Araújo, D. F. (2014).“Medida da erosão na irrigação por sulcos com vistas
à conservação de água e solo.”Unpublished Ph.D. thesis, Univ. Federal do Ceará, Brazil (in Portuguese).
ASCE. (2000). “Artificial neural networks in hydrology: II hydrologic applications.” J. Hydrol. Eng., 10.1061/(ASCE)1084-0699(2000)5: 2(124), 24–137.
Berg, R. D., and Carter, D. L. (1980).“Furrow erosion and sediment losses on irrigated cropland.”J. Soil Water Conserv., 35(6), 267–270. Bjorneberg, D. L., Kincaid, D. C., Lentz, R. D., Sojka, R. E., and
Trout, T. J. (2000).“Unique aspects of modeling irrigation-induced soil erosion.”Int. J. Sediment Res., 15(2), 245–252.
Bjorneberg, D. L., Prestwich, C. J., and Evans, R. G. (2007).“Evaluating the surface irrigation soil loss (SISL) model.”Appl. Eng. Agric., 23(4), 485–491.
Bjorneberg, D. L., Strelkoff, T. S., Clemmens, A. J., and Lee, J. (2010).
“The current state of predicting furrow irrigation erosion.”Proc., 5th Decennial Irrigation Conf., ASABE, St. Joseph, MI.
Bjorneberg, D. L., Trout, T. J., Sojka, R. E., and Aase, J. K. (1999).“ Evalu-ating WEPP-predicted infiltration, runoff and soil erosion for furrow irrigation.”Trans. ASAE, 42(6), 1733–1742.
Carter, D. L. (1990).“Soil erosion on irrigated lands.”Irrigation of agri-cultural crops, B. A. Stewart and D. R. Nielson, eds., American Society of Agronomy, Madison, WI, 1143–1171.
Carter, D. L. (1993).“Furrow irrigation erosion lowers soil productivity.” J. Irrig. Drain. Eng., 10.1061/(ASCE)0733-9437(1993)119:6(964), 964–974.
Carter, D. L., Berg, R. D., and Sanders, B. J. (1985).“The effect of furrow irrigation erosion on crop productivity.”Soil Sci. Soc. Am. J., 49(1), 207–211.
Evans, R. G., Girgin, B. N., Chenoweth, J. F., and Kroeger, M. W. (1995).
“Surge irrigation with residues to reduce soil erosion.”Agric. Water Manage., 27(3–4), 283–297.
Fernández-G´omez, R. (1997).“La erosi ´on del suelo en el riego por surcos.” Unpublished Ph.D. thesis, Univ. of C´ordoba, Spain (in Spanish). Fernández-G´omez, R., Mateos, L., and Giráldez, J. V. (2004). “Furrow
irrigation erosion and management.”Irrig. Sci., 23(3), 123–131. Fitzsimmons, D. W. (1978). “Evaluation of measures for controlling
sediment and nutrient losses from irrigated areas.”Rep. No. EPA-600/ 2-78-138, U.S. EPA, Washington, DC.
Fornstrom, K. J., and Borrelli, J. (1985).“Sediment losses from furrow irrigated croplands in Wyoming.” Final Project Rep., Agricultural Engineering Dept., Univ. of Wyoming, Laramie, WY.
Haykin, S. (2009). Neural networks and learning machines, Pearson Education, Upper Saddle River, NJ.
Israelson, O. W., Clyde, G. D., and Lauritzen, C. W. (1946).“Soil erosion in small irrigation furrows.”Utah State Agric. Experiment Stat. Bull. 320, Utah State Univ., Logan, Utah.
Kemper, W. D., Trout, T. J., Brown, M. J., and Rosenau, R. C. (1985).
“Furrow erosion and water and soil management.”Trans. ASAE, 28(5), 1564–1572.
Kim, M., and Gilley, J. E. (2008).“Artificial neural network estimation of soil erosion and nutrient concentrations in runoff from land application areas.”Comput. Electron. Agric., 64(2), 268–275.
King, L. G., McNeal, B. L., Ziari, F. A., and Matulich, S. C. (1984).
“On-Farm improvements to reduce sediment and nutrients in irrigation return flow.”Rep. No. EPA-600/2-84-044, U.S. EPA, Washington, DC. Koluvec, P. K., Tanji, K. K., and Trout, T. J. (1993).“Overview of soil erosion from irrigation.”J. Irrig. Drain. Eng.,10.1061/(ASCE)0733 -9437(1993)119:6(929), 929–946.
Licznar, P., and Nearing, M. A. (2003).“Artificial neural networks of soil erosion and runoff prediction at the plot scale.”Catena, 51(2), 89–114. Lou, Z. (1994).“Sediment detachment in furrows under surge irrigation.”
Ph.D. dissertation, Univ. of Idaho, Moscow, ID.
Mateos, L., and Giráldez, J. V. (2005).“Suspended load and bed load in irrigation furrows.”Catena, 64(2–3), 232–246.
Moriasi, D. N., Arnold, J. G., Van Liew, M. W., Bingner, R. L., Harmel, R. D., and Veith, T. L. (2007). “Model evaluation guidelines for systematic quantification of accuracy in watershed simulations.”Trans. ASAE, 50(3), 885–900.
Nash, J. E., and Sutcliffe, J. V. (1970).“River flow forecasting through conceptual models of principles.”J. Hydrol., 10(3), 282–290. Nearing, M. A., Bradford, J. A., and Parker, S. C. (1991).“Soil detachment
by shallow flow at low slopes.”Soil Sci. Soc. Am. J., 55(2), 339–344. Nearing, M. A., Foster, G. R., Lane, L. J., and Finkner, S. C. (1989).
“A process based soil erosion model for USDA-water erosion prediction project technology.”Trans. ASAE, 32(5), 1587–1593.
NeuroIntelligence[Computer software]. Cupertino, CA, Alyuda Research. O’Donkor, J. (1978).“Physical and management factors affecting sediment loss from surface irrigated fields.”M.S. thesis, Univ. of Idaho, Moscow, ID.
Trout, T. J. (1996).“Furrow irrigation erosion and sedimentation: On-field distribution.”Trans. ASAE, 39(5), 1717–1723.
Trout, T. J., and Neibling, W. H. (1993).“Erosion and sedimentation proc-esses on irrigated fields.”J. Irrig. Drain. Eng.,10.1061/(ASCE)0733 -9437(1993)119:6(947), 947–963.
Tunio, A. F. (1994).“Evaluation of erosion and sediment loss in furrow irrigation with alternative practices.”M.S. thesis, Oregon State Univ., Corvallis, OR.
USDA NASS (U.S. Department of Agriculture National Agriculture Statistics Service). (2009).“Farm and ranch irrigation survey (2008).” Rep. No. AC-07-SS-1, Washington, DC.