P
P
E
E
R
R
F
F
O
O
R
R
M
M
A
A
N
N
C
C
E
E
O
O
F
F
A
A
N
N
O
O
P
P
T
T
I
I
M
M
U
U
M
M
A
A
U
U
T
T
O
O
R
R
E
E
G
G
R
R
E
E
S
S
S
S
I
I
V
V
E
E
S
S
P
P
E
E
C
C
T
T
R
R
A
A
L
L
E
E
S
S
T
T
I
I
M
M
A
A
T
T
I
I
O
O
N
N
M
M
E
E
T
T
H
H
O
O
D
D
B
B
A
A
S
S
E
E
D
D
O
O
N
N
S
S
I
I
G
G
N
N
A
A
L
L
L
L
E
E
N
N
G
G
T
T
H
H
A
A
b
b
a
a
s
s
s
s
T
T
a
a
i
i
w
w
o
o
,
,
T
T
i
i
m
m
o
o
t
t
h
h
y
y
O
O
l
l
a
a
t
t
a
a
y
y
o
o
Olabisi Onabanjo University - Nigeria, Department of Mathematical Sciences
Corresponding Author: Abass Taiwo, [email protected]
ABSTRACT: The spectrum of a time series is the distribution of variance of the series as a function of frequency and the objective of spectral analysis is to estimate and study the spectrum. Then, this research work focused on estimation of the spectrum and efficiency of some spectral estimation methods with respect to frequency content analysis of a medical time series data (Heart-beat readings). Modified information criteria for chosen an optimal model for autoregressive spectral estimation method were proposed. The performance of
the Periodogram, Thomson’s Multitaper and
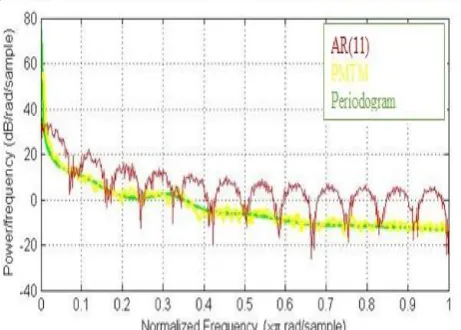
Autoregressive with burg spectral estimation were examined using 1000 heartbeat readings. From the results obtained, the proposed modified information criteria were used to select AR(9) as the optimal model and spectral estimates of AR(9) depicted the distinct spectral components not resolved by the Periodogram and Thomson’s Multitaper. The Thomson’s Multitaper method showed a better resolution that Periodogram but a close inspection revealed the existence of spectral leakage and it failed to resolved different spectral components along the frequencies. In conclusion, AR(9) showed a better spectral estimates and resolution along the frequencies and this made it better than Periodogram and Thomson’s Multitaper spectral estimation methods when analysis the frequency content of 1000 heartbeat readings.
KEYWORDS: Spectrum, Autoregressive model, Heartbeat, Spectral estimation methods, Periodogram and Thomson’s Periodogram.
1. INTRODUCTION
Spectral analysis is an approach of time series analysis that is used to analyse the distribution of variance of the series as a function of frequency ([Blo00]). The objective of spectral analysis is to estimate and study the spectrum. This approach as its foundation in Fourier analysis and has the capabilities of decomposing a given wide sense stationary time series in sinusoids or sine and cosine functions ([Kay88]). The estimation of the spectrum or the spectral density function involved the use of nonparametric and parametric methods.
The nonparametric spectral estimation methods are model free methods with certain shortcoming like inconsistent estimate large variance and spectral leakage but it is better when the signal is long
([D+99]). While the parametric spectral estimation approaches are capable of given consistent estimate, reasonably variance, better spectral estimate and high resolution but with shortcoming of how to choose the optimal model to be estimated ([Wei06]). The performance of both approaches on frequency analysis of long and short series has been discussed over the year by several researches and this include the work of ([MU10]) they compared the performances of some parametric and non-parametric spectral estimation methods using steganalysis of a sound signal. Their results indicated that Periodogram, Blackman and Tukey free model estimation methods showed a better performance as the length of the data increases while Yule-Walker and Modified Covariance methods performed better either with short or long length of sound signal data.
([GSV11]) explored the feasibility and accuracy of using Non-Parametric methods (Welch, Periodogram Algorithms) and Parametric methods (Burg, Yule-Walker, Covariance Algorithms) for the analysis of Electroencephalogram (EEG) signals to distinguish the EEG of an epileptic person from that of a normal person. They demonstrated that Parametric methods used in the research are superior to tradition-al non-parametric methods for PSD estimation and hence-forth for feature extraction in Electroencephalogram (EEG) signals. ([S+12]) summarized that it is very difficult to discuss and to make comparison between parametric and non-parametric spectral estimation methods since their capabilities varies from the length of signal and its characteristics.
Burg method has higher frequency resolution than Periodogram based on Fast Fourier Transform (FFT). They concluded that modern spectrum methods tend to produce better results than classical nonparametric methods when the available signal is relatively short though calculation is more complex. ([HH16]) discussed and reviewed the performance of four non-parametric and five parametric signal processing techniques with application in structural health monitoring. From their results, they concluded that the performance of nonparametric methods was highly affected by the length of sample signal while that of parametric methods is highly affected by the signal noise ratio. ([Son16]) studies the identification of random signal frequency using Autoregressive, periodogram and welch spectral estimation methods. The results from the study revealed that autoregressive parametric estimation method is more accurate than the classical power spectral estimation used. ([M+16]) tested four non-parametric methods and five non-parametric methods on clinical accelerometer data from 14 patients with different tremor disorders. Based on their results, non-parametric methods were showed to generally performed better than parametric methods when optimal dataset were used. Having reviewed several researchers, our findings revealed that the appropriate spectral estimation method for a particular signal depend on the characteristics, pattern and length of the signal.
([V+17]) used their research to predict quake occurrence using signal processing technique. Their result revealed the pure Periodogram outperformed the parametric spectral estimation used with respect to magnitude, wavelength, and frequency. ([T+17]) used their work to test the performance of three non-parameter (Periodogram, welch and Bartlett) and one parametric (AR) power spectrum density methods for calculating the time to be used in real-time during DBS surgery. The results were compared with different sets of parameters and the optimum methods were the non-parametric methods. ([KK18]) used their research work to detect and extract EEG features in 24 pediatric migraineurs and 19 control subjects using Welch and Yule-Walker spectral parameter estimation methods. They selected the features using genetic algorithm, and then given to a support vector machine and the linear discriminant analysis for the classification. There accuracy was calculated for all combinations having the dominant frequency and the correlated absolute power of each EEG wave band and for all wave bands combined. For their results, the highest migraine detection accuracy of 93% was obtained from Welch’s method for EEG feature extraction alongside support vector machine for a classifier while the Yule-Walker autoregressive method
showed a better performance than Welch method when only power bands were used as classification input.
In-hence, this research article will be used to compare the performance of Periodogram and Thomson’s Multitaper with autoregressive spectral estimation method where we intend to resolve the challenge of how to choose the optimal model to be estimated by proposing some information criteria based on the works of ([Aka70]), ([Aka74]), ([Sch78]). The performance of the methods will be tested with respect to spectral estimates and spectral resolution using 1000 Heartbeat readings observed at equal space and time of 0.05 second of a subject during an exercise.
2. MATERIALS AND METHODS
The spectrum or spectral density function can be expressed in continuous and discrete time series. These are given as
(1)
and
(2)
where is the autocovariance function and is the Fourier component ([Wei06]).
2.1. Nonparametric Spectral Estimation Methods
The nonparametric spectral estimation methods considered in this study are Periodogram and Thomson’s Multitaper methods. These are given as
2.1.1. Periodogram
For a time series sampled per unit time, the Periodogram is given as
(3)
where is the sampling interval, ([FK06]).
2.1.2. Thomson’s Multitaper
The Multitaper methods use k modified periodogram given with each one obtained using a different Slepian sequence as the window. The Thomson’s Multitaper is given by
where the kth Slepian sequence is the ([Tho82]), ([PW93]).
2.2. Parametric Spectral Estimation Method
The parametric spectral estimation method considered is autoregressive model with burg estimation methods derived by ([Par64]), ([Aka69]), ([Aka74]).
2.2.1. The Spectrum of Process
Given an autoregressive model ,
The spectrum of AR(p) is
(5)
2.3. Model Selection Criterion
Three information criteria were modified based on the works of ([Aka70]), ([Aka74]), ([Sch78]). The information criteria modified are
2.3.1 Final Prediction Error (FPE)
This is the first criteria proposed by ([Aka70]) and it is modified by replacing the variance of error by the sample autocorrelation function. It is denoted by
(6)
where is the power of the prediction error that decreases with while the term
increases with
2.3.2 Akaike Information Criteria
This is the most well-known criteria and it was proposed by ([Aka74]) and it is modified by replacing the variance of error with the sample autocorrelation function. It is denoted by
(7)
2.3.2. Schwartz’s SBC Criteria
([Sch78]) suggested the Bayesian information criteria and this was modified by replacing variance of error with sample autocorrelation function. It is defined as
(8)
where is an estimate of , is the number of parameters in the model and is the number of observations.
3. RESULT AND DISCUSSION
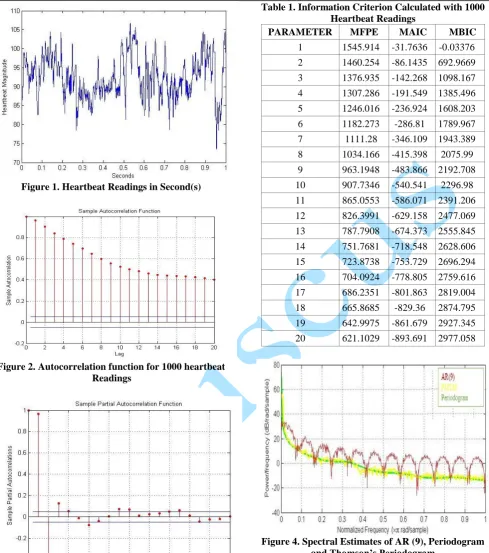
The performance with respect to spectral estimate and resolution of the modified information criteria for chosen optimal model in Autoregressive parametric spectral estimation methods was compared with that of Periodogram and Thomson’s Multitaper nonparametric spectral estimation methods using 1000 heartbeat readings of a subject during an exercise. The time plot of the 1000 heartbeat readings is given in Figure (1) and this exhibit a cyclic or periodic variation. Autocorrelation and Partial autocorrelation functions in Figure (2) and Figure (3) were used to choose tentative orders has AR(7), AR(9) and AR(11). The AR(9) was ascertained as the optimal model using the calculated modified information criteria calculated in Table 1. The frequency content of 1000 heartbeat readings was analysed using Periodogram, Thomson’s Multitaper and AR(9) spectral estimation methods with modified covariance and burg parameters estimators. The optimal model was chosen based on the smallest values of modified final prediction error, Akaike information criteria and Bayesian information criteria.
Figure 1. Heartbeat Readings in Second(s)
Figure 2. Autocorrelation function for 1000 heartbeat Readings
Figure 3. Partial Autocorrelation Function for 1000 heartbeat Readings
Table 1. Information Criterion Calculated with 1000 Heartbeat Readings
PARAMETER MFPE MAIC MBIC
1 1545.914 -31.7636 -0.03376
2 1460.254 -86.1435 692.9669
3 1376.935 -142.268 1098.167
4 1307.286 -191.549 1385.496
5 1246.016 -236.924 1608.203
6 1182.273 -286.81 1789.967
7 1111.28 -346.109 1943.389
8 1034.166 -415.398 2075.99
9 963.1948 -483.866 2192.708
10 907.7346 -540.541 2296.98
11 865.0553 -586.071 2391.206
12 826.3991 -629.158 2477.069
13 787.7908 -674.373 2555.845
14 751.7681 -718.548 2628.606
15 723.8738 -753.729 2696.294
16 704.0924 -778.805 2759.616
17 686.2351 -801.863 2819.004
18 665.8685 -829.36 2874.795
19 642.9975 -861.679 2927.345
20 621.1029 -893.691 2977.058
Figure 5. Spectral Estimates of AR (11), Periodogram and Thomson’s Periodogram
Figure 6. Spectral Estimates of AR (13), Periodogram and Thomson’s Periodogram
4. CONCLUSION
The performance of Periodogram, Thomson’s Multitaper and Burg Autoregressive spectral estimation methods were discussed with respect to their abilities to analyse the frequency content of 1000 heartbeat readings. In order to choose an optimal model for autoregressive spectral estimation, modified final prediction error, Akaike and Bayesian information criteria were proposed. From the results obtained, the modified information criteria was used to select AR(9) as the optimal model. The spectral estimates of AR(9) were better to than other methods. The Periodogram depicted the general trends in power distribution and are barely suitable for Heartbeat readings spectral analysis. The Thomson’s Multitaper method showed a better resolution when compared to Periodogram but a close inspection revealed the existence of spectral leakage and failed to resolved different spectral components along the frequencies. The lack of distinct components along the frequency would make the Thomson’s Multitaper not ideal for long heartbeat readings analysis. In conclusion, AR(9)
and even higher order showed a higher spectral resolution along the frequencies and this made it better than Periodogram and Thomson’s Multitaper spectral estimation methods when analysis the frequency content of 1000 heartbeat readings.
REFERENCES
[Aka69] H. Akaike – Power spectrum
estimation through autoregressive
model fitting, Annals of the Institute of Statistical Mathematics, Vol. 21, 407-419, 1969.
[Aka70) H. Akaike – Statistical predictor identification, Annals of the Institute of Statistical Mathematics, Vol. 22, 203-217, 1970.
[Aka74] H. Akaike – A new look at the
statistical model identification. IEEE
transactions on automatic control, Vol. 19, 716-723, 1974.
[Bat12] I. Batorova – Spectral Techniques for
Economic Time series, Ph.D. Thesis,
Comenius University, Department of Applied Mathematics and Statistics, Bratislava, Slovakia, 1-101, 2012.
[Blo00] P. Bloomfield – Fourier Analysis of Time Series, An Introduction, Raleigh: Wiley Series, 230-250, 2000.
.
[D+99] P. M. Djuric, S. M. Kay, K. M. Vijay, B. W. Douglas – Spectrum estimation
and modeling, Digital Signal
Processing Handbook, CRC Press LLC, 1999.
[FK06] S. A. Fulop, F. Kelly – Algorithms for
computing the time-corrected
instantaneous frequency (reassigned)
spectrogram with applications, Journal
of the Acoustical Society of America, Vol. 119, 360–371, 2006.
[GSV11] G. Girisha, B. Sonakshi, S. Vijander
– Assessment of non-parametric and
parametric PSD estimation n methods
for Automatic Epileptic seizure
detection, Journal of Computing, Vol.
3, 160 – 167, 2011.
[HH16] Q. Hossein, A. Hojjat – A comparative study of Signal processing methods for
of Vibroengineering, Vol. 18, 2186-2204, 2016.
[Kay88] M. Kay – Model Spectral Estimation Theory and Application, Prentice Hall, 1988.
[KP18] S. Kazemi, P. Katibeh – Comparison of parametric and Non-parametric EEG features Extraction methods in
Detection of Pediatric Migraine
without Aura, Journal Biomedical
Physics and Engineering, Vol. 3, 305-310, 2018.
[MT10] T. Matararioglu, U. Tatar – Digital
Forensics Analysis of Spectral
Estimation methods, Proc. of the 8th
Australia Digital Forensics Conference (126-134), Perth, Western Australia, Cowan University, 2010.
[M+16] O. C. Marizanera, J. W. Elting, J. H. van der Hoeven, N. M. Maurits – Tremor detection using parametric and
Nonparametric spectral estimation
methods: A comparism with clinical
measurement, PLoS ONE, Vol. 11,
1-15, 2016.
[Par64] E. Parzen – An Approach to Empirical
Time series modeling, IEEE Trans.
Automat. Control, AC-19, 723-730, 1964.
[PW93] D. B. Percival, A. T. Walden –
Spectral Analysis for Physical
Applications: Multitaper and
Conventional Univariate Techniques,
Cambridge, UK, Cambridge University Press, 1993.
[Sch78] G. Schwartz – Estimating the
Dimension of a model, Annals of
Statistics, Vol. 6, 461 – 464, 1978.
[Son16] C. Song – Random Signal frequency identification based on AR model
Spectral estimation method,
International Journal on Smart Sensing and Intelligent system, 9(2), 884-908, 2016.
[S+12] F. Shiman, S. H. Safavi, F. M. Venaghi, M. Oladazimi, M. J. Safari, F. Ibrahim – EEG features Extraction using parametric and non-parametric
models, Proceedings of the IEEE,
EMBS, China, 66 – 70, 2012.
[Tho82] D. J. Thomson – Spectrum estimation
and Harmonic analysis, Proceedings of
the IEEE, 70, 1055-1096, 1982.
[T+17] A. Tepper, M. C. Kenrich, A. R. Schiaffino, A. Munoz, A. Gutierrez, J. G. Martinez – Selection of the
optimal Algorithm for Real-time
Estimation of Beta Band power during
DBS Surgeries in Patients with
Parkinson’s Disease, Computational
Intelligence and Neuroscience, 1-9, 2017.
[V+17] G. Visalakshmi, I. Praveen, K. S. Ramesh, S. K. Rao, V. L. Bharathi – Power spectrum Estimation of Seismic
Wave using Periodogram method,
International Journal of Pure and Applied Mathematics, Vol. 114, 191-199, 2017.
[Wei06] W. W. S. Wei – Time Series Analysis
Univariate and Multivariate Methods,
2nd ed. Addison Welsley: Pearson Press, 237-258, 2006.
[YXF13] X. Yang, Y. T. Xu, S. Fu – Classical and modern power spectrum estimation
for tune measurement in CSNSRCS,