Iran J Public Health, Vol. 47, No.9, Sep 2018, pp.1281-1291
Original Article
Modeling Spatio-temporal Malaria Risk Using Remote Sensing
and Environmental Factors
Muhammad Haris MAZHER, *Javed IQBAL, Muhammad Ahsan MAHBOOB, Iqra
ATIF
Institute of Geographic Information Systems, School of Civil and Environmental Engineering, National University of Sciences and Technology, Islamabad, Pakistan
*Corresponding Author: Email: [email protected]
(Received 15 Aug 2017; accepted 11 Nov 2017)
Introduction
Malaria is an important health problem with its endemic effects in 91 countries which consist of 40% of the world population (1). Malaria affects about 300-500 million people with 1.5 to 2.7 mil-lion deaths per year (2). Pakistan having vast irri-gational system and with lot of stagnant water during monsoon season providing an ideal con-dition for mosquitoes breeding (3). Malaria is the second most reported disease in Pakistan (4). In 2008, 4.5 million suspected malaria cases were reported with 104454 confirmed cases of malar-ia. In 2009, the total reported cases in the region were 5.7 million out of which 17% cases belong
to Pakistan (5). WHO in 2010 reported 6 coun-tries with high malaria transmission in the Eastern Mediterranean Region and Pakistan was one of them.
Mosquito habitat was predicted over the coastal plain of Chiapas, Mexico. Landsat TM satellite imagery was used to classify vegetation and water bodies. They identified low, medium and high larval habitat (6). Malaria risk areas were mapped by using temperature, precipitation, and land cover maps of Thailand. Nearly 53%, 28%, and 19% areas were categorized as high, medium, and low-risk malaria region, respectively (7).
Abstract
Background: Remote sensing have been intensively used across many disciplines, however, such infor-mation was limited in spatial epidemiology.
Methods: Two years (2009 & 2010) Landsat TM satellite data was used to develop vegetation, water
bod-ies, air temperature and humidity criterion maps to model malaria risk and its spatiotemporal seasonal vari-ation. The criterion maps were used in weighted overlay analysis to generate final categorized malaria risk map.
Results: Overall, 25%, 68%, 18% and 16% of the total area of Rawalpindi region was categorized as danger zone for Jun 2009, Oct 2009, Jan 2010 and Jun 2010, respectively. The malaria risk reached at its peak during the monsoon season whereas air temperature and relative humidity were the main contributing factors in seasonal variation.
Conclusion: Malaria risk maps could be used for prioritizing areas for malaria control measures.
Environmental factors play an important role in epidemiology of the vector-borne diseases. Mos-quitoes require suitable climatic and environ-mental conditions in order to complete their life cycle. Water bodies, temperature (8) forest cover (9, 10) and humidity (11, 12) are the main factors that influence malaria risk. Temperature has an immense effect on the survival and life cycle of malaria mosquitoes. At extreme temperatures (<20 °C and >40 °C), the chances of mosquitoes survival are very low. The number of days re-quired for extrinsic cycle increases at lower tem-perature thus shorten the extrinsic incubation time. Higher temperature increases the extrinsic incubation period in mosquitoes. While the number of blood meals and number of times mosquitoes lay eggs increase at higher tempera-ture (13).
Relative humidity also affects the life duration and feeding behavior of malaria mosquitoes. The life cycle of mosquitoes is shortened at low humidity (<50%) and hence there is no malaria transmis-sion (14). The optimum humidity level for mos-quito’s ranges was from 50% to 80% (15). Water bodies are necessary as these are the main breed-ing places for mosquitoes. Man-made dams and water pounds after heavy rainfall also provide suitable places for malaria mosquitoes breeding. The mosquito’s flight range is an important factor in modeling malaria risk. The flight range of mos-quitoes is limited to 1.2 to 1.5 km from their re-spective habitats. Therefore, 1.5 km area around water bodies and vegetation is considered as suit-able breeding areas for mosquitoes (16, 17). The use of remote sensing provides estimation of environmental and climatic parameters on regional basis which also accommodate the problem of var-iable topography. The objective of the current study was to model spatiotemporal variations of malaria risk region and compare results with malar-ia patient’s data provided by health department.
Materials and Methods
Study area
The study area Rawalpindi district is situated in northwestern part of Pakistan in the foothills of
the southern slopes of north-western edges of the Himalayas. The total area of the district is 5286 km² with the 4310280 population. About 53.3% of the total population lives in rural areas and 46.7% in urban areas.
The climate in the mountains is characterized as subtropical highland climate, while low lying are-as have a humid subtropical climate. Different regions of district Rawalpindi i.e. Murree and Kotli Sattian experience severe winter and mild summer due to its location on higher elevation (hilly areas) while other plain regions have hot and humid summer and mild winter. The tem-perature ranges from 3 °C in winter to above 39 °C in summer.
Data collection and analysis
Suspected malaria patients data of year 2009 and 2010 of four months (Jan to Apr, May to Aug and Sep to Dec) of malaria suspected cases from 131 government health centers in Rawalpindi district were collected from Directorate General Health Service (HS), Lahore. This data has been issued to the researcher by the Director General Health services through informed consent and approval of the University. Land Scan data was used for population assessment. Land Scan pop-ulation dataset was downloaded from the official U.S. ORNL website (https://www.ornl.gov/) and map was generated for the study area. The weather data (2009 & 2010) was obtained from Pakistan Meteorological Department. For map-ping environmental factors including vegetation cover, water bodies, temperature, and humidity, Landsat Thematic Mapper (18) was used (https://earthexplorer.usgs.gov/). Four images of 2009 and 2010 were used in this study.
Malaria incidence mapping
Malaria incidence maps were generated by using data of suspected malaria patients collected from 131 health centers of Rawalpindi District. The formula derived for malaria incidence per 1000 persons is as follow (19);
1000 Population Total patients malaria suspected No.of persons 1000 per incidence
Vegetation area mapping
Normalized difference vegetation index (NDVI) technique (NDVI varies from +1 to -1) was ap-plied to map the vegetation cover (20).
R NIR R NIR P P P P NDVI Where:
NDVI = Normalized Difference Vegeta-tion Index
PNIR = Reflectance in Near Infrared band
PR = Reflectance in Red band
Water body mapping
Supervised classification was performed to map the water bodies in the study area (21).
A 1.5 km buffer was applied on water pixels be-cause of the flight range of mosquitoes (16).
Land surface temperature
Landsat TM thermal infrared data provides 120 m spatial resolution land surface temperature map. The formula for converting digital numbers into radiant temperature is as follows (22): T (K) = 209.831+0.834DN- 0.00133 DN² where:
T (K) = radiant temperature
DN = digital number of analyzed pixel
For estimating land surface temperature, the emissivity correction was applied on radiant temperature. Emissivity corrected land surface temperature (23) was calculated using the follow-ing equation: 273 )ln T(K) ( + 1 T(K) Ts Where:
Ts= Land Surface Temperature in Celsius
λ = wavelength of emitted radiance and its value is 11.5μm
ϵ = emissivity=0.95
α = h c / K = 1.438 x 10⁻² mK
h = Planck’s constant = 6.26 x 10⁻³⁴Js
c = velocity of light = 2.998 x 10⁸m/sec
K = Stefan Boltzmann’s constant = 1.38 x 10 -23JK-1
The above equation was applied on radiant tem-perature using raster calculator in ArcGIS to ob-tained land surface temperature.
Air temperature
Two anchor pixels “cold” and “hot” pixels were selected in the Landsat TM thermal imagery for the estimation of air temperature from land sur-face temperature. The land sursur-face temperature is approximately equal to near-surface air tem-perature at cold pixel.
dT≅ 0 Where:
dT = land surface temperature - air temperature
The difference between land surface temperature and air temperature approximately equals to zero in case of cold pixel. Hot pixel is basically the barren land pixel or pixel with highest land sur-face temperature. The difference between land surface temperature and air temperature ob-tained from weather station was calculated for this pixel. The dT range was calculated by sub-tracting dT at cold pixel from dT at hot pixel. LST range was calculated by subtracting lowest land surface temperature from highest land sur-face temperature. The dT factor was calculated by dividing dT range from LST range. The dif-ference between land surface temperature and air temperature was linear (24, 25). This linear rela-tionship was used to convert the whole land sur-face temperature raster into air temperature for the study area.
Relative humidity
The saturated water vapor pressure was calculat-ed from air temperature maps. The formula for saturated partial water vapor pressure is as fol-lows (26):
es = 6.1121 x exp[(17.502 x Ta)(240.97 + Ta)-1]
where:
es = saturated partial water vapor pressure
Ta = air temperature in Celsius
The partial vapor pressure was calculated from weather station data by assuming the negligible horizontal gradient of vapor pressure at the time of acquisition of images. Partial vapor pressure
[5]
and saturated water vapor pressure from air temperature maps were used to calculate relative humidity. The relative humidity is the ratio of partial vapor pressure and the saturated partial vapor pressure. The formula for relative humidi-ty is as follows (27):
100 e
e RH
s where:
e = water vapor pressure
Weighted overlay analysis
Suitability assessment for malarial risk was as-sessed using weighted overlay analysis based on criterion maps. Each criterion map was assigned weight according to its relative importance by using Multi-Criteria Decision Analysis (MCDA) technique. On the basis of MCDA, the weighted sum model (WSM) was developed to model the malaria risk. In this method, overlay analysis was performed by multiplying each criterion map with its relative weight and summing them to-gether to get a risk map. According to expert’s opinion and literature review, weights of 0.35, 0.25, 0.25 and 0.15 were assigned to temperature, water bodies, humidity and vegetation, respec-tively (11).
Malaria Risk Map
= {( 𝑆𝑢𝑖𝑡𝑎𝑏𝑙𝑒 𝑇𝑒𝑚𝑝𝑒𝑟𝑎𝑡𝑢𝑟𝑒 × 0.35) + (𝑆𝑢𝑖𝑡𝑎𝑏𝑙𝑒 𝐻𝑢𝑚𝑖𝑑𝑖𝑡𝑦 × 0.25) + (1.5 𝑘𝑚 𝐴𝑟𝑒𝑎 𝑎𝑟𝑜𝑢𝑛𝑑 𝑊𝑎𝑡𝑒𝑟 × 0.25)
+ (1.5 𝑘𝑚 𝐴𝑟𝑒𝑎 𝑎𝑟𝑜𝑢𝑛𝑑 𝑉𝑒𝑔𝑒𝑡𝑎𝑡𝑖𝑜𝑛 × 0.25)}
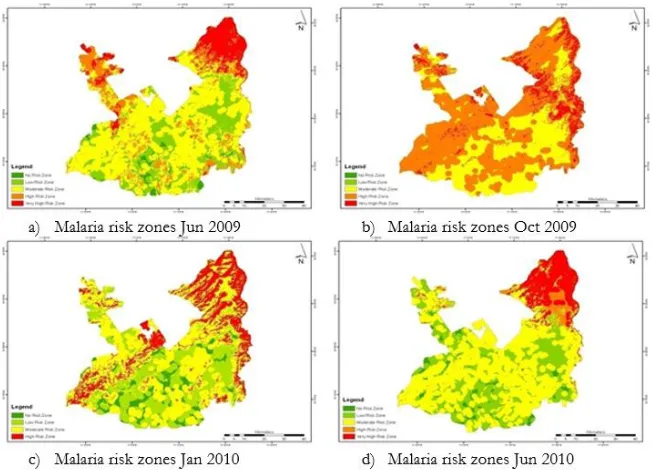
The composite layer was further reclassified into five risk classes i.e., Very High, High, Moderate, Low and No Risk Zone. Very high and high-risk zone were declared as danger zone and were ad-dressed in further analysis. In very high risk are-as, the effect of all the four criterion maps was significant and in high risk area, the effect of at least three criterion maps was significant.
Population at risk analysis
The population at risk analysis was performed using malaria risk maps and Land Scan popula-tion database of Rawalpindi district. The overall
population of study area and population in dif-ferent risk classes were obtained by using zonal statistics tool in ArcGIS 9.2.
Results
Criterion Maps
Suitability of malaria mosquitoes was assessed based upon four environmental factors, namely air temperature, relative humidity, water bodies, and vegetation. These four data layers were used to generate malaria risk maps as several research-ers used the same methodology for generation of risk maps (11, 16, 28, 29). The data layers were modified for the preparation of criterion maps with respect to their suitability. The LST of June 2009, Oct 2009, Jan 2010 and Jun 2010 were 19 °C to 43 °C, 17 °C to 42 °C, 7 °C to 29 °C and 27 °C to 52 °C respectively.
The LST maps were converted to air tempera-ture using the meteorological observed air tem-perature data (Fig. 1). The derived suitable air temperature range for all life stages of malaria mosquitoes is from 25 °C to 35 °C. Reclassification was performed to extract suita-ble air temperature range. The suitasuita-ble tempera-ture range was assigned new value “1” and unsuitable range was assigned “0” as a new val-ue.
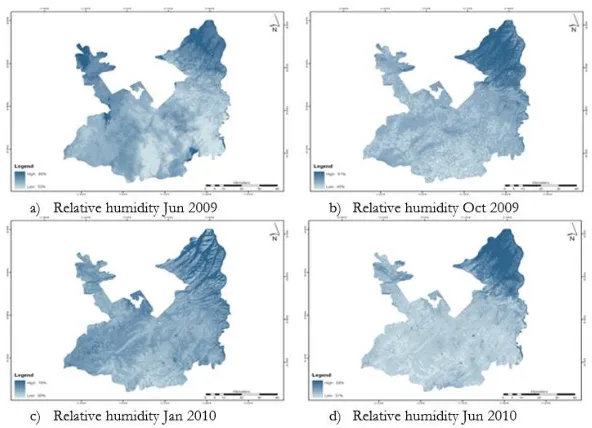
Saturated water vapor pressure was calculated from air temperature maps. Saturated water va-por pressure along with partial vava-por pressure from weather station was used to calculate air humidity maps. The relative humidity of Jun 2009, Oct 2009, Jan 2010 and Jun 2010 were 32% to 85%, 45% to 81%, 30% to 76% and 31% to 56%, respectively (Fig. 2).
Since the suitable relative humidity range is from 50% to 80% for malaria outbreak, new value of “1” was assigned to the range and rest of the pixels were assigned “0”.
Fig. 1: Air temperature temporal maps of Rawalpindi District
Fig. 2: Relative humidity map of Rawalpindi District
The 1.5 km area around vegetation cover and water bodies were considered suitable because of mosquito’s flight range. Therefore, 1.5 km buffer was applied on these two criterions.
Modeling malaria risk
The weighted overlay analysis was used to model malaria risk map by using environmental factors
maps along with their corresponding weights. Fig-ure 3 shows the malaria risk maps for Jun 2009, Oct 2009, Jan 2010 and Jun 2010, respectively.
Spatio-temporal variations in trend of malar-ia risk area
temporal changes of malaria danger zones in Rawalpindi district. The region was divided in-to16 zones (Table 1) whereas zone 1 shows areas
having danger zone in all four images and these are the highest priority areas in Rawalpindi dis-trict.
Fig. 3: Malaria risk zonation maps of Rawalpindi District
Fig. 4: Danger zone change detection from June 2009 to June 2010
Zones 2, 3, 4 and 5 show areas having danger zone in three out of four images and these areas are considered as the second highest priority are-as in district. Zones 6, 7, 8, 9, 10 and 11 show areas having danger zone in two out of four
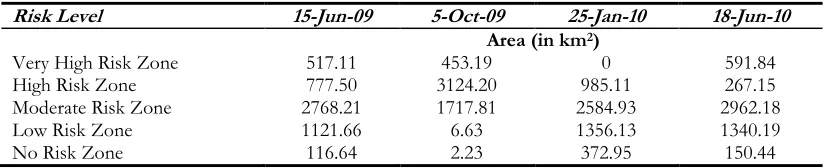
Kallar Syedan and Kahuta Tehsil. In monsoon season, the risk reached its peak and each tehsil had considerable amount of danger zone during that season. Table 2 shows area of different risk classes calculated from satellite images. In Octo-ber 2009, danger zone area and population at risk in danger zone were increased from 1294.61 km2
to 3577.39 km2 and 25% to 80% respectively and
malaria incidence was also increased from 2.003 per 1000 person to 8.493 per 1000 person during Sep to Dec 2009. There was significant decline in danger zone and population at risk from 3577.39 km2 to 985.11 km2 and 80% to 26% respectively
in Jan 2010.
Table 1: Possible month combinations along with their unique product values
Sr. No. Unique Product
Value Zones Combinations
1. 120 Zone 1 Jun 2009, Oct 2009, Jan 2010 and Jun 2010
2. 60 Zone 2 Oct 2009, Jan 2010 and Jun 2010
3. 40 Zone 3 Jun 2009, Jan 2010 and Jun 2010
4. 30 Zone 4 Jun 2009, Oct 2009 and Jun 2010
5. 24 Zone 5 Jun 2009, Oct 2009 and Jan 2010
6. 20 Zone 6 Jan 2010 and Jun 2010
7. 15 Zone 7 Oct 2009 and Jun 2010
8. 12 Zone 8 Oct 2009 and Jan 2010
9. 10 Zone 9 Jun 2009 and Jun 2010
10. 8 Zone 10 Jun 2009 and Jan 2010
11. 6 Zone 11 Jun 2009 and Oct 2009
12. 5 Zone 12 Jun 2010
13. 4 Zone 13 Jan 2010
14. 3 Zone 14 Oct 2009
15. 2 Zone 15 Jun 2009
16. 1 Zone 16 Danger Free Zone
Table 2: Risk zone areas calculated from risk maps of Jun 2009, Oct 2009, Jan 2010 and Jun 2010
Risk Level 15-Jun-09 5-Oct-09 25-Jan-10 18-Jun-10
Area (in km2)
Very High Risk Zone 517.11 453.19 0 591.84
High Risk Zone 777.50 3124.20 985.11 267.15
Moderate Risk Zone 2768.21 1717.81 2584.93 2962.18
Low Risk Zone 1121.66 6.63 1356.13 1340.19
No Risk Zone 116.64 2.23 372.95 150.44
This result was in agreement with malaria inci-dence data which abruptly dropped from 8.493 per 1000 person to 2.307 per 1000 person during that period. In Jun 2006, there was slight decrease in danger zone from 985.11 km2 to 858.99 km2
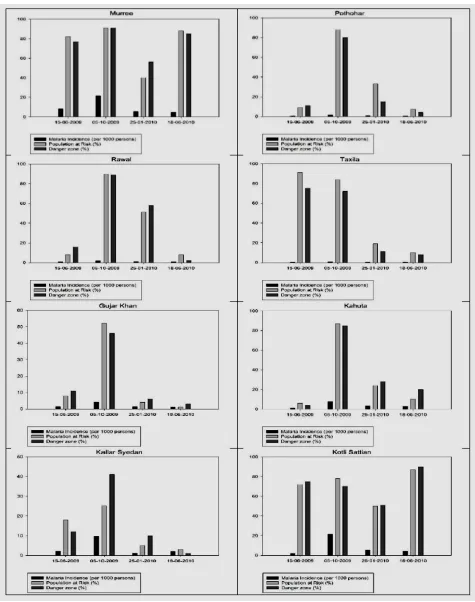
and malaria incidence was also decreased from 2.307 per 1000 person to 2.018 per 1000 person. Fig. 5 shows the percentage of danger zone and percentage of population lives in danger zone along with malaria incidence at that time in Muree, Kotli Sattian, Kahuta, Kallar Syedan, Gu-jar Khan, Pothohar, Rawal and Taxila tehsil re-spectively. The first four tehsils including Mur-ree, Kotli Sattian, Kahuta and Kallar Syedan
were facing high degree of risk throughout the year. The maximum danger zone was observed in Oct 2009.
This high degree of risk was not observed in other four tehsils of district due to lack of suita-ble climatic condition in these regions. These areas experienced high danger zone only in Oct 2009.
The temporal analysis of results indicates that danger zone area was increased from 1294.61 km2
to 3577.39 km2 from Jun 2009 to Oct 2009. This
increase could be due to suitable humidity and temperature for mosquitoes in October 2009.
Discussion
The strength of this study is that the combination of ground data, remote sensing data and GIS spa-tial modeling techniques aided in the identifica-tion and spatial distribuidentifica-tion of malaria severity and malaria risk zones in Rawalpindi region. The current study is one of the first to identify malaria environmental risk factors in a region with high malaria reported cases. The remote sensing ap-proach can readily be used on regional scales in other parts of the country to guide targeted laria control interventions to further reduce ma-laria transmission.
Air temperature and relative humidity were the main contributing factors in seasonal variation of malaria risk areas. While the contribution of wa-ter bodies and vegetation cover in seasonal varia-tion of malaria risk area was low. Water bodies and vegetation are perineal in nature and mostly present in the mountainous region of the study area. There is no doubt that water body plays a significant role in the life cycle, development and prevalence of malaria mosquitoes but in this study their contribution in the seasonal variation of malaria risk area is not as significant as com-pared to the presence of suitable temperature and relative humidity.
Some studies suggest the presence of water bod-ies as the major contributing factors in the
desig-nation of malaria risk area (30). These studies were conducted in tropical areas with large num-ber of water bodies/ponds compared to our study area. Another reason could be due to large spatial variation of air temperature and relative humidity across a region with significant varia-tion in topography (southern plain & Himalayan Mountains in the northern part of the district Rawalpindi). Remote sensing has been used in other studies for identification of malaria risk areas in other regions of the world. Some identi-fied factors include water bodies, and dam (31). In French Guiana meteorological and landscape data were used in mapping the density of Anopheles mosquitoes (32). In Dar es, Salaam higher malaria risks were associated with near-ness to dense vegetation, inland water, and wet/swampy areas while lower risk of infection was predicted in densely built-up areas.
Relationship between environmental variables es-timated by remote sensing and the spatial distribu-tion of seven mosquito species vectors of West Nile and other pathogens was established (33). However, none of these studies used such an ex-haustive set of remote sensing estimated environ-mental factors and ground data for mapping the malaria risk and its monthly temporal variations. A strong association was found between malaria patient data (malaria incidence per 1000 persons) obtained from the health department, danger zone (percent) map and population at risk (per-cent) map (Table 3).
For more accurate mapping of malaria risk areas, high-resolution satellite imagery should be used for mapping vegetation and water bodies.
Table 3: Correlation between reported (n=32) malaria incidents (per 1000 person) population at risk (%), and dan-ger zone (%)
Variables Malaria Incidence
(per 1000 persons) Population at Risk (%)
Malaria Incidence (per 1000 persons) 1
Population at Risk (percentage) 0.43** 1
Danger Zone (percentage) 0.47** 0.98**
Conclusion
Temperature and relative humidity were found to be the main contributing factors that influence malaria risk. In addition, temperature and humid-ity also significantly contribute to seasonal varia-tion of malaria risk areas. Remote sensing and GIS technology provided an efficient and inex-pensive method of mapping malaria risk area using Landsat TM imagery on fortnight basis. The finding of this study could be used by policymakers and planner to target priority areas with control activities (insecticide house spray-ing, larviciding).
Acknowledgements
The authors acknowledge the financial support of National University of Sciences and Technol-ogy, Islamabad, Pakistan for conducting this study.
Ethical considerations
Ethical issues (Including plagiarism, informed consent, misconduct, data fabrication and/or falsification, double publication and/or submis-sion, redundancy, etc.) have been completely ob-served by the authors.
Conflict of interest
The authors declare that there is no conflict of interests.
References
1. Allen RG, Tasumi M, Morse A, et al (2005). A Landsat-based energy balance and evapotranspiration model in Western US water rights regulation and planning. Irrig Drain,19(3-4):251-68.
2. Asare EO, Tompkins AM, Amekudzi LK, et al (2016). Mosquito breeding site water temperature observations and simulations towards improved vector-borne disease
models for Africa. Geospat Health,11(1 Suppl):391.
3. Bastiaanssen W, Noordman E, Pelgrum H, et al (2005). SEBAL model with remotely sensed data to improve water-resources management under actual field conditions. J Irrig Drain E-Asce, 131(1):85-93.
4. Boegh E, Soegaard H, Thomsen A (2002). Evaluating evapotranspiration rates and surface conditions using Landsat TM to estimate atmospheric resistance and surface resistance. Remote Sens Environ, 79(2-3):329-43. 5. Borgogno-Mondino E, Lessio A, Gomarasca
MA (2016). A fast operative method for NDVI uncertainty estimation and its role in vegetation analysis. Eur J Remote Sens, 49(1):137-56.
6. Haghdoost A (2004). Assessment of seasonal and climatic effects on the incidence and species composition of malaria by using GIS methods: University of London, 2004. 7. Kabaria CW, Molteni F, Mandike R, et al (2016).
Mapping intra-urban malaria risk using high resolution satellite imagery: a case study of Dar es Salaam. Int J Health Geogr, 15:26. 8. Kaya S, Pultz T, Mbogo C, et al (2002). The use
of radar remote sensing for identifying environmental factors associated with malaria risk in coastal Kenya. International Geoscience and Remote Sensing Symposium, Toronto, 2002
9. Ifatimehin OO (2009). Malaria risk mapping in Lokoja, Nigeria using Geoinformatic technology.
10. Keiser J, Utzinger J, De Castro MC, et al (2004). Urbanization in sub-saharan Africa and implication for malaria control. Am J Trop Med Hyg, 71(2 Suppl):118-27.
11. Khadim M (2002). Malaria a menace at Zhob Garrison. Pak Armed Forces Med J,52(2):203-7. 12. Kleinschmidt I, Omumbo J, Briet O, et al (2001).
An empirical malaria distribution map for West Africa. Trop Med Int Health, 6(10):779-86. 13. Kotwal RS, Wenzel RB, Sterling RA, et al (2005). An outbreak of malaria in US Army Rangers returning from Afghanistan. JAMA, 293(2):212-6.
15. Leder K, Black J, O'brien D, et al (2004). Malaria in travelers: a review of the GeoSentinel surveillance network. Clin Infect Dis, 39(8):1104-12.
16. Kleinschmidt I, Bagayoko M, Clarke G, et al (2000). A spatial statistical approach to malaria mapping. Int J Epidemiol, 29(2):355-61. 17. Levine RS, Peterson AT, Benedict MQ (2004).
Geographic and ecologic distributions of the Anopheles gambiae complex predicted using a genetic algorithm. Am J Trop Med Hyg, 70(2):105-9.
18. Smith SJ, Wigley T (2006). Multi-gas forcing stabilization with Minicam. Energy J, 27:373-91. 19. Lindsay S, Parson L, Thomas C (1998). Mapping
the range and relative abundance of the two principal African malaria vectors, Anopheles gambiae sensu stricto and An. arabiensis, using climate data. Proc Biol Sci, 265(1399):847-54. 20. Organization WH (2000). The African Summit on
Roll Back Malaria, Abuja, Nigeria. Geneva: WHO.
http://apps.who.int/iris/handle/10665/67815 21. Malvy D, Pistone T, Rezvani A, et al (2006). Risk of malaria among French adult travellers. Travel Med Infect Dis, 4(5):259-69.
22. Marj AA, Mobasheri MR, Valadanzouje MJ, et al (2008). Using satellite images in determination of malaria outbreaks potential region. http://citeseerx.ist.psu.edu/viewdoc/downlo ad;jsessionid=5BF2DD11CF23EA89E6F463 66DCCBD736?doi=10.1.1.672.6710&rep=re p1&type=pdf
23. Murtaza G, Memon IA, Memon AR, et al (2009). Malaria morbidity in Sindh and the plasmodium species distribution. Pak J Med Sci, 25(4):646-9.
24. Nath RK, Deb SK (2010). Water-body area extraction from high resolution satellite images-an introduction, review, and comparison. Int J Image Proc, 3(6):353-72. 25. Nihei N, Hashida Y, Kobayashi M, et al (2002).
Analysis of malaria endemic areas on the
Indochina Peninsula using remote sensing. Jpn J Infect Dis, 55(5):160-6.
26. Carpenter CC, Pearson GW, Mitchell VS, et al (1991). Malaria: obstacles and opportunities. National Academies Press.
27. Omumbo J, Hay S, Snow R, et al (2005). Modelling malaria risk in East Africa at high‐
spatial resolution. Trop Med Int Health,10(6):557-66.
28. Craig MH, Snow R, le Sueur D (1999). A climate-based distribution model of malaria transmission in sub-Saharan Africa. Parasitol Today,15(3):105-11.
29. Organization WH (2010). Global tuberculosis control: WHO report 2010: World Health Organization.
http://apps.who.int/iris/handle/10665/4442 5
30. Moss WJ, Hamapumbu H, Kobayashi T, et al (2011). Use of remote sensing to identify spatial risk factors for malaria in a region of declining transmission: a cross-sectional and longitudinal community survey. Malar J,10:163.
31. Adeola AM, Olwoch JM, Botai JO, et al (2017). Landsat satellite derived environmental metric for mapping mosquitoes breeding habitats in the Nkomazi municipality, Mpumalanga Province, South Africa. S Afr Geogr J, 99(1):14-28.
32. Adde A, Roux E, Mangeas M, et al (2016). Dynamical Mapping of Anopheles darlingi Densities in a Residual Malaria Transmission Area of French Guiana by Using Remote Sensing and Meteorological Data. PLoS One,11(10):e0164685.
33. Roiz D, Ruiz S, Soriguer R, et al (2015). Landscape Effects on the Presence, Abundance and Diversity of Mosquitoes in
Mediterranean Wetlands. PLoS