Flow Cytometry: Basic Principle and Applications in
Biotechnology and Pharmacy
1
Hitesh Jagani,
2Amit Kumar,
1Sagar S. Gang,
1Karteek Hebbar,
3Sahil Talwar.
1
Department of Pharmaceutical Biotechnology, 2
Department of Pharmaceutics, 3
Department of Pharmacology,
Manipal College of Pharmaceutical Sciences Manipal University, Manipal, Karnataka, India.
Summary
The use of flow cytometry is extended in each and every area of science. Flow cytometry is a powerful technique for correlating multiple characteristics of a single cell. This qualitative and quantitative technique has made the transition from a research tool to standard clinical testing. The term cytometry refers to the measurement of physical and/or chemical characteristics of cells or other biological samples. Thus this process employs the fluidic flow of a biological sample to identify quickly and accurately the sample characteristics. Sensing is conducted by using an optical sensor where the laser light source beam interacts with each individual cell which will produce light scattering or fluorescence. Flow cytometry uses fluorescence and scattering to analyze a population of cells, organelles, or other similarly sized particles quantitatively. Flow cytometry can examine a multitude of biological parameters, such as particle size, cell type, DNA content, and enzymatic function at up to 10,000 cells per second. With the recent sequencing of a variety of microbial genomes, it is anticipated that flow cytometry will have an increasing role to play in studying the effects of gene expression and mutation on heterogeneity, and in resolving the interactions of genetics and physiology.
Introduction
Flow cytometry is a technique for counting, examining, and sorting microscopic particles suspended in a stream of fluid. It allows simultaneous multiparametric analysis of the physical and/or chemical characteristics of single cells flowing through an optical and/or electronic detection apparatus.
Flow cytometry offers the possibility for this type of specific and detailed analysis of cell populations. Flow cytometric assays have been developed to determine both cellular characteristics such as size, membrane potential, and intracellular pH, and the levels of cellular components such as DNA, protein, surface receptors, and calcium. Measurements that reveal the distribution of these parameters in cell populations are important for biotechnology, because they better describe the population than the average values obtained from traditional techniques.
Figure 1 Simplified scheme of flow cytometer (from Murphy 2006).
The key advantage of flow cytometry is that a very large number of particles can be evaluated in a very short time; some systems can run particles at rates approaching 100,000 particles per second while collecting 10 to 20 parameters from each particle. Finally, the principle of cell sorting in flow cytometry allows this technology to separate single particles/cells physically from mixed populations.
The most common detection system in flow cytometry uses fluorescent molecules that are attached by one means or another to the particle of interest. If the particle is a cell, such as a white blood cell, for example, the fluorescent probe might be membrane bound, cytoplasmic, or attached to nuclear material. It is a common practice to use monoclonal or polyclonal antibodies that recognize specific receptors on cells. By conjugating fluorescent molecules to these antibodies, it is possible to monitor both the location and number of these conjugated antibodies as they bind to cell receptors. Particles of almost any nature can be evaluated by flow cytometry. They can be very small, even below the resolution limits of visible light, because they can be detected by their fluorescent signatures. Similarly, depending on the structure of the flow cell and fluidics, particles as large as several thousand microns can be evaluated.
Flow cytometry is a technology that has impacted both basic cell biology and clinical medicine in a very significant manner. Flow cytometry was first used in medical sciences such as oncology (e.g., for diagnosis of cancer, chromosomal defect diagnosis) and haematology. Medical and clinical applications of flow cytometry still account for the vast majority of publications on this technique, but during the past few years it has also become a valuable tool in biology, pharmacology, toxicology, bacteriology, virology, environmental sciences, and bioprocess monitoring. The recent success of flow cytometry is based on commercially available flow cytometry equipment that is both robust and versatile, together with modern data acquisition and interpretation software, and tremendous successes in the development of various specific staining assays. This review gives a short introduction into the principles of flow cytometry and its application for different areas.
Basic Principle
Basically, a flow cytometer is a fluorescence microscope which analyses moving particles in a suspension. These are excited by a source of light (U.V. or laser) and in turn emit an epi-fluorescence which is filtered through a series of dichroic mirrors. Then, the in-built programme of the equipment converts these signals into a graph plotting the intensity of the epi-fluorescence emitted against the count of cells emitting it at a time given.
Fluidics system
Fig-3 Hydrodynamic focusing produces a single stream of particles.
One of the fundamentals of flow cytometry is the ability to measure the properties of individual particles. When a sample in solution is injected into a flow cytometer, the particles are randomly distributed in three-dimensional space. The sample must therefore be ordered into a stream of single particles that can be interrogated by the machine’s detection system. This process is managed by the fluidics system. Essentially, the fluidics system consists of a central channel/core through which the sample is injected, enclosed by an outer sheath that contains faster flowing fluid. As the sheath fluid moves, it creates a massive drag effect on the narrowing central chamber. This alters the velocity of the central fluid whose flow front becomes parabolic with greatest velocity at its centre and zero velocity at the wall. The effect creates a single file of particles and is called Hydrodynamic focusing. Also the introduction of a large volume into a small volume in order that it “focuses” along an axis is termed “Hydrodynamic focusing”. Under optimal conditions (laminar flow) the fluid in the central chamber will not mix with the sheath fluid. The flow characteristics of the central fluid can be estimated using Reynolds Number.
Where D = tube diameter,
V = mean velocity of fluid, p = density of fluid, and µ = viscosity of fluid.
Fig- 4 Basics of fluidics in flow cytometry. From left to right, flow chamber, a hydrodynamically focused fluid and an unfocused fluid where the increse of pressure widens the core and increases turbulance (from Murphy, 2006).
Without hydrodynamic focusing the nozzle of the instrument (typically 70 µM) would become blocked, and it would not be possible to analyze one cell at a time.
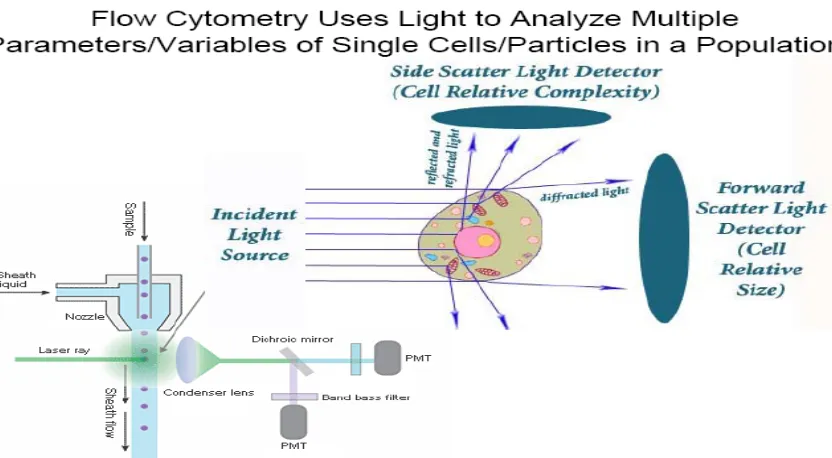
Optics and detection
After hydrodynamic focusing, each particle passes through one or more beams of light. Light scattering or fluorescence emission (if the particle is labelled with a fluorochrome) provides information about the particle’s properties. The laser and the arc lamp are the most commonly used light sources in modern flow cytometry. Lasers produce a single wavelength of light (a laser line) at one or more discreet frequencies (coherent light). Arc lamps tend to be less expensive than lasers and exploit the colour emissions of an ignited gas within a sealed tube. However, this produces unstable incoherent light of a mixture of wavelengths, which needs subsequent optical filtering. Light that is scattered in the forward direction, typically up to 20º offset from the laser beams axis, is collected by a lens known as the forward scatter channel (FSC). The FSC intensity roughly equates to the particle’s size and can also be used to distinguish between cellular debris and living cells. Light measured approximately at a 90º angle to the excitation line is called side scatter. The side scatter channel (SSC) provides information about the granular content within a particle. Both FSC and SSC are unique for every particle, and a combination of the two may be used to differentiate different cell types in a heterogeneous sample. Fluorescence measurements taken at different wavelengths can provide quantitative and qualitative data about fluorochrome-labeled cell surface receptors or intracellular molecules such as DNA and cytokines. Flow cytometers use separate fluorescence channels to detect light emitted. The number of detectors will vary according to the machine and its manufacturer.
Detectors are either silicon photodiodes or photomultiplier tubes (PMTs). Silicon photodiodes are usually used to measure forward scatter when the signal is strong. PMTs are more sensitive instruments and are ideal for scatter and fluorescence readings. Most cytometers use photomultiplier tubes (PMTs) as detectors for both fluorescence and scatter. The pulse of a particle crossing the excitation beam will depend upon the beam shape, beam intensity, and particle size, as well as the velocity of the particle.
wavelength and ‘band pass’ transmit light within a specified narrow range of wavelengths (termed a band width). All these filters block light by absorption.
Fig- 5 Light source, Light scatter and Fluorescence
When a filter is placed at a 45º angle to the oncoming light it becomes a dichroic filter/mirror. As the name suggests, this type of filter performs two functions, first, to pass specified wavelengths in the forward direction and, second, to deflect blocked light at a 90o angle. To
detect multiple signals simultaneously, the precise choice and order of optical filters will be an important consideration.
Signal processing
When light hits a photo detector a small current (a few microamperes) is generated. Its associated voltage has an amplitude proportional to the total number of light photons received by the detector. This voltage is then amplified by a series of linear or logarithmic amplifiers, and by analog to digital convertors (ADCs), into electrical signals large enough (5–10 volts) to be plotted graphically.
Log amplification is normally used for fluorescence studies because it expands weak signals and compresses strong signals, resulting in a distribution that is easy to display on a histogram. Linear scaling is preferable where there is not such a broad range of signals e.g. in DNA analysis. The measurement from each detector is referred to as a ‘parameter’ e.g. forward scatter, side scatter or fluorescence. The data acquired in each parameter are known as the ‘events’ and refer to the number of cells displaying the physical feature or marker of interest.
Fig-7 Schematic overview of a typical flow cytometer setup
Applications of flow cytometry
• Multiplexing immunoassays
¾ Functional assays 9 Oxidative burst 9 Phagocytosis
9 Tumour drug resistance
• Multiparameter Immunophenotyping ¾ Chronic lymphoid leukemias ¾ Immunophenotyping
¾ Acute leukemias – Lymphoblastic / Myeloblastic ¾ NHL & Plasmacytic neoplasias
¾ Hodgkin’s disease
• Proliferation antigens ¾ Ki67 protein
¾ Proliferating cell nuclear antigen ¾ p105 antigen
¾ Others-4F2,CD25,CD71
• Immunodeficiency ¾ HIV/AIDS
¾ Primary Immunodeficiency
• Transplantation
¾ Allograft dysfunction ¾ Anti- CD3 therapy
• Auto antibodies
¾ Autoimmune Thrombocytopenia
¾ Autoimmune and Alloimmune Neutropenia
• DNA quantitation methodology
• Cytogenetics & other molecular techniques
• DNA ploidy and proliferation fraction
• Measurement of intracellular cytokines
• Signal transduction pathways
• Measuring cellular function
Cellular parameters measurable by flow cytometry.
Intrinsic: size, shape, cytoplasmic granularity, auto fluorescence and pigmentation.
Extrinsic: DNA content, DNA composition, DNA synthesis chromatin structure, RNA, protein, sulphydryl groups, antigens (surface, cytoplaspic & nuclear), lectin binding sites, cytoskeletal components, membrane structure (potential, permeability & fluidity), enzyme activity, endocytosis, surface charge, receptors, bound and free calcium, apoptosis, necrosis, pH, drug kinetics, etc.
1. DNA analysis.
DNA-specific fluorochromes, are generally used for DNA analysis, have important differences against the fluorochromes used for conjugation to antibodies for staining the proteins of cells. In particular, whereas fluorescein, phycoerythrin (PE), and others are fluorescent whether or not they are bound to cells, the DNA fluorochromes fluoresce significantly only when they are bound to their target molecules. In addition, unlike the tight binding of antibody to antigen, DNA fluorochromes are generally in loose equilibrium between their bound and Free states. Therefore procedures for analyzing the DNA content of cells involve sending cells through the flow cytometer without washing them to remove the ``unbound'' fluorochrome. The unbound fluorochrome will not add to background fluorescence because it is hardly fluorescent unless bound to nucleic acid. And washing would, in any case, lower overall specific fluorescence by removing much of the fluorochrome (both bound and unbound) from the cell.
Examples of Nucleic Acid Binding Dyes
Dyes Specificities
Acridine orange DNA and RNA; metachromatic; permeant to
viable cells
Propidium iodide Double-stranded nucleic acids; impermeant
Thiazole orange DNA and RNA;
Permeant
Ethidium bromide Double-stranded nucleic
acids; impermeant
Chromycin A3 DNA with GC preference; impermeant
DAPI DNA with AT preference; slightly permeant
to viable cells
Hoechst 33342 and Hoechst 33258 DNA with AT preference; Hoechst 33342 enters viable cells well, Hoechst 33258 less well
7-Aminoactinomycin D (7-AAD)
DNA and RNA; GC preference; impermeant to viable cells
TO-PRO, TO-TO, PO-PO, PO-PRO, YO-YO, and YO-PRO series
DNA and RNA; Impermeant
SYTO series DNA and RNA;
Permeant
Chromomycin A3 is specific for the GC bases in DNA and therefore is an appropriate stain for use in conjunction with Hoechst 33258. Propidium iodide, although not very specific (it stains all double-stranded regions of both DNA and RNA by intercalating between the stacked bases of the double helix) and not able to penetrate an intact cell membrane, has the decided advantage of absorbing 488 nm light and then fluorescing at wavelengths above 570 nm. This means that, in the presence of RNase, propidium iodide can be used as a DNA stain in cytometers with low-power argon lasers. Propidium iodide has therefore become the most common DNA fluorochrome for flow analysis.
2. Chromosome sorting
In this case, the particles flowing through the system are individual chromosomes that are released from cells that have been arrested in metaphase. The released chromosomes are stained with a DNA stain (like propidium iodide) and then sent through the flow cytometer. The resulting histograms of fluorescence intensity reveal peaks whose positions along the x-axis are proportional to the amount of DNA in the chromosome and whose areas are proportional to the number of chromosomes with that particular DNA content. Histograms of this type are called flow karyotypes.
Karyotyping is the process of arranging chromosomes into pairs, which helps in detecting structural and numerical abnormalities. Chromosomes are important in understanding the structural and genetic characterization of any species in normal and pathological physiology. Chromosomes contain DNA, which in turn contains all the genetic information needed to carry out all of the biological processes within an organism. The human genome sequencing project benefited immensely with chromosome specific DNA libraries.
DNA measurement using a flow cytometer is done using fluorescent dyes that intercalate into the helical structure in a stoichometric fashion. The amount of fluorescence is directly proportional to the amount of DNA content of the cell. Typically a sample contains about 10000- 20000 cells. To build a chromosome library one microgram of DNA is needed, since human chromosome contains approximately only 65 fg of DNA, millions of sorted chromosomes are required (Ibrahim and van den Engh, 2004). Cytometric chromosomal analysis varies from the total DNA quantization, which also uses DNA specific fluorescent dye. However it yields the entire DNA content of cell as a single intensity value, fluorescent intensity directly proportional to DNA content. Flow cytometry karyotyping uses Propidium Iodide, a DNA binding dye which is excited using an appropriate laser. Each chromosome is of different size and hence the fluorescence intensity varies with the size of the chromosomes. Langlois and Jensen (1979) used two dyes with two different binding affinities for A/T and G/C nucleotides (ATCG- nucleotides are the building blocks of DNA). There will be difference in fluorescence emitted by A-T and C-G bound dye depending on the base pair ratio. This method allows you to analyze tens of thousands of chromosomes per second. The bivariate plot helps the researchers to directly detect abnormalities.
chromosomes are highly polymorphic, and flow karyotypes, therefore, vary considerably among normal individuals.
3. Cell cycle analysis
Normal cells will have more DNA than the 2C amount appropriate to their species at times when they are preparing for cell division. The cell cycle has been divided into four phases (fig-10). Cells designated as being in the G0 phase are not cycling at all; cells in G1 are either just recovering from division or preparing for the initiation of another cycle; cells are said to be in S phase when they are actually in the process of synthesizing new DNA; cells in the G2 phase are those that have finished DNA synthesis and therefore possess double the normal amount of DNA; and cells in M phase are in mitosis, undergoing the chromosome condensation and organization that occur immediately before cytokinesis (resulting in the production of two daughter cells, each with the 2C amount of DNA). A DNA flow histogram provides a snapshot of the proportion of different kinds of nuclei present at a particular moment. If we look at the DNA content of cells that are cycling (not resting), we will find some nuclei with the 2C amount of DNA (either G0 or G1 cells), some nuclei with the 4C amount of DNA (G2 or M cells), and some nuclei with different amounts of DNA that span the range between these 2C and 4C populations (Fig.16). The traditional method for analyzing cell division involves measuring the amount of DNA being synthesized in a culture by counting the radioactivity incorporated into DNA when the dividing cells are given a 6 h pulse with tritiated thymidine. The DNA histogram resulting from flow cytometric analysis offers an alternative to this technique. By dividing the histogram up with four markers, we can delineate nuclei with the 2C amount of DNA, those with the 4C amount of DNA, and those with amounts of DNA between the two delineated regions and therefore caught in the process of synthesizing DNA.
Flow cytometry does, however, offer a more direct way to measure DNA synthesis. Bromodeoxyuridine (sometimes abbreviated BrdU or BUdR or BrdUdr) is a thymidine analog. If cells are pulsed with BrdU, it will be incorporated into the cell's DNA in the place of thymidine. Fluorescein-conjugated monoclonal antibodies with specificity for BrdU are available so that cells that have been pulsed with BrdU for a short period of time (about 30 min) can then be treated to partially denature their DNA, exposing the BrdU within the double helix so that it can be stained with the anti-BrdU antibody. Any cells that have incorporated BrdU during the pulse will then stain fluorescein positive. The clever part of this technique is that the denatured DNA can be stained with propidium iodide at the same time. The red fluorescence axis shows the propidium iodide distribution (proportional to DNA content) with which we have grown familiar; the green fluorescence axis shows which of these nuclei have actually incorporated BrdU during the pulse. As might be expected, the cells in the middle region of the propidium iodide distribution have all incorporated BrdU; but a proportion of the cells at either end of the propidium iodide distribution have also done so. This method, while somewhat time consuming and a bit tricky technically, does allow a flow cytometrist to quantify the proportion of cells in S phase in a way that cannot be done accurately with simple propidium iodide staining.
The bromodeoxyuridine method is, in fact, more comparable than simple propidium iodide staining to the traditional method of measuring cell division by assaying the incorporation of tritiated thymidine. It also provides the ability to distinguish cells that may be blocked in S phase from those that are actually incorporating nucleotides. BrdU staining has also been used to provide information about the kinetics of cell cycles. If we consider cells pulsed for a short period of time with a small amount of BrdU and then killed immediately and stained with both propidium iodide and with a fluorescein-anti-BrdU monoclonal antibody, the fluorescein-antibody should stain equally all cells in S phase (stretching from the 2C peak to the 4C peak). If, however, we wait for some time before killing the cells (and if the BrdU has been used up quickly), then the cells that have incorporated the BrdU (that is, all the cells that were in S phase at the time of the pulse) will have synthesized more DNA, and some of those cells will have progressed into the G2 or M phase of the cell cycle (or indeed cycled back to G1). In addition, some new cells will have started to make DNA after the BrdU had been used up, and these cells will now be in S phase but will have DNA that does not contain BrdU. We can estimate the rate of movement of the BrdU-containing cells through S phase and into the G2 peak by assuming that they are evenly distributed throughout S phase at the time of pulsing and then sampling and staining the cells at one subsequent time. The rate of increase in propidium iodide intensity of the fluorescein-positive nuclei is equivalent to their rate of DNA synthesis and provides us with information about the cycle time of the actively dividing cells. Moreover, the cycle time of the fluorescein-positive cells, in conjunction with the proportion of cells in S phase, can be used to estimate the doubling time of a population of cells.
4. Study of Apoptosis
Cells often die by an active process that is an important part of the maintenance of organismal homeostasis. This process is called apoptosis. Apoptosis or programmed death can prevent the survival of potentially malignant cells with damaged DNA.
cytometry. One of the events is the flipping and stabilization of phosphatidylserine from the inner surface of the cytoplasmic membrane to the outer surface. On the outer surface, phosphatidylserine appears to identify cells as targets for phagocytosis. Because annexin V binds to phosphatidylserine, staining of intact cells with fluorochrome-conjugated annexin V will detect cells that are in early stages of apoptosis.
Unstained cells are alive and well and are the double negatives; they neither express phosphatidylserine on their surface nor take up propidium iodide through leaky membranes. Cells that stain just with annexin V are apoptotic; they have begun to express phosphatidylserine on their surface, but have not yet gone through the process that leads to permeabilization of their cytoplasmic membrane.
Cells that stain both with propidium iodide and annexin V are necrotic (that is, dead); they take up propidium iodide and also stain with annexin V. With a permeable cell, the flow cytometer cannot tell us whether the annexin V is on the outside of the membrane (because the cells have gone through apoptosis before membrane permeabilization) or on the inside of the membrane (because the cells have died by the necrotic pathway without apoptosis).
Another event associated with apoptosis is the fragmentation of DNA due to endonuclease activation. This fragmentation results in the appearance of increased numbers of ``free ends'' on the DNA molecules in the cell. By incubating fixed and permeabilized cells with the enzyme terminal deoxynucleotidyl transferase (TdT) and with fluorochrome-labeled nucleotides, cells with greater numbers of DNA fragments incorporate more of the fluorescent nucleotides onto their increased number of termini. The resulting increased cellular fluorescence is indicative of an apoptotic cell. Appearance of positive cells in this TdT flow assay correlates well with the classic gel electrophoresis assay for apoptosis, where ``ladders'' of small DNA fragments are indicators of endonuclease activation. In a desperate attempt to find an acronym, this flow assay for apoptosis has been called the TUNEL assay (for Terminal deoxynucleotidyl transferase-mediated dUTP Nick End-Labelling). Propidium iodide staining alone can be used to detect later stages of apoptosis.
5. Study of Necrosis
Unlike apoptosis, which involves the scheduled and active coordination of metabolic processes, necrosis is a passive response to a toxic or injurious environment. Whereas in apoptosis the cell membrane remains intact until very late in the game, permeabilization of the cell membrane is an early event in necrosis. Because propidium iodide is excluded from entering cells by an intact plasma membrane and because it only fluoresces when intercalated between the bases of double-stranded nucleic acid, it will not fluoresce if it is added to a suspension of intact cells. The intact plasma membrane forms a barrier, keeping propidium iodide and nucleic acids apart. It is only when the outer membrane has been breached that the cells will emit red fluorescence. Propidium iodide (or other membrane-impermeant DNA fluorochromes) is therefore a stain (like trypan blue) that can be used to mark necrotic cells (on the reasonable but not necessarily valid assumption that cells with holes in their membranes large enough to allow the penetration of propidium iodide are actually dead according to other viability criteria and vice versa). By this method, cell viability can be monitored in the presence of various cytotoxic conditions.
membrane, they have a lower refractive index than living cells and therefore have forward scatter signals of lower intensity. For this reason, it is important not to use a gate or forward scatter threshold when analyzing a population for the proportion of dead and live cells.
The use of membrane-impermeant DNA fluorochromes to mark dead cells has a more routine application in simply allowing the exclusion of dead cells from flow analysis. This is important because dead cells have the habit of staining non-specifically when their broken membranes tend to trap monoclonal antibodies directed against surface antigens. Therefore a cell suspension including many dead cells may show high levels of nonspecific stain. By adding propidium iodide to cells just before analysis, the cells fluorescing red can be excluded from further analysis by gating on red negativity and only the living cells then examined for surface marker staining.
Fixed cells are, in fact, all dead and will therefore all take up propidium iodide even if some were alive and some dead before fixation. Ethidium monoazide offers an alternative to propidium iodide if cells will be fixed before flow analysis. It is a dye that, like propidium iodide, only enters dead cells. It has, however, the added advantage of forming permanent cross-links with DNA when photoactivated. Therefore, cells can be stained for surface proteins, incubated with ethidium monoazide under a desk lamp, washed, and then fixed. At the time of acquisition of data on the flow cytometer, red fluorescence will mark the cells that were dead before fixation.
6. Cell sorting
Cell sorting is a major application of flow cytometry, separating the cells from a heterogeneous population with precisely defined characteristics. Multiple parameters can be measured using flow cytometry, since it has multiple excitation and emission source. It can measure 5-10 parameters simultaneously; namely DNA content, protein content, size, Lipid content, antigenic properties etc. Measuring different parameters of a heterogeneous cell population helps in identifying rare cell group and also gives a multi dimensional representation of individual cells within a population. Electrostatic deflection is used in flow cytometry. The droplet containing cells of interest is charged at the point of illumination by determining the elapsed time between cell sensing and separating. Applying a predetermined charging voltage to the flowing stream containing a heterogeneous cell population is critical, and hence a droplet containing cells of our interest is separated. Once the droplet is charged it gets deflected by the high voltage deflection plates to its corresponding collecting cuvette.
High speed sorting, that requires a pressure of 200psi to generate high stream velocities of 50 (m/sec) permitting droplet generation at frequencies as high as several hundred kHz. But the mammalian cells with their thin membrane could not survive higher pressures. In another interesting application, “Cell Zapping”- unwanted cells are eliminated by a selective process.
7. Detection of microorganisms
stained (and resulting fluorescence intensity) is 102 less than that of a mammalian cell. The DNA content of the E. coli genome is about 10-3 times that of a diploid human cell. Hence, bright dyes and sensitive instrumentation are required for studies of bacteria. Nevertheless, reasonable DNA histograms of bacteria can be obtained by flow cytometry. Methods are being developed to investigate cell cycle kinetics, the effects of antibiotics, and the detection and identification of bacteria for clinical investigations.
Now a day, it is also possible to detect virus particles with flow cytometer with latest advancement. Representatives from several different virus families (Baculoviridae, Herpesviridae, Myoviridae, Phycodnaviridae, Picornaviridae, Podoviridae, Retroviridae, and Siphoviridae) are stained using a variety of highly fluorescent nucleic acid specific dyes (SYBR Green I, SYBR Green II, OliGreen, PicoGreen) and examined using a standard flow cytometer equipped with a standard 15 mW argon-ion laser. This rapid and precise assay represents a new and promising tool in the field of virology.
Flow cytometry (FCM) in combination with fluorescent probe technology is a rapid, sensitive, and quantitative technique to detect microorganisms and assess their viability. Quantitative information on the presence and viability of plant pathogenic microorganisms is valuable for risk assessment regarding disease transmission and disease development. FCM has been applied successfully in the fields of food microbiology, veterinary science, and medical research to detect and distinguish between viable and non-viable bacteria.
The brewing industry has long had an interest in applying flow cytometry to the microbiology of the brewing process. Hutter, et al, determined the purity of yeast cultures using immunofluorescence and flow cytometry, as well as using antibodies to discriminate the presence of other organisms in fermentations. More recently, flow cytometry has been applied in the wine industry to quantify wine yeast viability, bacteria viability, and to sort wine yeast populations.
8. Disease Monitoring/Profiling
Leukemia/Lymphoma Phenotyping
Fig- 9 Surface antigen changes during haematopoiesis. The upper plot is of T-lymphocyte maturation and the lower plot of B cells.
HIV/AIDS
numbers of cells from large numbers of patients became increasingly urgent. Flow cytometry is the obvious answer to this need.
Fig- 10. The number of T-helper (CD4-positive) lymphocytes (×103/cm3) in peripheral blood of a patient after infection with HIV. Cells <400 are significantly below the normal range; <100 indicates severe risk of clinical AIDS. Courtesy of LeÂonie Walker.
Erythrocytes and Platelets
Although the initial perceived need in the haematology laboratory for a flow cytometer was to aid in the rapid processing of samples from leukemic and HIV-positive patients, the presence of the cytometer has stimulated thought about new haematological applications. Although not yet in routine use for analyzing erythrocytes, flow cytometers have been shown to be useful for looking at red-cell-bound immunoglobulin (as a result of autoimmune disease, sickle cell anaemia, and thalassemia): The bound immunoglobulin on erythrocytes is detected by the use of fluorescent antibodies against human immunoglobulin. The staining of red cells for RNA content with a dye called thiazole orange has made possible the use of flow cytometry to count the reticulocytes (immature erythrocytes) present in blood samples from anaemic patients. Haematologists have also extended the use of flow analysis to platelets-those particles with low forward scatter that usually are ignored in flow cytometric applications because they fall well below the standard forward scatter threshold. Immunoglobulin bound to platelets can be measured with antibodies against human immunoglobulin (as in the detection of immunoglobulin on erythrocytes).
Cancer
Dioxin is a compound that is known to damage the immune system which in turn suppresses the response to a tumor in the body. The effect of this compound can be easily and accurately monitored using flow cytometry. Using a mouse as a subject and counting their T cells, we can compare a healthy specimen with one that has been injected with tumor cells. Specifically cytotoxic T-lymphocytes (CTLs) are being examined. The healthy mouse (low level of CTL) and the cancerous mouse (high level of CTL) are used as positive and negative controls in this experiment. When a mouse that was exposed to dioxin 24 hours before being injected with tumor cells is examined, a marked decrease in immune response is observed. In fact, their CTL level is only slightly higher than that of the healthy mouse.
9. Analysis of Protein.
Although many applications of flow cytometry involve the staining of cells for proteins expressed on the outer membrane, cells also have many proteins that are not displayed on their surface. With appropriate procedures, flow cytometry can provide a means to analyze these intracellular proteins. The outer cell membrane is impermeable to large molecules like antibodies; however, if we intentionally fix cells to stabilize proteins and then disrupt the outer membrane, the cells can be stained with fluorochrome-conjugated monoclonal antibodies against intracellular proteins. After time to allow the antibodies to pass through the now-permeabilized membrane, the cells are washed to remove loosely bound antibodies and then are run through the flow cytometer to measure their fluorescence intensity.
This intensity should, under good conditions, be related to the amount of the intracellular protein present. Dead cells have leaky outer membranes; they often show high nonspecific staining because antibodies get through the disrupted membrane and become trapped in the intracellular spaces. Therein lies a conflict in our ability to stain cells for intracellular proteins. Because antibodies of all types are easily trapped in the cytoplasm, there is greater potential for nonspecific staining of permeabilized cells than intact cells. The very procedure that we carry out to give access of the staining antibody to its target (intracellular) antigen actually increases the access of all antibodies to nonspecific targets. To lower this nonspecific background, antibody titers are critical and washing steps are important. Unfortunately, even with low antibody concentrations and careful washing, background fluorescence from isotype-control antibodies is often considerably higher on permeabilized than on intact cells. There is, in addition, a second problem. The procedures used for fixing and permeabilizing cells-to give the staining antibodies access to intracellular proteins-can modify or solubilise some antigens, thus destroying the stainability of the very proteins that are being assayed. To make matters worse, the protocol that works best for one antigen may entirely destroy a different antigen. This should not be surprising after consideration that ``intracellular'' includes proteins of many types and in many different environments. Some intracellular proteins are soluble, some are bound to organelle membranes, and some are in the nucleus. Therefore, methods for staining cells for intracellular proteins cannot be as standard or as dependable as the methods for staining surface proteins. They have to be individually optimized for the cells and the proteins in question.
the cells are permeabilized, but not so well that the intracellular antibody binding sites are masked or destroyed. Although ethanol and methanol can be used for fixation (by themselves or following another fixative), the most common fixative used prior to intracellular staining is formaldehyde. Formaldehyde is generally used at lower concentration and/or for a shorter period of time than for routine fixation of surface-stained cells (where fixation overnight in 1% formaldehyde is the [optional] last step of the procedure before flow cytometric analysis).
Formaldehyde (at 0.5-1.0%) for 10 min is a good suggested concentration and time for cell fixation, but lower or higher concentrations, for shorter or longer periods of time, might be required. This formaldehyde fixation does permeabilize the cytoplasmic membrane a bit (formaldehyde-fixed cells are permeable to small molecules), but proteins are often cross-linked too tightly for staining of intracellular proteins with antibodies. Therefore the fixation step is followed by a permeabilization step. Permeabilizing agents are usually detergents, such as Triton X-100, digitonin, NP40, or saponin, at concentrations of about 0.1%. Combined fixation/permeabilization reagents are also available as proprietary commercial reagents. With luck, the detergent will open up the cell enough so that the now-fixed proteins are accessible to the antibodies used for staining. It is first necessary to maximize the fluorescence intensity of cells that are known to possess the intracellular antigen (the positive control); fixation time and concentration need to be altered in combination with different detergent concentrations to increase the positive staining. It is then necessary to decrease the background staining (using cells stained with isotype-control antibodies) as much as possible; this is done by trying increasing detergent concentrations and washing the cells thoroughly in buffer that contains the detergent. In other words, the goal is to increase the signal-to-noise ratio.
EXAMPLES OF INTRACELLULAR STAINING
From the point of view of a flow cytometer, surface, cytoplasmic, and nuclear proteins are similar. The flow cytometer cannot ascertain the location of the source of fluorescence. In addition, the nuclear membrane has large enough pores that it provides little or no obstacle to staining once the outer, cytoplasmic membrane has been breached. Cells have been stained successfully for nuclear proteins related to proliferation (for example, PCNA, Ki-67, and various cyclins, which will be discussed in the chapter on DNA) and to tumor suppression (for example, p53, c-myc, and the retinoblastoma gene product).
They have also been stained for proteins bound to interior membrane surfaces (e.g., Bcl-2, multidrug resistance protein [MDR] and P-glycoprotein), and many strictly cytosolic proteins have been analyzed (like tubulin, haemoglobin, surface proteins that exist intracellularly at various stages of differentiation, and many cytokines). As an example of one of the more complex biological situations, we can use the staining of cytokines as an illustration. Cytokines are a diverse class of proteins that, in response to cell stimulation, are synthesized and then secreted by leukocytes. For example, when T lymphocytes are stimulated, either non specifically or by immunological triggers, they begin to synthesize interferon-γ in their endoplasmic reticulum, send the proteins to the Golgi apparatus, and then secrete the molecules into the environment for stimulation of neighbouring cells. To stain for intracellular interferon-γ, the usual technique is to stimulate cells with a biological trigger and then to incubate them with an inhibitor (brefeldin A or monensin) for several hours. These inhibitors block the normal secretion of proteins from the Golgi apparatus and thus allow the cytokine concentration to build up in the cell to levels that are detectable. After the incubation period, the cells are stained for any surface antigens of interest, fixed briefly in formaldehyde, permeabilized with saponin, and, finally, stained with a monoclonal antibody against interferon-g.
Fig.-12. Dot plots showing the staining of lymphocytes for intracellular interferon-γ in conjunction with an outer membrane stain (against CD8) to phenotype the cytokine- producing cells. Cells were stained for CD8 and then fixed with formaldehyde and permeabilized with saponin. The stimulus was PMA-ionomycin. Data courtesy of Paul Wallace.
Flow Cytometry Analysis of HER2 Expression
of several protein markers can be performed simultaneously using different types of non overlapping fluorescent dyes, for example to perform population dynamics studies.
The Anti-HER2 Affibody molecule is a highly specific affinity ligand that advantageously can be used for flow cytometry as a robust alternative to antibodies. The Anti-HER2 Affibody molecule is available as a biotin conjugated reagent for staining with streptavidin fluorescent dye or as a fluorescein conjugated reagent, which functions as a convenient one step reagent. The Anti-HER2 Affibody molecule is also available as an unconjugated reagent that is easily coupled to any thiolactivated fluorescent dye.
10. Organ Transplantation
Flow cytometry has been used in solid organ transplantation since 1983. Since that time there have been numerous technological advancements in this field. This method has developed into the most sensitive test available to detect anti-donor antibody. For that reason, many laboratories currently use flow cytometry to crossmatch the donor and the recipient. This technique has proven very useful in predicting graft failure in the initial stages and also rejection of the organ later on. This is done through an analysis of the patient’s serum to locate certain antibodies that might react unfavourably with the donor tissue. Specifically, flow cytometry is used to detect alloantibodies that may be present in the recipient’s system.
Future Applications
Because of constant changes and advancements, the flow cytometry becomes a powerful tool in the profiling and monitoring of many diseases. The Flowcytometry will be also in the water and food quality control industry. As advancements are made to detect microbial activity the use of flow cytometry will become more common for this application.
Interaction between carbon nanotubes and mammalian cells: characterization by flow cytometry and application
Conclusions
Flow cytometry is a general method for rapidly analyzing large numbers of cells individually using light-scattering, fluorescence, and absorbence measurements. The power of this method lies both in the wide range of cellular parameters that can be determined and in the ability to obtain information on how these parameters are distributed in the cell population. Flow cytometric assays have been developed to determine both cellular characteristics such as size, membrane potential, and intracellular pH, and the levels of cellular components such as DNA, protein, surface receptors, and calcium. Measurements that reveal the distribution of these parameters in cell populations are important for biotechnology, because they better describe the population than the average values obtained from traditional techniques.
Medical and clinical applications of flow cytometry still account for the vast majority of application of this technique, but during the past few years it has also become a valuable tool in biology, pharmacology, toxicology, bacteriology, virology, environmental sciences, and bioprocess monitoring. The recent success of flow cytometry is based on commercially available flow cytometry equipment that is both robust and versatile, together with modern data acquisition and interpretation software, and tremendous successes in the development of various specific staining assays.
Even though, flow cytometer is uneconomical, from application point of view it is cost effective.
References
1) Alice longobardi givan. Flow cytometry: first principles. Second Edition, Wiley-Liss, New York.2000 Pp. 45-115.
2) Angela m. crawley, Tanya katz, Karl parato and Jonathan b. Angel. IL-2 receptor g chain cytokines differentially regulate human CD8+ CD127+ and CD8+CD127- T cell division and susceptibility to apoptosis. International Immunology 2008; 21(1), Pp. 29–42.
3) Bakul i. dalal. Clinical applications of molecular haematology : Flow Cytometry in Leukaemias and Myelodysplastic Syndromes. JAPI 2007; 55-57.
4) Bleesing j.j., Fleisher T.A. Cell function-based flow cytometry. Semin Hematol 2002; 38, Pp. 169-78.
5) Bode A.P., Hickerson D.H.M. Flow cytometry of platelets for clinical analysis, Hematol. Oncol. Clin 2002; 46 (5), Pp.786-791.
6) Boothby, J. R. Kibler, S. Rech, and R. Hicks. Teaching phagocytosis using flow cytometry. Microbiology Education 2007;5, Pp. 36–41.
7) Brent T. Page, Christine E. Shields, William G. Merz and Cletus P. Kurtzman. Rapid Identification of Ascomycetous Yeasts from Clinical Specimens by a Molecular Method Based on Flow Cytometry and Comparison with Identifications from Phenotypic Assays. Jl of clinical microbio(2006) 44(9), Pp. 3167–3171.
8) Calman A. Maclennan, Felix Dzumani, Alinane Namarika, Peter Moons, Edward Senga, Malcolm E. Molyneux, Mark T. Drayson and James E. G. Bunn, Affordable Pediatric CD4 Counting by Flow Cytometry in Malawi. Cytometry B Clin Cytom 2008; 74 (4), Pp. 90–97.
10) Corina P.D., Brussaard Dominique Marie B., Gunnar Bratbak. Flow cytometric detection of viruses. J of Virological Methods 2000; 85; Pp. 175-182.
11) Covadonga Quiros, Monica Herrero, Luis A. Garcia and Mario Diaz. Flow cytometry application to segregated kinetic modelling based on the physiological states of microorganisms. Applied Environmental Microbiology Spain2007;10; Pp. 1128-1132. 12) Davies J., Smyth M., Martin J.H., Automated reticulocyte counting: evaluation of the
Coulter STKS Haematology Analyser reticulocyte counting function. Clin Lab Haematol 1997; 19, Pp.89-92.
13)Elenice Moreira Lemos, Izabelle Teixeira Gomes et al. Detection of Anti-Leishmania (Leishmania) chagasi Immunoglobulin G by Flow Cytometry for Cure Assessment following Chemotherapeutic Treatment of American Visceral Leishmaniasis. Clinical and vaccine immunology 2007; 14(5), Pp. 569–576.
14) G. Valet, Max-Planck. Past and present concepts in flow cytometry:
A European perspective. J of Biological Regulators and Homeostatic Agents 2003; 17, Pp. 213-222.
15) J. Paul Robinson. Flow Cytometry, Encyclopedia of Biomaterials and Biomedical Engineering 2004; 3; Pp. 630-642, Marcel Dekker, USA.
16) J.M.prewitt and M.L.Mendelsohn. The analysis of cell images,ANN, N.Y. Acad.sci., 1986; Pp 1035-1053.
17) Jeffrey L. Lange, Peter S. Thorne and Nancy Lynch. Application of Flow Cytometry and Fluorescent In Situ Hybridization for Assessment of Exposures to Airborne Bacteria. Applied and environmental microbiology 2007;63-4; Pp. 1557–1563.
18) Justen Manasa, Hazvineyi Musabaike, et al. Evaluation of the Partec Flow Cytometer against the BD FACSCalibur System for Monitoring Immune Responses of Human Immunodeficiency Virus-Infected Patients in Zimbabwe. Clinical and vaccine immunology 2007; 14(3), Pp. 293–298.
19) L.A.Kamentsky et al. Spectrophotometer: new instrument forultrarapid cell analysis, Science 1965; Pp.630-631.
20) L. Lipoglav E.K., G. Avgu Tin. Application of flow cytometry for ecological monitoring of the rumen microbial ecosystem. Folia Microbiology 2001; 46 (1), Pp. 53-55.
21) Lewis J. R., M. S. Kotur, O. Butt, S. Kulcarni, A. A. Riley, N. Ferrell, K. D. Sullivan, and M. Ferrari (2002), Biotechnology apprenticeship for secondary-level students: teaching advanced cell culture techniques for research. Cell Biol Educ , 1, Pp. 26–42.
22) Luiz G. Chitarra and Ruud W. Van Den Bulk. The application of flow cytometry and fluorescent probe technology for detection and assessment of viability of plant pathogenic bacteria. European Journal of Plant Pathology 2003; 109, Pp407–41.
23) M.J.Fulwyler. Electronic separation of biological cells by volume, Science 1965;Pp. 910-911.
24) M. P. G. Leers, R. H. M. G. Schoffelen, et al. Multiparameter flow cytometry as a tool for the detection of micrometastatic tumour cells in the sentinel lymph node procedure of patients with breast cancer. Journal of Clin Pathol 2002;55, Pp. 359–366.
25) Mandy F.F., Bergeron M., Minkus T. Principles of flow cytometry. Transfus Science 1995; 16, Pp. 303–14.
26) Marco Rieseberg, Cornelia Kasper Kenneth, F. Reardon, Thomas Scheper. Flow cytometry in Applied Microbiology and Biotechnology. Springer-Verlag. 2001; 56, Pp350–360.
28) Misha Rahman, Andy Lane, Angie Swindell, Sarah Bartram. Introduction to Flow Cytometry, Serotec Ltd, Oxford, UK. 2003; vol 2, Pp 3-34.
30) Navenot J.M., Merghoub T., Ducrocq R., Muller J.Y, Krishnamoorthy R, Blanchard D. New method for quantitative determination of fetal hemoglobin-containing red blood cells by flow cytometry: application to sickle-cell disease. Cytometry 1998; 32, Pp. 186–190. 31) Ochatt S.J., Muneaux E., Machado C., Jacas L., Pontécaille C. The hyperhydricity of in
vitro regenerants is linked with an abnormal DNA content in grass pea (Lathyrus sativus L.). J. Plant Physiol 2002;159; Pp. 1021-1028.
32) Ochatt S.J., Pontécaille C., Rancillac M. The growth regulators used for bud regeneration and shoot rooting affect the competence for flowering and seed set in regenerated plants of protein pea. In Vitro Cell. Dev. Biol.-Plant, 2000; 36, Pp. 188-193.
33) O’Gorman M.R. Clinically relevant functional flow cytometry assays, Clin. Lab. Med 1995; 21, Pp. 779-794.
34) O’Gorman M.R., Corrochano V. Rapid whole-blood flow cytometry assay for diagnosis of chronic granulomatous disease, Clin Diagn Lab Immunol 1995; 2; Pp. 227-232.
35) P. Jain, G. M. Giustolisi, S. Atkinson, M. O. Elnenaei, R. Morilla, K. Owusu-ankomah, F. Rafiq-Mohammed, E. Matutes, A. Wotherspoon, D. Catovsky. Detection of cyclin D1 in B cell lymphoproliferative disorders by flow cytometry. J of Clin Path 2002; 55; Pp.940–945.
36) Picard F., Gicquel C., Marnet L., Guesnu M., Levy J.P. Preliminary evaluation of the new hematology analyzer Coulter gen-s in a university hospital. Clin Chem Lab Med 1999; 37; Pp. 681-686.
37) R. Evans, M. M. Davidson, L. R. Sim, A. J. Hay. Testing by Sysmex UF-100 flow cytometer and with bacterial culture in a diagnostic laboratory: a comparison. J of Clinical Pathology 2006; 59, Pp. 661–662.
38) Recktenwald D.J. Introduction to flow cytometry: principles, fluorochromes, instrument set-up, calibration. J of Hematotherapy 1993; 2, Pp. 387–94.
39) Roesler J., Hecht M., Freihorst J., Lohmann-Matthes M.L., Emmendorffer A. Diagnosis of chronic granulomatous disease and of its mode of inheritance by dihydrorhodamine 123 and flow microcytofluorometry. European J of Paediatrics 2000;150,Pp. 161-165.
40) Robinson J.P., Darzynkiewicz Z, et al. Flow cytometry in drug discovery and development. Current Protocols in Cytometry 2000; Second Edition, John Wiley and Sons, NY, Pp 22-214.
41) Sherrif F. Ibrahim and Ger Van Den engh. Flow Cytometry and Cell Sorting. Advances in Biochemical Engineering/ Biotechnology 2007;106, Pp. 19-39.
42) Robert T. Schimke. Flow Cytometric Characterization of Antifolate Resistance in Cultured Mammalian Cells Using Fluoresceinated Methotrexate and Daunorubicin. cancer research 2004; 50, Pp. 4946-4950.