Simulink Component Recognition Using Image
Processing
Ramya R, Anand Kumar S, Krinish N K, Suraj V
ABSTRACT: In early stages of engineering design, pen-and-paper sketches are often used to quickly convey concepts and ideas. Free-form drawing is often preferable to using computer interfaces due to its ease of use, fluidity and lack of constraints. The objective of this project is to create a trainable sketched Simulink component recognizer and classifying the individual Simulink components from the input block diagram. The recognized components will be placed on the new Simulink model window after which operations can be performed over them. Noise from the input image is removed by Median filter, the segmentation process is done by K-means clustering algorithm and recognition of individual Simulink components from the input block diagram is done by Euclidean distance. The project aims to devise an efficient way to segment a control system block diagram into individual components for recognition.
Keywords: MATLAB, Median filter, K-means clustering algorithm
————————————————————
INTRODUCTION
Thisprojectpresentsanewcomputational model for automatically interpreting hand-drawnsketches of schematicdiagrams. Ourmodelemploysamulti-levelparsingand recognition architecture. Ourapproach a l l o w s userstocontinuously s k etc h withouthavingtoindicatewhenonesymbolendsandanewoneb egins. Additionally, i tdoes notrestrict thenumberof strokesinasymbol,ortheorderinwhichtheyaredrawn.
Hence,iteliminates many ofthe
unnaturalconstraintsimposedbyexistingsketch
understandingsystems, suchaslimitations t o single-stroke objects, orthe needfor userinvolvementinseparating d i f f e r e n t symbols.
EXISTING METHOD:
Ourapproach differsfromearliertechniquesinthat i t actsselectivelyintheearly
stagestoidentifyasmallsetofeasilyrecognizable―markersymbo
ls.‖ Thesemarkers
anchoraspatialanalysiswhichparsestheuninterpreted strokesintodistinct clusters, eachrepresentingasinglesymbol. Finally,asymbolrecognizer,informedbyclustering
anddomainspecificknowledge,isusedtofindthebestinterpreta
tionsofthestrokes. Wehavearguedthat
thisapproachhastheadvantageofquicklyguidingtherecognize r intherightdirectionwhilepreventing unfruitful explorations.
Thisworkemphasizes that t e c h n i q u e s a i me d at uncoveringtheunderlyingstruc ture ofasketch, s uc has preliminary
recognitionandstrokeclustering,canhaveasignificantbenefici alimpact
oncomputationalefficiencyandrecognitionaccuracy. Thecomputationalcostofthe
resultingsystemislowenoughtobesuitable forinteractive s k e t c h understanding.
PROPOSED METHOD:
Todemonstrateourtechniques, wehavebuilt SimuSketch, asketch-based interfaceforMatlab‘s Simulink package, and VibroSketch, asketch-based interface for analysingvibratory mechanicalsystems. Inboth systems,userscanconstruct f u n c t i o n a l e n g i n e e r i n g modelsbysimplysketching t h e m o n acomputer s c r e e n . Users cantheninteractively manipulatetheirsketchestochangemodelparameters andrun simulations.
PROJECT FLOW:
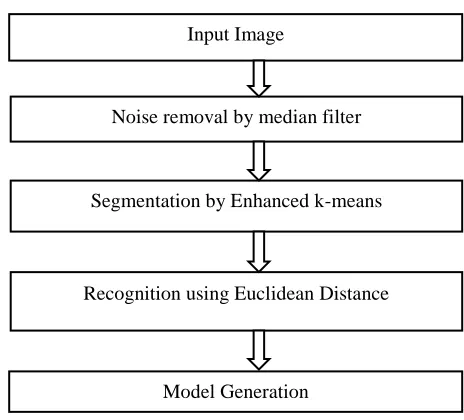
Fig 1.1 Flow of Project
The input image is scanned by the program. Noises are removed with the help of median filter. Objects on the image are segmented using K-means clustering algorithm.
Model Generation Input Image
Noise removal by median filter
Segmentation by Enhanced k-means
Recognition using Euclidean Distance
_________________________
Ramya R, Anand Kumar S, Krinish N K, Suraj V
Assistant Professor, Department of Electronics and Instrumentation Engineering, Sri Ramakrishna Engineering College, India
146 The separate objects are recognised as theirrespective
Simulink models. The new model is generated using the recognised components.
DIGITAL IMAGE PROCESSING
The Digital image processing is the use of computer algorithms to perform image processing on digital images. As a subcategory or field of digital image processing has many advantages over analog image processing. It allows a much wider range of algorithms to be applied to the input data and can avoid problems such as the build-up of noise and signal distortion during processing. Since images are defined over two dimensions (perhaps more) digital image processing may be modelled in the form of multidimensional systems.
GOALS OF DIGITAL IMAGE PROCESSING
The goal of digital processing is to improve the visualization of pathology by optimizing these physical parameters. Processing parameters need to be chosen correctly in order to overcome the inverse relationship between contrast and latitude while producing images that retain a conventional appearance. UMF is a simple technique for improving image quality. This technique, however, suffers from serious drawbacks, such as the suppression of pathologic lesions or artifacts that may simulate pathology. Manufacturers have developed different approaches in order to overcome problems and artifacts derived from this technique.
APPLICATIONS
Digital camera images
Digital cameras generally include dedicated digital image processing chips to convert the raw data from the image sensor into a colour-corrected image in a standard image file format. Images from digital cameras often receive further processing to improve their quality, a distinct advantage that digital cameras have over film cameras. The digital image processing typically is executed by special software programs that can manipulate the images in many ways. Many digital cameras also enable viewing of histograms of images, as an aid for the photographer to understand the rendered brightness range of each shot more readily.
Film
West world (1973) was the first feature film to use digital image processing to pixel late the android‘s point of view.
Intelligent transportation systems
Digital image processing has wide applications in intelligent transportation systems, such as automatic number plate recognition and traffic sign recognition.
COMPONENT RECOGNITION
There havebeennumerous effortstocreate experimental s k e t c h understandingsystems.
Thissectionbeginswithadiscussionofworkfocusedonsketch parsingandrecognition,andthensurveysexistingsketch based applications.
SYMBOL RECOGNITION
Graph basedmethods h a v e beenoneofthe
mostprominentapproaches t o object
representationandmatching,
andhaverecentlybeenappliedtohand drawn patternrecognition problems. With thesemethods,
sketched symbolsarefirstdecomposed
intobasicgeometricprimitives,suchaslinesandarcs,whicharet henassembledinto agraph structurethat encodesboth the intrinsic attributesofthe primitives and the geometric relationships between them. Patterndetection i s then formulateda s agraph-sub
graphisomorphismproblem,aproblemextensivelystudied bycomputer visionpractitioners. Thisapproach hasbeenusedtorecognize machine drawns y m b ol s , symbolsdrawn u s i n g templates, and precisehand-drawn symbols. Thismethodprovidesautomatictraining, althoughthe
drawingordermustbeconsistentacrossthetraining
examples. Thesesortsofgraph- based
approachesa r e sensitive tosegmentationerrors,
andgraphmatchingc a n be expensive.
Thismakesourapproachlesssensitivetosegmentationerrorsa nddrawing variations. Asan alternativeto graphicalm e t h o d s ,
therecognizeralsomakesuseofspecialgeometricpropertiesof
particularshapes. Asitishard-coded,
thisrecognizerisnoteasilyextended tonew symbols. Eachshapeisdescribedbyfour geometricfeaturescalculated fromthreespecialpolygonsdefinedbytheconvexhull
oftheshape.
Becausethisrecognizerworksfromtheconvexhullproperties,
itcannot distinguish
betweendifferentshapeswiththesameconvexhull.
SKETCH INTERPRETATION SYSTEM
Afewsketch-based interfaces
havebeendevelopedforinterpretingelectricalcircuit
sketches. Ituses hard-coded recognizersthat a s s u m e afixeddrawingorder. Also,the systemavoids issuesofparsing byrequiring theusertopause betweensymbols.
Gatesmustbedrawnineitheroneortwostrokes. It describesatrainable
recognizerforelectricalcircuitsymbols.Symbolsare
classifiedbycomparing asymbol‘sattributegraph tothat o f aprobabilistic m o d e l of eachlearnedsymbol. Inaddition toelectriccircuits,recentyearshaveseenthedevelopmentof experimental sketch-based interfacesforavariety ofotherdisciplines. The program‘staskisdetermine w h a t thegeometryof
thesketchshouldhavebeentomakethesketcheddevicebehave
asintended. Todo this, theprogram
employsanovelbehavioural
representation,calledqualitativecon- figuration space(qc-space), that captures the behaviour suggestedbyasketch while abstractingawaythe particulargeometry
usedtosuggestthat behaviour. The
programisconcernedonlywiththehigh-levelinterpretationof
thesketch,anddoesnot
PARSING
AND
RECOGNITION
ARCHITECTURE
Thisapproach hasanumber ofdistinct advantages. First, byfocusingonmarker symbolsearlyon,itavoidsunfruitful explorationsandquicklydirectstheanalysis in therightdirection.Second,theapproachprovidesaplatformfor
encodingcontextual knowledge.
Forexample,attheconclusionoftheclustering step,
thesystemcannarrow downthe set
ofpossibleinterpretationsfor eachsymbol. Thisbothincreasesrecognitionaccuracyandreducesrecogniti
oncost. Finally, oncetheinitial
analysisiscomplete,oursystemcanusedomainknowledge toidentifyandcorrecterrorsthat
mayhaveoccurredduringparsingandrecognition.Whilethere aremany differentdomains thatc a n makeuseofthe
mark-group- recognizearchitectureoutlined
above,thisthesisdemonstratesitsutility i n twodo- mains. The firstinvolvesnetwork diagramsinwhichasetofsymbols(nodes) areconnected b y a set ofarrows. The s e c o n d involvesvibratory mechanical s y s t e m s whichtypicallycontainobjectssuchasmasses,dam pers,springs,external forcesand grounds.
FEATURE EXTRACTION
Afterresampling, afeature vectoriscomputed formingtheinput totheneuralnet- work. Unlikethe speedinformation
u s e d inthepreviousrecognizer,thisrecognizer
usesinformationrelatedtotheinverse-curvatureoftheresampledstroke. Theinverse-curvatureisrepresented a s thecosineoftheanglesbetween linesegmentsconnectingconsecutivepoints.
Althoughthecosineis notpreciselythe inverse-curvature,itiscloselyrelated toit,andisthussuitable forourpurposes. Hence,thesametechniquesusedfor
identifyingthekey
pointsinthespeed-basedrecognizercouldbeusedinthisrecognizer.Basedonthe se keypoints, wecouldthen usethe samegeometric testsdescribed inSection4.2to decidewhether thestrokeisanarrow. Wehavetested thisidea,andfoundthat t h e performanceofthehard-coded
geometricteststobethesame,regardlessofwhether the keypoints aredetermined b a s e d onthe speedprofileorthe curvatureprofile.
Average
The average brightness of a region is defined as the sample mean of the pixel brightness within that region. The average, ma, of the brightness over the Λ pixels within a region (ℜ) is given by:
Avg=Σ a [m, n]
Alternatively, we can use a formulation based upon the (unnormalized) brightness Histogram, h (a) = Λ•p (a), with discrete brightness values a. This gives:
m = Σ a•h[a]
The average brightness, ma, is an estimate of the mean brightness, μa, of the underlying brightness probability distribution.
Standard deviation and Variance
The unbiased estimateof the standard deviation of the brightness within a Region with Λ pixels is called the sample standard deviation and is given by: Often, we want some information about the precision of the mean we obtained. We can obtain this by determining the standard deviation of the sampled mean. The standard deviation of the mean is related to the standard deviation of the distribution by:
Where N is the number of observations in the sample used to estimate the mean. This can easily be proven with (see basic properties of the variance):
Covariance
For the covariance approximation we use the first-order Taylor expansion in matrix form
h(Y) M h(Y) + Vh(Y) (Y - Y)
Where,
V = [& . . . 21 denotes the (row) gradient operator.
Taking the covariance' of both sides yields the following
Well known approximation
Cov {B} = Cov {h(Y)} M Vh(Y) Cov{Y} Vh(Y)
STROKECLUSTERING
This sectiondescribesanalgorithm t o locate the distincts y m b o l s inthe Simulinkdomain. Notethat thisstepisconcernedonlywithstrokeclusteringandnotrecogni tion. Recognitionisdeferreduntillater afteradditional s o u r c e s ofinformation, s u c h ascontext, have beenconsidered. The arrowanalysisidentifiesthe arrowsinthe sketchbutleavesthe restofthe strokesuninterpreted.Thegoalinthisstepistogrouptheuninte rpreted strokesinto differentclusterssuchthat eachclusterformsadistinct Simulinkobjectthat canbe subsequently r e c o g n i z e d . The keyideabehind strokeclusteringisthat s t r o k e s aredeemedtobelongtothesamesymbolonlywhentheyarespat ially proximate. The challengeisreliably determiningw h e n twopen strokes shouldbeconsidered
close together.
Here,werelyonthearrowstohelpmakethisdetermination. Innetwork diagrams,eacharrowtypically connectsasourceobjectatitstailtoatarget objectat itshead. Hence,differentclusterscanbe
identifiedbygroupingtogetherall thestrokes that
a r e neartheendof agivenarrow.
Ineffect,twostrokesareconsideredspatially proximate ifthenearest arrowisthesameforeach.
SYMBOLRECOGNITION
Thischapter
presentsanoverviewofthethreesymbolrecognizerswehavede
148 evaluationoftheadvantages a n d disadvantagesofeach.
Adetailed presentationofeachoftherecognizersiscontained inthefollowingchapters. Ashort d es c ri p ti on o f the firsttworecognizerswerepresented p r e v i o u s l y .
Image-BasedRecognizer
Thedevelopmentofthefirstrecognizerwasinspired bytechniquesfrom
imageprocessing.Symbolsareinternallyrepresented asquantized bitmap i m a g e s wecall―templates.‖ Each symboliscantered within its template, and isuniformly scaledto fillit, thus making the approach insensitive to uniform scaling. Onedistinct advantageofthis r e c o g n i z e r overtraditionalonesisthat i t canlearnnew definitionsfromsingle prototype examples. Anunknowntemplateis matched toadefinitiontemplate
usinganensembleoffourdifferentclassifiers. These classifiersareextensionsofthe followingmethods:
1. Hausdorffdistance
2. ModifiedHausdorffdistance 3 . Tanimoto coefficient 4 . Yulecoefficient
Theseclassifierswereoriginallyintendedformatchingprecisebi tmaps. These rankings arecombined, and the definition with the best combined scoreisselected. Inpractice, thecombinedperformanceisbetter t h a n thato f anyof theindividual classifiers.Toachieverotation invariance, therecognizerusesanovel. Polar coordinate analysisthat a v o i d s expensiverotations i n thedrawingcoordinates. Therecognizerisversatileinthat
weuseitbothforgraphicalsymbolrecognitionand digitrecognition.
K-means Clustering Algorithm of Segmentation The K-means is another simple algorithm of segmenting or classifying images into k different clusters based on feature, attribute or intensity value. It is computationally efficient and does not require the specification of many parameters as compared to other method of segmentation. Unlike local thresholding, which can only group into two main classes while K-mean Algorithm can group into k different classes and that is part of the reason why we chosen as segmentation method for this work. The classification is done by minimizing the sum of the squares of distances between data and the corresponding clustering centroid. Type of distance calculation compatible with K-means Algorithm includes Manhalanobis and Euclidean distance etc.
LIMITATION AND FUTURE WORK
Obviously,thisworkisonlyasmallsteptowardachievingtrulynat ural andpractical pen-based c o mpu te r i n t e r a c t i o n and therea r e many issuesthat r e m a i n uns ol ved . Someofthese issuesare notdi r e c t l y a d d r e s s e d b y this s t u d y . For instance, o u r techniques aredevelopedprimarily f o r 2Dsketches. Hence,itisnot clearwhether they canbeextended tosketches of3Dscenes. Likewise,ourtechniques aremost suitable forinterpreting―schematic‖ sketches, and are not particularlyusefulfor sketches that are ―artistic‖in nature. Also, although it would bean interesting study, this
workdoesnot investigate howwellourtechniques
canbeemployed in smallhand-held
devices,suchaspersonaldigitalassistants.
Insuchdevices,limited availability
ofcomputationalresources,suchasprocessorspeedandRAM
,willplace additional constraintson
thedesignofinteractiontechniques. Anotherareaofinterest maybetherecognitionof―static‖
i n p u t suchasscannedsketches. Insuchcases,the lackoftemporal dataleadingtothefinalsketchaddsanother levelofcomplexitynot addressedbythisstudy. Strokebeautification
wouldnotonlycleanupunwarrantedartefacts
inthesketcharisingfromtheimprecisionofthehumanhand,but couldalsoidentifyperceptually
dominantattributesofthestrokes,suchasperpendicularity
orenclosure. Wesuspectthat
t h i s couldsignificantlyaidsymbolrecognizers. Igarashi etal. presentasetoftechniques thatc a n beusefulinthis endeavour.
Similarly,morepsychologicallybasedapproaches,
suchasGestalt principles,orthose presented bySaundmaybeconsidered.
CONCLUSION
Our userstudies haveindicated
t h a t e v e n noviceuserscaneffectively
utilizethesesystemstosolverealengineeringproblems,without havingtoknowmuch about theunderlying recognitiontechniques. Toenhancetheuser‘s experiencewiththesesystems,
however,itmaybenecessarytoadjustsomeofourassumptions aboutdrawingstyles,
andimprovetherecognizersusedinthepreliminary
recognitionstep. Althoughthetechniquespresentedinour projectaredemonstratedintwodomains, wespeculate that they are applicable to other domains aswell,such
aselectrical circuitdiagrams,
linkagedesigntools,userinterfacedesignsoftware,etc.Webelie veour symbolrecognizersformausefulandpractical suiteoftechniquesfortherecognition ofmultistroke s y m b o l s ,andhencewehopeothersinthecommunity
c an makeuseofthem.
REFERENCES
[1] Yuchi Liu and Yao Xiao, (2014) ‗Circuit Sketch Recognition‘, Stanford University, Stanford, CA.
[2] Rajput G. G. and Mali S. M., (2010) ‗Marathi Handwritten Numeral Recognition using Fourier Descriptors and Normalized Chain Code‘, IJCA, Special Issue on RTIPPR (3): 141–145.
[3] Scott D. Connell and Anil K. Jain, (1999) ‗Template-based online character recognition‘
[4] Levent Burak Kara and Thomas F. Stahovich, ‗Hierarchical Parsing and Recognition of Hand-Sketched Diagrams‘, University of California.
Ge o me t ri c S h a p e s I n t e ra c t i ve l y‘ , I S T / U T L , A v . R o v i s c o P a i s .
[ 6 ] T r a c y H a m m o n d a n d R a n d a l l D a v i s , ‗ A u t o m a t i c a l l y Tr a n s f o r mi n g S y m b o l i c S h a p e D e s c r i p t i o n s f o r U s e i n S k e t c h R e c o g n i t i o n ‘ , MI T C o m p u t e r S c i e n c e a n d A r t i f i c i a l I n t e l l i g e n c e L a b o r a t o r y ( C S A I L ) .
[ 7 ] K e vi n S t o l t , (2 0 0 7 ) ‗ S k e t c h R e c o g n i t i o n f o r C o u rs e o f A c t i o n D i a g ra ms ‘ , M a s s a c h u s e t t s I n s t i t u t e o f T e c h n o l o g y .
[ 8 ] G u i - H u a n F e n g a n d Z h e n g - x i n g S u n , (2 0 0 6 ) ‗ S k e t c h U n d e rs t a n d i n g U s i n g L R Mo d e l i n g ‘ , N a n ji n g U n i ve rs i t y.