225
Using Data Envelopment Analysis In Healthcare
For Estimating Birth Rate Efficiency
Madalina-Ioana Stoica, Mihaela-Laura Ivan
Abstract: This paper presents an analysis on natality efficiency over the world due to local conditions of every country using the nonparametric technique Data Envelopment Analysis (DEA). The subject of demographic development is very important and is highly debated lately in the context of growing world population, where reached at this time 7 billion people, considering that economic resources are limited and the maximum number of children per family is restricted in some countries. The current research shows the existence of a correlation between birth rate and fertility rate, public health expenditure, sanitation facilities, female population based on the results obtained from the analysis of data sets for 207 countries. The efficiency is analyzed through multiple input output models and the efficient frontiers are presented.
Index Terms: measuring birth rate, healthcare decisions, data envelopment analysis, efficiency. ————————————————————
1
I
NTRODUCTIONGlobal development and competition has brought new appeals for a lot of industries and there is no exception for the healthcare industry. However, as pointed out by Ozcan [1], the healthcare industry has left behind other fields of activities in terms of efficiency, equity and quality evaluation and decision making needed to survive in this global activity. There are many opinions on the performance of healthcare area. For example, performance can be expressed from the point of view of patients, administrators of hospitals or other society’s participants [2]. Healthcare is so important because it affects all the people and the nonparametric techniques, like Data Envelopment Analysis, has brought significant benefit in healthcare industry. What other way is better to fulfill this area of people interest than by seeing which the most important influences factors are in order to advance medicine? This paper presents an analysis on how birth rates have increased or decreased due to the local conditions of every country. The conditions analyzed here are: fertility rate, public health expenditure, sanitation facilities and female population. In fact could be more relevant inputs such as: capital income, age-sex structure, religious beliefs and social beliefs regarding contraception and abortion, economic prosperity, female employment, typical age of marriage, poverty levels and infant mortality rate [3]. From the Pew report [4]: Experts say that much of the fertility decline that occurs during an economic decline is postponement of childbearing and does not represent a decision to have fewer children. This means, people postpone the decision of having children during the economic declines, and then wake up on fertility problems once economic conditions increase. Statistics data have demonstrate that the recession is more associated with fertility declines among younger women, who have the comfort of postponing fertility until better economic times come. While, older women chose to postpone fertility because of economic declines.
As William Edwards Deming considered ―Without data you’re just another person with an opinion‖, the data are very important nowadays in big data context because in all the fields off activities there are very large volume of data every day that need to be processed. For the current paper, birth data were collected and refined from the World Bank website where the entire collection for more countries can be found [5]. With the help of Data Envelopment Analysis (DEA) we measure the performance of input factors to see how births have evolved due to the impact of different factors. The first application of DEA, Data envelopment analysis, [6] on health problems is an unpublished research by Subhash Ray, from 1979 related to family planning centers of two countries from Central America, Costa Rica and Guatemala. Nunamaker and Lewin (1983) published the first work applying Data Envelopment Analysis in healthcare domain, who measured the efficiency in routine nursing service, whereas Sherman (1984) was the first person who really used DEA to measure hospital efficiency. Since then DEA has been used widely in the assessment of hospital technical efficiency in the United States as well as around the world at different levels of decision making units, DMUs. By now there is a very extensive literature surveyed by O’Neill et al (2008), Ozcan (2008) and Hollingsworth (2008) [7].
2
M
ETHODOLOGY-
DEA
INH
EALTHCAREData Envelopment Analysis is a nonparametric technique extensively used in the evaluation of efficiency where more than one input or one output models have been constructed. As it is the case for our analysis, we need to compute efficiency based on multivariate models where no exact functional relationship exists between inputs and outputs [8]. The high flexibility of the nonparametric method comes with a major drawback related to the sample size. The curse of dimensionality well known in the nonparametric literature may affect the estimation results. This is the reason for using rather simple models with few variables and a moderate sample size. The non-parametric full frontier technique of data envelopment analysis (DEA) assumes the construction of an efficient frontier using the sample points available and computation of efficiency scores relative to this frontier [9]. All units found on the frontier are efficient and the rest of them rely below this curve. The DEA estimator is computed by finding a set of weights for each country leading to efficiency estimates in the range (0, 1). The optimal weights are computed using the VRS model as presented in [10] and mentioned in [11]:
_______________________
Madalina-Ioana Stoica, Mihaela-Laura Ivan
Department Of Economic Informatics And Cybernetics,
Bucharest University Of Economic Studies, Piata Romana No. 6, Bucharest, Romania
(1) �=1
�
Where is a scalar and � is a vector of order I*1. The value obtained for each weight represents the efficiency estimate for the ith country and a value of 1 indicates an efficient country. Some of the advantages of DEA are:
no need to explicitly use a mathematical equation for the production data;
proven to be useful in uncovering relationships that remain hidden for other analyzing techniques;
capable of measure multiple inputs and outputs;
capable to use any combination of input-output for the analyzed process flow;
the causes of inefficiency can be analyzed and quantified for every evaluated decision-making unit;
Ensure the possibility to include or exclude variables based on what is desired to measure.
3
D
ATA DESCRIPTIONWe use a sample of 207 countries for which we gathered information regarding fertility rate, sanitary facilities, public health expenditure, percent of female population and birth rate as can be shown in Table 1, for two years: 2012 and 2013. The analysis was done taking into account the average of the variable for the two years to have a better picture regarding the efficiency of measures applies to have a higher birth rate [5]:
Table 1. Data description of inputs and outputs used in the DEA models to measure efficiency
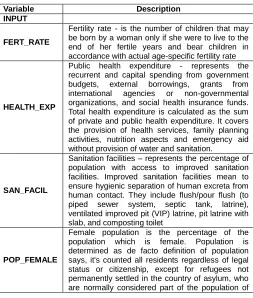
Variable Description INPUT
FERT_RATE
Fertility rate - is the number of children that may be born by a woman only if she were to live to the end of her fertile years and bear children in accordance with actual age-specific fertility rate
HEALTH_EXP
Public health expenditure - represents the recurrent and capital spending from government budgets, external borrowings, grants from international agencies or non-governmental organizations, and social health insurance funds. Total health expenditure is calculated as the sum of private and public health expenditure. It covers the provision of health services, family planning activities, nutrition aspects and emergency aid without provision of water and sanitation.
SAN_FACIL
Sanitation facilities – represents the percentage of population with access to improved sanitation facilities. Improved sanitation facilities mean to ensure hygienic separation of human excreta from human contact. They include flush/pour flush (to piped sewer system, septic tank, latrine), ventilated improved pit (VIP) latrine, pit latrine with slab, and composting toilet
POP_FEMALE
Female population is the percentage of the population which is female. Population is determined as de facto definition of population says, it's counted all residents regardless of legal status or citizenship, except for refugees not permanently settled in the country of asylum, who are normally considered part of the population of
the country of origin. OUTPUT
BIRTH_RATE
Crude birth rate is the number of live births occurring during the year, per 1,000 population calculated at midyear. Subtracting the crude death rate from the crude birth rate provides the rate of natural increase, which is equal to the rate of population change in the absence of migration.
Figure 1 presents some preliminary analysis on the average data values for years 2012 and 2013. Starting from the data sets processed and analyzed using Data Envelopment Analysis(DEA) classical models in the R program were obtained the below results.
Fig. 1. Summary statistics for original data
Since variable which represents the percentage of population female is very low correlated to any other variables in the database, we decided to exclude it from the efficiency models. As we want to build one input - one output models to be able to visualize the efficiency frontier, we need highly or at least moderately correlated variables to be able to reduce the dimensionality. The new data set has the following correlation matrix presented in Figure 2.
Fig. 2. Correlation Matrix on analyzed inputs
As we can observe, the coefficients of correlation in absolute values are improved.
4
P
RELIMINARY ANALYSISWe represent the birth rate, the output we will use for the efficiency models depending on each of the input variable. In Figure 3 is displayed the first input-output correlation, birth rate – fertility rate.
227 The relation is linear, direct and we can identify a trend for the
two variables, fertility rate and birth rate, which are almost perfectly correlated (0.98). The fertility and birth rates are classified by age, live-birth order, race or Hispanic origin and marital status. Nowadays, fertility rate has decreased due to different factors such as: pollution, female employment increase, stress, natural decline in fecundity, unhealthy lifestyle and many others external factors. Usually, women fertility starts to decline from around the age of 30. As women grow older the likelihood of getting pregnant falls while the likelihood of infertility rises. The best thing that the future parents can do to improve their fertility is to live a healthy lifestyle [12]. However, the birth rate and the health expenditures are moderately inverse correlated, and as we can see in the Figure 4 below, the relation is not straightforward. The number of children born to 1000 people is not necessarily related to the funding received from the government.
Fig. 4. Birth rate-Health Expenditure correlation
Interestingly, the sanitation facilities are negatively correlated to the birth rate, as can be observed in Figure 5.
Fig. 5. Birth rate-Sanitation facilities correlation
Table 2. Efficiency models
Model 1 Model 2 INPUT
FERT_RATE * *
HEALTH_EXP *
SAN_FACIL * *
OUTPUT
BIRTH_RATE * *
Reducing dimensionality in case of model 1: since the two inputs are highly correlated, (0.82), we can apply the method of reducing dimensionality explained in [13] with low loss of information.
Hence the matrix is given by:
The highest eigenvalue is 2170 with the corresponding eigenvector (0.62; 0.77) which will allow us to determine the aggregated input for model 1.
In case of model 2, the matrix is given by:
And we find the weights for each input variable to be (0.41; 0.73; 0.53). Aggregating the input variables for each model we find models with one input and one output.
5
E
STIMATING EFFICIENCY USINGDEA
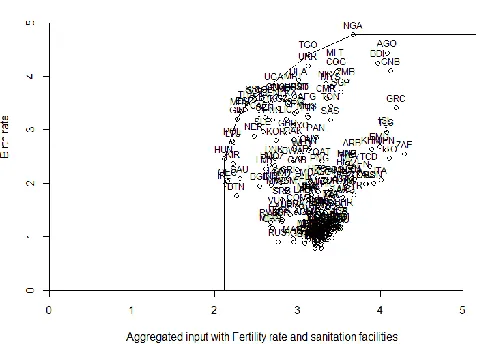
In case of model 1, Figure 6, we construct the efficiency frontier using package benchmarking from software R [14]:
Fig. 6. Aggregated input with Fertility rate and sanitation facilities
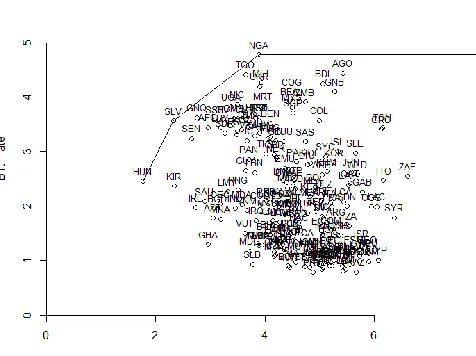
Figure 7, we find 3 efficient countries: HUN, NGA and SLV. Those countries use the amount of resources to obtain the maximum achievable birth rate among the sample analyzed.
Fig. 7. Aggregated input with Fertility rate, Health expenditures and sanitation facilities
In annex 1 we can find the detailed results of the DEA analysis, with the efficiency scores reported in case of output orientation and variable returns to scale.
6
C
ONCLUSIONSWith the valuable method of Data Envelopment Analysis (DEA) it’s easier to make informed decisions, in our case, on identifying underperforming activities from government to grow the birth rate and on developing successful actions to fulfil the desired goals like having natality growth. The current paper highlights the performance measurement brought by using DEA to advance medicine, in special to the most relevant subsystem of healthcare, which is demographic and vital subsystem. Findings indicate that the number of births across multiple industrialized countries is strong correlated with fertility rate. It’s typically quite difficult to determine the exact reason which are causing changes in the number of births, since other social and cultural factors may also be at play. This study concentrated on measuring fertility rate, public health expenditure, sanitation facilities and female population future research, should also include other performance measures such as changes in women’s labor force participation, contraceptive technology, religious beliefs, social beliefs as well as economic conditions.
R
EFERENCES[1] Y. A. Ozcan, Health Care Benchmarking and Performance Evaluation. Springer: New York, 2008.
[2] J. S. Park, K. L. Fowler, S. A. Giebel, Measuring Hospital Operating Efficiencies for Strategic Decisions, International Journal of Business and Social Science, Vol. 2, No. 13, Special Issue - July 2011, Available: http://ijbssnet.com/journals/Vol._2_No._13_Special_Issue _July_2011/7.pdf
[3] E. Jaba, I. A. Chirianu, C. B. Balan, I. B. Robu, M. D.
Roman, The Analysis of the Effect of Women’s Participation in the Labor Market on Fertility in European Union Countries Using Welfare State Models, Journal of Economic Computation and Economic Cybernetics Studies and Research, No. 1, 2016, Vol. 50, pp. 69-84. [4] G. Livingston, In a Down Economy, Fewer Births, [Online],
2011, Available:
http://www.pewsocialtrends.org/2011/10/12/in-a-down-economy-fewer-births/
[5] World Bank, 2016, Available: http://data.worldbank.org/ [6] I. H. Osman, A. L. Anouze, A. Emrouznejad, Handbook of
Research on Strategic Performance Management and Measurement Using Data Envelopment Analysis, IGI Global, 2014.
[7] R. Bhat, B. Bhushan Verma, E. Reuben, Hospital Efficiency and Data Envelopment Analysis (DEA),
[Online], Available:
http://www.iimahd.ernet.in/publications/data/2001-07-05RameshBhat.pdf
[8] J. F. Moreira Pessanha, A. Marinho, L. da Costa Laurencel, M. Rubens dos Santos do Amaral, Implementing DEA models in the R program, 11th Intenational Conference on Data Envelopment Analysis, Samsun, Turkey, 27-30 June 2013.
[9] C. Ferreira, R. C. Marques, P. Nicola, On evaluating health centers groups in Lisbon and Tagus Valley: efficiency, equity and quality, BMC Health Services
Research, 2013, Available:
http://bmchealthservres.biomedcentral.com/articles/10.118 6/1472-6963-13-529
[10]T. J. Coelli, D. S. P. Rao, G. E. Battese, An introduction to efficiency and productivity analysis, Springer, 2005, ISBN 978-0-387-25895-9.
[11]M. Stoica, Ranking Romanian universities: How much the choice of nonparametric variables matters?, Economy Informatics, Vol. 14, No. 1, 2014, ISSN 1582-7941. [12]J. A. Martin, B. E. Hamilton, M. J. K. Osterman, S. C.
Curtin, T. J. Mathews, Births: Final Data for 2013, National Vital Statistics Reports, Vol. 64, No. 1, 2015, Available: http://www.cdc.gov/nchs/data/nvsr/nvsr64/nvsr64_01.pdf [13]C. Daraio and L. Simar, Advanced Robust and
Nonparametric Methods in Efficiency Analysis. Methodology and Applications. Springer. New York (USA), 2007.
229 Annex 1. DEA results model 1
Efficient countries DEA Score
GIN 1
HUN 1
MDV 1
NGA 1
SSF 1
TGO 1
THA 1
Inefficient countries DEA Score
KAZ 5.74
PRY 5.67
DJI 5.53
JAM 5.37
GRD 5.32
Annex 2. DEA results model 2
Efficient countries DEA Score
SLV 1
HUN 1
NGA 1
Inefficient countries DEA Score
KAZ 6.06
PRY 6.06
DJI 5.88
JAM 5.68