INTERNATIONAL RESEARCH JOURNAL OF PHARMACY
www.irjponline.com
ISSN 2230 – 8407
Research Article
DEVELOPMENT AND OPTIMIZATION OF ZALEPLON LOADED EUDRAGIT
®NANOPARTICLES FOR
ORAL DELIVERY: IN-VITRO AND IN-VIVO EVALUATION
Sanaa A. El-Gizawy, Ebtessam A. Essa, Ahmed Kh. Abosalha
*
Department of Pharmaceutical Technology, Faculty of Pharmacy, University of Tanta, Tanta, Egypt
*Corresponding Author Email: [email protected]
Article Received on: 18/06/19 Approved for publication: 02/07/19
DOI: 10.7897/2230-8407.1007236
ABSTRACT
Polymeric nanoparticles (PNPs) have a great potential as drug delivery systems regarding their small size, high physicochemical stability, and sustained-release properties. Zaleplon (Za) is a model BCS class II drug with sedative and hypnotic actions. Zaleplon loaded polymeric nanoparticles (Za-NPs) were prepared from Eudragit® RS100 using a single emulsion solvent evaporation technique. Full factorial design (23) was applied to optimize the
physicochemical characterization of Za-NPs. The three independent variables were the amount of polymer, the concentration of PVA and the volume of organic phase. The effects of these variables on particle size (PS), zeta potential (ZP), entrapment efficiency (%EE) and in vitro drug release were investigated. In- vivo study was conducted in rats to evaluate the pharmacological effects of the selected Za-NPs formulations. The designed formulations of Za-NPs had a spherical shape with a size range of 146 to 250 nm and a positive zeta potential in the range of 17.7 to 39.3 mv. The % EE of Za-NPs formulations were in the range of 66.3 to 87.6%. Differential thermal analysis (DTA) showed no interaction between Zaleplon and other excipients meanwhile a change in drug crystallinity was observed. Za-NPs showed a significant increase in the sedative effects in vivo compared with the free drug. Stability studies of the selected lyophilized Za-NPs formulations indicated a high stability after 3 months.
Keywords: Polymeric Nanoparticles, Eudragit® RS100, Zaleplon, sedative effect.
INTRODUCTION
Zaleplon is classified chemically as a non-benzodiazepine drug which used as sedative and hypnotic for management of insomnia. It shows pharmacological properties due to its interaction with GABA (A) receptor in the brain. Za exhibited an anticonvulsant effect against electroshock and pentylenetetrazole-induced seizures 1.
According to the biopharmaceutical classification system (BCS), Za is categorized as a class II drug with high permeability and poor aqueous solubility. Drug bioavailability after oral administration is approximately 30% due to extensive first-pass metabolism. Rapid absorption of Za following oral intake was reported; however limited aqueous solubility hurdled its oral absorption due to poor dissolution which represented the rate-limiting step 2-3.
The oral delivery of Za has some disadvantages which restricted its therapeutic application. The most common disadvantages are low oral bioavailability, short elimination half-life (1hr), delayed onset of action and early morning awakening which requires frequent treatment with high doses to keep its concentration within the therapeutic range. The required high dose is mainly responsible for the occurrence of typically short-lived hallucinations 4-6.
The marketed immediate-release tablets or capsules of Za failed to eradicate previously mentioned disadvantages therefore, different formulation approaches such as micronization, solid dispersions, semisolid dispersions with lipid surfactants and complexation with cyclodextrins were adopted to overcome the aforementioned limitations of Za 5-7.
Carrier-mediated drug delivery systems such as proliposomes 6, nanoemulsifying powders 8, solid lipid nanoparticles 9 and nanoemulsions 10 have been reported to achieve the above objectives. The ultimate goal of these strategies was to improve the low oral bioavailability of Za by improving the dissolution behaviour.
Polymeric nanoparticles may have superiority over previously discussed strategies due to its high chemical and physical stability for long-term storage after freeze-drying 11. Polymeric nanoparticles are suitable carriers for small molecules, peptides, proteins or oligonucleotides with different fabrication methods 12-15. Polymeric nanoparticles can sustain drug release for long duration 16 and offer the opportunity for passive and active drug targeting 17. In addition, encapsulation of lipophilic drug into nanoparticles may contribute to avoid its first pass metabolism by protecting it from being metabolized by the liver before renal excretion. This was proved by enhancement of serum concentrations of drug loaded into nanoparticles with respect to the administrated free drug solution or suspension 18-19.
Eudragit® RS100 is a positively charged poly (ethyl acrylate-co-methyl methacrylate-co-triacrylate-co-methylammonioethyl methacrylate chloride) copolymer. Eudragit® RS100 is a swellable insoluble polymer at physiological pH which represents a good carrier for drug dispersion. It possesses positively charged quaternary ammonium groups, which are responsible for bioadhesive properties of the polymer20.
to enhance oral delivery of gliclazide21. Dai et al improved the oral bioavailability of cyclosporine via encapsulation into Eudragit nanoparticles 22. Younis et al optimized the oral delivery of silymarin by Eudragit polymeric nanoparticles23.
Xiao-Jiao Du et al reported that positively charged oral nanoparticles showed a superior cellular uptake, vitro and in-vivo intestinal transportation and intestinal distribution compared to neutral or negatively charged nanoparticles 24.
Currently, no previous study has been made to encapsulate Za into Eudragit RS 100 nanoparticles. Eudragit RS 100 was selected to optimize the oral delivery of Za based on its ability to control its release pattern, prolong its contact to intestinal mucosa by its mucoadhesion properties, facilitate its intestinal transport and therefore enhancing its oral bioavailability 23-24 .
The aim of this study was to formulate, optimize, and characterize Zaleplon loaded Eudragit RS 100 nanoparticles in-vitro and investigates its pharmacological activity in-vivo using experimental rats.
MATERIALS AND METHODS
Materials
Eudragit® RS was obtained from Evonic company (Germany). Zaleplon, Polyvinyl alcohol (PVA, 87-89% degree of hydrolysis, M.wt 31,000-50,000), phosphate buffered saline (PBS), Dichloromethane and acetonitrile (HPLC grade) were purchased from Sigma-Aldrich Chemical Co. (St. Louis, USA).
Experimental design
In the present study, a (23) full factorial design was adopted for Za-NPs optimization (Table 1). Three different fabrication parameters (A, B &C) were studied; (A) the amount of polymer (25 mg and 50mg), (B) the volume of the organic phase (2 ml and 4 ml ) and (C) the concentration of PVA (0.3 and 0.5 % w/v). The estimated responses were Particle size (PS), Zeta potential (ZP), Encapsulation efficiency (%EE) and in-vitro release. Table 2 demonstrates all eight possible formulations.
Preparation of Za-NPs
Za-NPs were formulated using a single emulsion solvent evaporation technique. The selected amount of Eudragit® RS and 5 mg of Za were dissolved in the selected volume (ml) of Dichloromethane (DCM). Once dissolution was complete, this organic phase was gradually poured to 20 ml aqueous PVA solution and sonicated at 80 W for 120 seconds by ultrasonic homogenizer equipped with 3.2mm probe (Cole-Parmer, 4710 series, United States) to form o/w emulsion. The nanoparticles were formed by evaporation of DCM by overnight magnetic stirring at 1000 rpm (Daihan, MSH-20A, Korea) to ensure complete evaporation of DCM.
In-vitro Characterization
Particle surface morphology
Za-NPs surface morphology was characterized by the aid of transmission electron microscopy (JOEL JEM 2000 EX200 microscope, Japan). An aliquot of nanosuspension was loaded into a formvar-coated grid followed by air-drying.
Particle Size (PS) and polydispersity index (PDI)
The size and PDI of Za-NPs were measured using dynamic light scattering (DLS) technique (Malvern Zetasizer 5000, UK). A sample of nanosuspension was previously vortexed and diluted (1:5 ratio) with ultra-pure water before measurement. The mean of three measurements was recorded.
Zeta Potential
Electro-phoretic mobility was used to determine the surface charge of Za-NPs (Malvern Zetasizer 5000, UK). Conductivity was adjusted by 0.001 MKCl. The mean of three measurements was recorded.
Entrapment Efficiency
Entrapment efficiency was determined using an indirect method. Nanoparticles were separated by ultracentrifugation (Sigma Laborzentrifugen GmbH., Germany) at 20,000 rpm for half an hour. The concentration of free Za in the collected supernatant was determined by a reported high-pressure liquid chromatography (HPLC) method with some modifications 25. The HPLC system consists of autosampler (Waters® 717), controller (Waters® 600) and tunable absorbance UV detector (Waters® 486). The mobile phase of acetonitrile-water (40: 60 % v/v) was used at a flow rate of 1 ml/min and the drug concentrations were monitored spectrophotometrically at 232 nm. The amount of Za encapsulated in NP was calculated according to equation 1. All measurements were recorded in triplicate and the mean was reported as the percentage of Za entrapment efficiency.
% Entrapment efficiency
= [89:;] =>=?@A[89:;]B:CD9E?=DE=[89:;]=>=?@ 𝑥100 (Equation 1)
In vitro Release Study
An aliquot of Za-free drug suspension in water (FW), Za-free drug dispersion in 0.3% PVA (FP) and Za-NPs (equivalent to 1 mg of Za) were put into a 5 cm dialysis sac (spectra-por, cut-off 12-14 KDa, USA). The sac was soaked overnight to ensure swelling and wetting of membrane. The dialysis sac containing the tested samples was immersed into 50 mL of PBS (pH 7.4). The release medium was stirred magnetically at a speed of 100 rpm and kept warm at 37 ± 2°C. At predetermined time intervals, 1 ml of withdrawn release samples were received and replenished with 1 ml of fresh PBS 15. Analysis of the withdrawn samples was achieved using the adopted HPLC assay.
Differential thermal analysis (DTA)
The thermograms of Za, Eudragit® RS, a physical mixture of Za and Eudragit® RS (1:1) and Za-NPs (F1 and F8) were obtained using differential thermal analyzer (Perkin Elmer, STA 6000, France) with TA-60WS software. 10 mg of each sample was heated in aluminum pans. Nitrogen worked as an effluent gas. The thermograms were obtained in the heating range of 30-300 °C at a heating rate of 10 °C/min.
Fourier Transformation Infrared Spectroscopy (FTIR)
Infrared spectra (IR) of Za, Eudragit® RS, a physical mixture of Za and Eudragit® RS (1:1) and Za-NPs (F1 and F8) were obtained using a Bruker Tensor 27 FTIR spectrometer (Bruker Optics GmbH, Ettlingen, Germany) equipped with DLaTGS (DeuteratedL-alanine Triglycine Sulfate) detector. The samples were previously mixed thoroughly with KBr. The KBr disks were prepared by compressing the powder. The scanning range was kept from 4,000 to 450 cm−1.
Invivo Study
Za has been investigated for its sedative activity by evaluating the effect of the free drug and the optimized formulations on locomotion. Locomotor activity was assessed in rats using a grid floor activity cage 26.
Animals and treatment protocol
Twenty-four Wistar albino rats (140-160 g) were used for in vivo
solution) and used as a control group, group 2 received free drug suspension (in 0.3% PVA solution), group 3 received Za-NPs F1 and group 4 received Za-NPs F8. All formulations were given orally using oral gavage at a dose of 0.5 mg/kg which is equivalent to the human effective dose of 5 mg Za 27. The obtained rats were kept in metabolic cages under controlled conditions of temperature and relative humidity (RH) (25°C, 65% RH) with 12 h light/dark cycles. All rats were provided free access to food and tap water. All in vivo work was performed under the authority of Research Ethics Committee (REC) of Faculty of Pharmacy, Tanta University, Egypt (approval number 000PT, 20-5-2018).
Locomotor activity test
Grid floor activity cage (Model no. 7430, Italy) was used to assess the locomotor activity through recording rat movements inside the cage. Rats were allowed to acclimatize for 1 hr to the lab conditions before transferring the animal to the activity cage 28. Before starting the experiment, all rats were trained to the cage for 3 successive sessions of 5 min duration for each session to render the rats familiar with the cage. One hour after oral treatment, the rats were placed directly into the activity cage and the activity counts/ 5 minutes for each rat were calculated and expressed in terms of locomotor activity 29.
Stability study
Stability of nanoparticle suspensions (F1 and F8) after freeze drying (Zirbus, Vaco5-D, Germany) using 2% w/v sucrose solution as cryoprotectant were studied at two different temperatures of 4°C and 25°C for 3 months. The mean PS, ZP, and %EE were measured immediately after lyophilization and periodically after each month9 .
Statistical analysis
Statistical manipulation of the predetermined parameters was achieved using Minitab statistical software (Minitab 17). The regression equations were derived and the significance of each factor and interaction on the selected responses were reported. The coefficient values of the independent variables were derived for optimization. Stability and in-vivo results were analyzed using one-way analysis of variance (ANOVA) with Tukey’s post hoc
test. The p-value < 0.05 was considered significant.
RESULTS AND DISCUSSION
Morphology of Za-NPs
The image taken by TEM showed Za-NPs with a spherical shape (Figure 1). Za-NPs exhibited low polydispersity index with no aggregates. Size measurements according to TEM are comparable to DLS results.
Particle size and PDI
The average PS and PDI values for the tested formulations are summarized in Table 3. The size of the tested nanosystems was in the range of 146.2 nm (F1) to 250.1 nm (F8) with PDI values of 0.095 to 0.199, respectively.
The stepwise multivariate linear regression equation was as follows:
PS = 29.35 + 99.8 C + 12.93 B + 2.435 A - 1.71 AC - 1.38 ABC + 1.03 BC
- 0.53 AB (Equation 2)
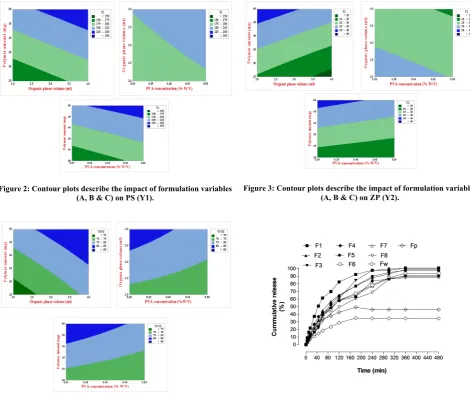
All factors (A, B &C) showed significant effects on PS whereas, all the interactions exhibited insignificant effects. Contour plots showing the effects of the main factors on PS were demonstrated in figure 2. The concentration of PVA (factor C) was the most influential factor followed by factor B (volume of organic phase)
and factor A (amount of polymer). These findings represented F1 to be the optimum formula regarding PS. The F1 formula was fabricated with a low concentration of PVA, low volume of the organic phase and low amount of polymer. For the sake of optimum drug delivery of oral Za-NPs, it is recommended to minimize PS.
A significant decrease in PS was depicted after using a low concentration of PVA. This can be explained by the decreased viscosity of the external phase which supports higher net shear stress required for droplet breakdown 30-31.
An increase in nanoparticle size was observed by increasing the polymer amount from 25 mg to 50 mg which resulted in increasing the organic phase viscosity. Higher organic phase viscosity resisted the net shear force with a subsequent increase in PS 15.
The decrease in organic phase volume from 4 to 2 ml with a constant aqueous phase volume exhibited a significant decrease in PS. This may be attributed to the faster evaporation rate of the organic phase (DCM). This may decrease the probability of droplet coalescence during the solidification stage32.
Zeta potential
The mean ZP for prepared Za-NPs formulation was demonstrated in Table 3. All the formulations exhibited a positive ZP in the range of 17.7 mv (F7) to 39.3 mv (F2). This is attributed to the nature of polycationic Eudragit® RS polymer.
The stepwise multivariate linear regression equation was demonstrated as follows:
ZP = 21.10 - 12.87 C - 2.804 B + 0.5563 A - 0.313 AC + 0.304 AB - 0.263 ABC + 0.112 BC (Equation 3)
All factors exhibited a significant impact (p<0.05) on ZP however, all interactions revealed insignificant effects (p>0.05). Contour plots demonstrating the effect of main factors on ZP were demonstrated in figure 3. The concentration of PVA (C) was the most effective factor with a negative value. The second and the third influential factors on ZP were negative B (2 ml organic phase) and positive A (50 mg polymer), respectively. F2 with 0.5 % PVA, 2 ml organic phase and 50 mg polymer was the optimum formula regarding ZP. Concerning the physical stability of the prepared Za-NPs, it is very important to obtain a high zeta potential value to avoid aggregation and coalescence of nanoparticles 33-34.
Increasing the concentration of PVA significantly decreased ZP. This was attributed to the PVA coating effect of the nanoparticles which covered the surface charge of the polymer with a subsequent decrease in ZP. This finding agrees with the finding reported by Sahoo et al35. While increasing polymer amount showed a significant increase in ZP. This can be explained by the accumulation of the ionized positive charge of the polymer due to increasing its abundance 15. However, a significant decrease in ZP was obtained after increasing organic phase volume. The use of low organic phase volume (2ml) may result in rapid solidification and formation of the nanosystem 32 consequently, this may decrease PVA coating to the surface of the particles and increase the effect of positive ions of the polymer.
Entrapment efficiency
134702(±1259) X – 4232.8(±223) with a regression coefficient value (R2) of 0.9999. Validation parameters for HPLC assay were summarized in table 4 and table 5.
The %EE values for Za-NPs formulations are reported in table 3. The % EE of the tested nanosystem ranged from 66.3 ± 1.01 (F1) to 87.6 ± 0.85 (F4).
The stepwise regression equation was as follows:
%EE = 57.25 - 17.70 C + 3.867 B - 0.997 BC - 0.876 AC + 0.835 ABC - 0.436 AB + 0.3935 A (Equation 4)
All factors and interactions showed significant effects (P<0.05) on % EE. Contour plots showing the effect of main factors on % EE were demonstrated in figure 4. The concentration of PVA was the most important factor with a negative coefficient value. In the second and the third level, positive B (4 ml organic phase) and negative BC were represented, respectively. F4 with 0.3% PVA, 2 ml organic phase and 50 mg polymer was the optimum formula regarding entrapment efficiency.
Increasing the concentration of PVA showed a significant decrease in %EE. This can be explained by the increased solubility of Za in the aqueous medium due to the PVA effect during nanoparticles formation which resulted in the increased loss of the drug to the external aqueous phase 36.
Increasing polymer amount exhibited a significant increase in %EE. This may be attributed to the increased organic phase viscosity which minimized drug loss to the aqueous phase16.
Increasing organic phase volume from 2 to 4 ml resulted in a significant increase in %EE which might be attributed to the increased size of nanoparticles which is available to entrap the drug. These results are supported by the result reported by Sharma et al 37 .
In-vitro release
The release profile of different Za-NPs, free drug suspension in water (FW) and free drug dispersion in 0.3 %PVA (FP) were demonstrated in figure 5. The time at which 50% of Za released (T50%) was used as an indicator for release behavior 38 (Table 6). The average T50 % (min) for the tested nanosystems ranged from 45min (F1) to 120 min (F8). The experimental release results were fitted to different release models. The correlation coefficient (R2) obviously showed that the best models describe Za release from Za-NPs were the Higuchi model for F3, F5, F6, and F7 and first-order model for F1, F2, F4, and F8.
The stepwise regression equation was as follows.
T50% = -31.96 + 138.52 C + 13.344 B - 4.197 BC - 3.178 AC - 3.151 AB + 0.7968 A + 0.282 ABC (Equation 5)
All factors and interactions exhibited significant effects (p<0.05) on T50%. Contour plots demonstrating the effect of main factors on T50% were demonstrated in figure 6. The concentration of PVA (C) was the most influential factor with a positive coefficient value. At the same time, positive B and negative BC were ranked as the second and the third effective factors, respectively. As interpreted from our results, it is obvious that there is a correlation between the size of the nanosystem and its release behavior represented by T50%. F1 showed the smallest size and the highest release (the lowest T50% )whereas, F8 exhibited the largest size and the lowest release (the highest T50%). This may be explained
by the increased specific surface area of nanoparticles by the decrease in size resulting in an increase in the rate of drug release.
Optimization of physicochemical properties of Za-NPs was conducted in regards to their PS, ZP, %EE and in-vitro drug release. The optimization design resulted in nanoparticles formulations with the targeted physicochemical characteristics. Formulation F1 was the optimized one concerning the smallest particle size (146.2 nm), the smallest PDI (0.095) and the highest release rate. In addition, its zeta potential value (25.9 mv) was within the targeted range. Formulation F8 showed the largest particle size (but still within the targeted range), the slowest drug release rate, a high zeta potential within the targeted range (31.1mv) and a high %EE (82.01 %w/v). So F1 and F8 were selected for further stability study and in-vivo evaluation.
Differential thermal analysis
The DTA thermograms of samples are presented in figure 7. The thermogram of Za is characterized by a sharp melting endotherm at 187.25 °C. The thermal curve of Eudragit® RS100 showed a broad endothermic peak at 69.56 °C. Moreover, Za and Eudragit® RS physical mixture (1:1) thermogram showed a sharp endotherm of the drug at 186.28 °C and abroad endotherm of the polymer at 69.56°C. The thermogram of Za-NPs F1and Za-NPs F8 exhibited no endothermic peak of Za. This may be attributed to the decreased crystallinity of Za or the transformation to the amorphous state in nanoparticles formulation9.
Fourier Transformation Infrared Spectroscopy (FTIR)
Za shows strong absorption peaks at 2,232 cm-1 and 1,651 cm−1 indicating presence of cyanide and amide carbonyl group respectively. Physical mixture (1:1) has shown all peaks of zaleplon. Za-NPs F1 and Za-NPs F8 retained all peaks of Za with decreased intensity which might be attributed to Nano-encapsulation of Za and dilution effect. However, no additional peak was observed indicating absence of any interaction between Za and other additives (figure 8).
In-vivo study
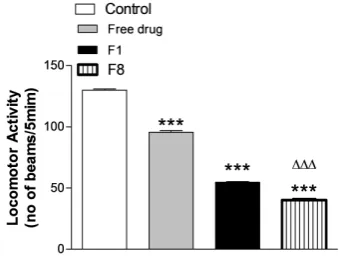
Table 7 and figure 9 showed the effect of vehicle, free drug suspension, Za-NPs (F1) and Za-NPs (F8) on locomotor activity. Oral administration of free drug attributed to a significant decrease in the activity level by 26.46%. F1 resulted in a decrease in the activity level by 57.95% in comparison with the control group and by 42.82% with respect to free drug. F8 reduced the activity level by 69.11% as compared to the control group and by 26.52% compared with F1. It is clear from in-vivo results that F1 and F8 Za-NPs had a superior biological activity compared to free drug. This might be attributed to the role of nanoparticles to escape the first pass metabolism of Za resulting in higher drug concentration to be delivered to the systemic circulation. The significant sedative effect of F8 with respect to F1 may be attributed to higher % EE of F8 besides its slower in vitro release behavior compared to F1 which sustained its sedative and hypnotic action.
Stability study
Table 1: Formulation variables of Za-NPs Preparations Levels Formulation Variables Low High 25 50 A= Polymer Amount(mg)
2 4 B= Volume of organic phase (ml)
0.3 0.5 C= Concentration of PVA (%w/v)
- + Code
Tested responses Constraints
Y1= PS(nm) (150-300 nm) Y2= ZP(mv) (20-40 mv) Y3= %EE maximize Y4= T50%(min) maximize
Table 2: (23) Full factorial design of Za-NPs
Concentration of PVA (% w/v)
Volume of organic phase (ml)
Polymer Amount (mg) Codes Formula C B A 0.3 2 25 _ _ _ F1 0.3 2 50 _ _ + F2 0.3 4 25 _ + _ F3 0.3 4 50 _ + + F4 0.5 2 25 + _ _ F5 0.5 2 50 + _ + F6 0.5 4 25 + + _ F7 0.5 4 50 + + + F8
Table 3: In-vitro characteristics of Za-NPs
%EE PDI
ZP(mv) PS (nm)
Formula
66.3 ± 1.01 0.095 ± 0.007
25.9 ± 0.98 146.2 ± 2.6
F1
80.5 ± 0.7 0.12 ± 0.017
39.3 ± 1.04 208.8 ± 9.6
F2
78.6 ± 0.86 0.125 ± 0.007
18.9 ± 0.45 168.3 ± 3.3
F3
87.6 ± 0.85 0.14 ± 0.027
34.6 ± 1.28 234.3 ± 9.6
F4
68.2 ± 1.3 0.188 ± 0.006
23.2 ± 0.66 164.8 ± 0.96
F5
75.5 ± 0.6 0.157 ± 0.018
36.4 ± 0.8 226 ± 1.4
F6
73.1 ± 0.9 0.115 ± 0.01
17.7 ± 1.07 196.5 ± 8.3
F7
82.01 ± 1.34 0.199 ± 0.013
31.1 ±.87 250.1 ± 6.8
F8
Data are means ± S.D (n=3)
Table 4: Intraday validation parameters of Zaleplon (n=3)
Nominal value (µg/ml) Recovered concentration (µg/ml) SD (µg/ml)
% RSD %Recovery
0.5 0.499288 0.003423 0.685645 99.8576 1 0.997306 0.013960 1.399830 99.7306 3 3.028149 0.059414 1.962059 100.9383 6 5.842891 0.047308 0.809675 97.3815 12 12.23151 0.023651 0.193365 101.9293 25 24.90155 0.293734 1.179582 99.6062
Table5: Inter-day validation parameters of Zaleplon (n=3)
Nominal value (µg/ml) Recovered concentration (µg/ml) SD (µg/ml)
% RSD %Recovery
Table 6: Release kinetics for Za-NPs formulations
Rate constant (k) T50% (min)
Correlation r2) ( factor
Order of
release Formula
0.015 ±0.0005 45.3 ±1.5
0.9924 ± 0.002 First
F1
0.009 ±0.0002 78.5 ± 2.4
0.9972 ±0.0003 First
2F
6.661 ±0.137 87.3±1.03
0.9613 ± 0.01 Higuchi
3F
0.006±0.00005 106.7 ±0.84
0.9811 ± 0.001 First
F4
6.155 ±0.039 88.4 ±1.13
0.9645 ± 0.003 Higuchi
F5
5.519 ±0.014 107.7 ±0.62
0.9940 ±0.0005 Higuchi
F6
5.442 ±0.049 112.4 ±1.25
0.9831 ± 0.002 Higuchi
F7
0.005 ±0.0005 120.2 ±0.15
0.9705 ± 0.006 First
F8
Data are means ± SD (n=3).
Unit of K for first order is (hr -1) and for Higuchi is (mg.hr -1/2)
Table 7: Locomotor activity of control, free Za, Za-NPs (F1) and Za-NPs (F8).
Control Za free drug F1 F8
Locomotor activity 130±2.37 95.6±3.42 54.66±1.7 40.16±1.9
Data are expressed as means ± SD (n=6).
Table 8:Physical stability of Za-NPs (F1 and F8) for a period of 3 months
F1 Time (day)
PS(nm) ZP(mv) %EE
At 4°c At 25°c At 4°c At 25°c At 4°c At 25°c 0 148.6±2.9 146.8±3.7 25.6±1.4 25.9±0.9 68.7±1.5 68.2±2.4 30 152.6±3.7 150.7±2.9 25.1±0.7 24.5±1.3 68.8± 1.6 69.6± 1.2 60 153.6±5.4 155.1±7.3 26.2±0.4 26.5±0.6 64.6± 1.1 63.2± 2.6 90 159.4±5.1 158.7±4.1 24.8±1 26.9±0.8 61.5± 3.8 62.2± 2.7 F8
0 252.4±3.5 250.9±4.2 31.4±1.8 31.7±1.3 81.6±3.3 80.5±2.3 30 257.1±4.6 259.8±5.4 30.7±1.1 31.3±1.6 80.1 ± 1.9 79.2 ± 1.3 60 259.6±4.8 262.1±4.3 32.3±1 30.7±1.7 78.3 ± 2.6 79.8 ± 1.9 90 264.6±8.1 263.4±3.8 29.6±1.1 28.7±1.2 78.9 ± 2.6 78.1 ± 2.1
Values are expressed as means ±SD (n=3).
Figure 2: Contour plots describe the impact of formulation variables (A, B & C) on PS (Y1).
Figure 3: Contour plots describe the impact of formulation variables (A, B & C) on ZP (Y2).
Figure 4: Contour plots describe the impact of formulation variables (A, B & C) on %EE (Y3).
Figure 5: In-vitro release profiles of Za free drug suspension in water (FW), Za drug dispersion in 0.3% PVA (FP) and Za-NPs
formulations.
Figure 6: Contour plots describe the impact of formulation variables (A, B & C) on T50% (Y4).
Figure 8: FTIR of (a) Za, (b) Eudragit® RS100, (c) physical mixture,
(d) Za-NPs F1and (e) Za-NPs F8. Figure 9: Effect of control, free Za, Za-NPs (F1) and Za-NPs(F8) on locomotor activity .Data are expressed as mean ± SE (n=6). ***P < 0.001 compared with Group I (control group). ΔΔΔ P < 0.001
compared with Group I, Group II and Group III.
CONCLUSION
The Za-NPS were prepared by single emulsification/ solvent evaporation technique using different formulation variables of (polymer amount, organic phase volume and PVA concentrations). The optimization of Za-NPS using a full factorial design was successful. The nanoparticles were spherical in shape with low PDI. Za-NPs showed good physicochemical characteristics regarding PS, ZP, %EE and in-vitro release. The compatibility of formulation ingredients with Za was evident from DTA studies. DTA revealed the change of crystalline state of the drug to the amorphous form in Za-NPs formulations. The in-vivo study in rats showed that Za-NPs significantly improve the sedative effect of Za as compared to free drug. Stability studies revealed a high stability of Za-NPs after freeze drying.
REFERENCES
1. Dooley M, Plosker GL. Zaleplon: a review of its use in the treatment of insomnia. Drugs. 2000;60(2):413-45. PubMed PMID: 10983740. Epub 2000/09/13. eng.
2. Drover DR. Comparative Pharmacokinetics and Pharmacodynamics of Short-Acting Hypnosedatives. Clinical Pharmacokinetics. 2004;43(4):227-38.
3. Waghmare A, Pore Y, Kuchekar B. Development and Characterization of Zaleplon Solid Dispersion Systems: A Technical Note. AAPS PharmSciTech. 2008;9(2):536-43. PubMed PMID: PMC2976925.
4. Dudhipala N. A Review of Novel Formulation Strategies to Enhance Oral Delivery of Zaleplon. J Bioequiv Availab. 2016;8:211-3.
5. Farag MM, El Malak NSA, Yehia SA. Zaleplon loaded bi-layered chronopatch: A novel buccal chronodelivery approach to overcome circadian rhythm related sleep disorder. International journal of pharmaceutics. 2018;542(1-2):117-24.
6. Janga KY, Jukanti R, Velpula A, Sunkavalli S, Bandari S, Kandadi P, et al. Bioavailability enhancement of zaleplon via proliposomes: Role of surface charge. European journal of pharmaceutics and biopharmaceutics : official journal of Arbeitsgemeinschaft fur Pharmazeutische Verfahrenstechnik eV. 2012;80(2):347-57. PubMed PMID: 22041602. Epub 2011/11/02. eng.
7. Manda P, Popescu C, Juluri A, Janga K, Kakulamarri PR, Narishetty S, et al. Micronized Zaleplon Delivery via
Orodispersible Film and Orodispersible Tablets. AAPS PharmSciTech. 2018;19(3):1358-66.
8. Janga KY, Jukanti R, Sunkavalli S, Velpula A, Bandari S, Kandadi P, et al. In situ absorption and relative bioavailability studies of zaleplon loaded self-nanoemulsifying powders. Journal of microencapsulation. 2013;30(2):161-72. PubMed PMID: 22894164. Epub 2012/08/17. eng.
9. Dudhipala N, Janga KY. Lipid nanoparticles of zaleplon for improved oral delivery by Box-Behnken design: optimization, in vitro and in vivo evaluation. Drug development and industrial pharmacy. 2017;43(7):1205-14. PubMed PMID: 28274147. Epub 2017/03/10. eng.
10.Abd-Elrasheed E, El-Helaly SN, El-Ashmoony MM, Salah S. Brain Targeted Intranasal Zaleplon Nano-emulsion: In-Vitro Characterization and Assessment of Gamma Aminobutyric Acid Levels in Rabbits' Brain and Plasma at Low and High Doses. Current drug delivery. 2018;15(6):898-906. PubMed PMID: 29189154. Epub 2017/12/01. eng.
11.Li Y, Ogris M, Wagner E, Pelisek J, Rüffer M. Nanoparticles bearing polyethyleneglycol-coupled transferrin as gene carriers: preparation and in vitro evaluation. International journal of pharmaceutics. 2003;259(1-2):93-101. PubMed PMID: 12787639. eng.
12.Haggag YA, Faheem AM, Tambuwala MM, Osman MA, El-Gizawy SA, O'Hagan B, et al. Effect of poly(ethylene glycol) content and formulation parameters on particulate properties and intraperitoneal delivery of insulin from PLGA nanoparticles prepared using the double-emulsion evaporation procedure. Pharmaceutical development and technology. 2017;1-12. PubMed PMID: 28285551. Epub 2017/03/14. eng.
13.Haggag YA, Faheem AM. Evaluation of nano spray drying as a method for drying and formulation of therapeutic peptides and proteins. Frontiers in Pharmacology. 2015;6:140. PubMed PMID: PMC4493383.
14.Haggag YA, Matchett KB, Dakir El H, Buchanan P, Osman MA, Elgizawy SA, et al. Nano-encapsulation of a novel anti-Ran-GTPase peptide for blockade of regulator of chromosome condensation 1 (RCC1) function in MDA-MB-231 breast cancer cells. International journal of pharmaceutics. 2017;521(1-2):40-53. PubMed PMID: 28163220. Epub 2017/02/07. eng.
(MDA-MB231) and Lung (A549) Cancer Cells Through Reduction in Expression of HIF-1alpha and Nuclear p65 (Rel A). Current drug delivery. 2018;15(2):286-95. PubMed PMID: 29065834. Epub 2017/10/27. eng.
16.Haggag Y, Abdel-Wahab Y, Ojo O, Osman M, El-Gizawy S, El-Tanani M, et al. Preparation and in vivo evaluation of insulin-loaded biodegradable nanoparticles prepared from diblock copolymers of PLGA and PEG. International journal of pharmaceutics. 2016;499(1-2):236-46. PubMed PMID: 26746800. Epub 2016/01/10. eng
17.Seeta Rama Raju G, Benton L, Pavitra E, Yu JS. Multifunctional nanoparticles: recent progress in cancer
therapeutics. Chemical Communications.
2015;51(68):13248-59.
18.Nassar AF. Biotransformation and metabolite elucidation of xenobiotics: characterization and identification: John Wiley & Sons; 2011.
19.Li SD, Huang L. Pharmacokinetics and biodistribution of nanoparticles. Molecular pharmaceutics. 2008;(4):496-504. PubMed PMID: 18611037. Epub 2008/07/10. eng.
20.Alai M, Lin WJ. Novel lansoprazole-loaded nanoparticles for the treatment of gastric acid secretion-related ulcers: in vitro and in vivo pharmacokinetic pharmacodynamic evaluation. The AAPS journal. 2014;16(3):361-72. PubMed PMID: 24519468. Pubmed Central PMCID: PMC4012042. Epub 2014/02/13. eng.
21.Devarajan PV, Sonavane GS. Preparation and in vitro/in vivo evaluation of gliclazide loaded Eudragit nanoparticles as a sustained release carriers. Drug development and industrial pharmacy. 2007;33(2):101-11. PubMed PMID: 17454041. Epub 2007/04/25. eng.
22.Dai J, Nagai T, Wang X, Zhang T, Meng M, Zhang Q. pH-sensitive nanoparticles for improving the oral bioavailability of cyclosporine A. International journal of pharmaceutics. 2004;280(1-2):229-40. PubMed PMID: 15265562. Epub 2004/07/22. eng.
23.Younis N, Shaheen MA, Abdallah MH. Silymarin-loaded Eudragit((R)) RS100 nanoparticles improved the ability of silymarin to resolve hepatic fibrosis in bile duct ligated rats. Biomedicine & pharmacotherapy = Biomedecine & pharmacotherapie. 2016;81:93-103. PubMed PMID: 27261582. Epub 2016/06/05. eng.
24.Du X-J, Wang J-L, Iqbal S, Li H-J, Cao Z-T, Wang Y-C, et al. The effect of surface charge on oral absorption of polymeric nanoparticles. Biomaterials science. 2018;6(3):642-50.
25.Metwally FH, Abdelkawy M, Abdelwahab NS. Application of spectrophotometric, densitometric, and HPLC techniques as stability indicating methods for determination of Zaleplon in pharmaceutical preparations. Spectrochimica Acta Part A:
Molecular and Biomolecular Spectroscopy.
2007;68(5):1220-30.
26.Heydorn WE. Zaleplon - a review of a novel sedative hypnotic used in the treatment of insomnia. Expert opinion on investigational drugs. 2000;9(4):841-58. PubMed PMID: 11060714. Epub 2000/11/04. eng.
27.Nair AB, Jacob S. A simple practice guide for dose conversion between animals and human. Journal of basic and clinical pharmacy. 2016;7(2):27.
28.Kauppila T, Tanila H, Carlson S, Taira T. Effects of atipamezole, a novel alpha 2-adrenoceptor antagonist, in open-field, plus-maze, two compartment exploratory, and forced swimming tests in the rat. Eur J Pharmacol. 1991;205(2):177-82. PubMed PMID: 1687467. Epub 1991/11/26. eng.
29.Salama AA, Ibrahim BM. Neurotherapeutic effect of allopurinol against brain injury in hyperlipidemic rats. African Journal of Pharmacy and Pharmacology. 2015;9(22):567-75.
30.Bohrey S, Chourasiya V, Pandey A. Polymeric nanoparticles containing diazepam: preparation, optimization, characterization, in-vitro drug release and release kinetic study. Nano convergence. 2016;3(1):3.
31.Hoa LTM, Chi NT, Nguyen LH, Chien DM. Preparation and characterisation of nanoparticles containing ketoprofen and acrylic polymers prepared by emulsion solvent evaporation method. Journal of Experimental Nanoscience. 2012;7(2):189-97.
32.Naheed B and. Sailaja A. Effect of Formulation Variables on the Preparation of Ibuprofen Loaded Polymeric Nanoparticles. Pharmaceutical Nanotechnology. 2015;3(111).
https://doi.org/10.2174/221173850302151116123542 33.Celia C, Cilurzo F, Trapasso E, Cosco D, Fresta M, Paolino
D. Ethosomes® and transfersomes® containing linoleic acid: physicochemical and technological features of topical drug delivery carriers for the potential treatment of melasma disorders. Biomedical microdevices. 2012;14(1):119-30 34.Sherif S, Bendas ER, Badawy S. The clinical efficacy of
cosmeceutical application of liquid crystalline nanostructured dispersions of alpha lipoic acid as anti-wrinkle. European Journal of Pharmaceutics and Biopharmaceutics. 2014;86(2):251-9.
35.Sahoo SK, Panyam J, Prabha S, Labhasetwar V. Residual polyvinyl alcohol associated with poly (D,L-lactide-co-glycolide) nanoparticles affects their physical properties and cellular uptake. Journal of controlled release : official journal of the Controlled Release Society. 2002;82(1):105-14. PubMed PMID: 12106981. Epub 2002/07/11. eng.
36.Cooper DL, Harirforoosh S. Effect of formulation variables on preparation of celecoxib loaded polylactide-co-glycolide nanoparticles. PloS one. 2014;9(12):e113558.
37.Sharma N, Madan P, Lin S. Effect of process and formulation variables on the preparation of parenteral paclitaxel-loaded biodegradable polymeric nanoparticles: A co-surfactant study. asian journal of pharmaceutical sciences. 2016;11(3):404-16.
38.Yoshikawa Y, Hu Z, Kimura G, Murakami M, Yoshikawa H, Takada K. A dissolution test for a pressure-controlled colon delivery capsule: rotating beads method. The Journal of pharmacy and pharmacology. 1999;51(9):979-89. PubMed PMID: 10528979. Epub 1999/10/21. eng.
Cite this article as:
Sanaa A. El-Gizawy et al. Development and optimization of zaleplon loaded Eudragit® nanoparticles for oral delivery: In-vitro and In-vivo evaluation. Int. Res. J. Pharm. 2019;10(7):154-162 http://dx.doi.org/10.7897/2230-8407.1007236
Source of support: Nil, Conflict of interest: None Declared