Pain Assessment Using Facial Expressions By
Human And Machine
Sanjay Kumar Singh, V.Rastogi, I .L . Singh, S.K.Singh
Department of Computer Science Engineering, IIT (BHU), Varanasi, India
Department of Anaesthesiology, Institute of Medical Sciences, Banaras Hindu University, Varanasi-India Department of Psychology, Banaras Hindu University, Varanasi-India
Tel.: +91 9452185948, E-mail address: [email protected]
ABSTRACT: PAIN is the most common reason that patients go to visit doctors. Pain is not an easy sensation which will be simply accessed and could be directly measured. To make the right diagnosis and determine the most effective treatment plan for patients presenting with pain, systematic and precise pain assessment is required. The visual changes reflected on the face of a person in pain may be apparent for only a few seconds and occur instinctively. Tracking these changes is a time-consuming and difficult process in a clinical setting. This is often why it's motivating researchers and experts from medical, psychology and computer fields to conduct inter-disciplinary research in capturing facial expressions. The facial expressions of children's (0-2 years) in pain and in non-communicative patients need to be recognized as they are of utmost importance for proper diagnosis. The direct measurement of pain is related to the computation approach whereas indirect measurement is by observers ratings. The aim of this study is to correlate the results obtained from the observer, practitioner, and machine. The results showed that the experts often underestimated pain intensity in comparison to the observer and computational approaches used. This will cover both spheres of psychological vulnerability and resilience to pain along with the advanced techniques used in machine learning thereby improving the quality of care by increasing its accessibility to physicians.
Keywords: Pain Expressions; Pain Intensity; Self-Report; Active Appearance Models (AAMs); Support Vector Machines (SVMs).
1 INTRODUCTION
Pain is an unpleasant yet necessary signal that notifies us of actual or impending bodily damage and allows an individual to take action [1]. In clinical settings, this action could translate to patient diagnosis, medications or even a surgical procedure. Thus, measurement of pain is imperative for effective treatment. Signaling pain in others is highly salient [2, 3, 4] and elicits empathic responses in addition to changes in observers facial expression and vicarious pain [5]. The field of facial expression analysis has recently seen significant progress due to advancements in computer vision. Several studies have shown that facial behavior can be used as a modality for prediction of internal states such as mood and confusion [6, 7]. Estimates of pain intensity are commonly obtained in clinical settings via self-report and behavioral measures [8, 9, and 10]. The self-report measure allows an individual to verbally communicate the amount of experienced pain and suffers from several drawbacks such as subjective bias and patient idiosyncrasies. Moreover, it cannot be employed by verbally impaired patients. On the other hand, observational measures are based on inspecting non-verbal clues viz. body, face or voice of an individual in pain for reporting pain intensity. Such measures are disrupted by the presence of observer's bias, considerable demands on clinician's time, and the influence of factors such as likeability of patient [9, 10], underestimation of pain [11]. Since pain is inherently a subjective and internal experience, mostly preferred measures in comparison over others is the self-report which is considered the gold-standard for conveying pain intensity [12, 13]. Two major reasons generally make the task challenging for automatic measurement of pain from the face. First, is the lack of training and testing data of un-posed, unscripted and spontaneous pain expressions along with the behavioral observations in patients that have clinically significant pain. Second is the trouble of face and facial features analysis in genuine settings viz. medicinal clinics. When assessing pain (acute and chronic) there are multiple dimensions that should be considered for it to be
assessed. These dimensions include: (a) sensory (e.g., intensity, word descriptors, duration, location, and frequency), (b) affective/cognitive (pain unpleasantness), and (c) impact of pain on aspects of everyday life e.g. physical, emotional, and social). The most commonly used parameter in clinical practices is the measurement of the pain intensity or how much it really hurts [18]. In non communicative patients, an observer rating is required. Faces Pain Scale is commonly used where the observer chooses a face on the scale which best resembles the facial expression of the patient [19]. Our work is focused towards predicting pain intensity using facial expressions. We propose to use the facial expression information to objectify the process of both detecting and measuring pain intensity in clinical settings. Since pain is a complex signal, such an approach should be able to capture both the temporal dynamics and appearance variation of pain expression. Such automated methods for measuring pain intensity could be used to aid clinical staff in monitoring patient for long-term.
2. Psychological Approach
of observing higher levels of pain in others makes observers not so willing to judge others as being in pain, and they may not be able to differentiate correctly between pains of different intensities.
2.1 Materials and Methods
Ethics Statement
The study procedures followed were based on Declaration of Helsinki principle.
Participants
The sample consisted of 10 adults (6 women and 4 men) university students between 18 and 35 years (mean = 24, SD = 3.3). Prospective participants who reported visual impairments (e.g., uncorrected vision), having psychiatric problems or undergoing medical, psychological treatment and taking medication were not included for the study. Participants were given course credits for their participation.
Self-report measures
After the composed assent structures were marked, members finished the Interpersonal Reactivity Index (IRI) [21]. This survey (questionnaire) is initially intended to evaluate empathy from a multidimensional viewpoint and comprises of 28 things conveyed in four subscales measuring the affective and cognitive perspectives of empathy: Perspective Taking (PT), surveying the propensity to adopt the psychological viewpoint of others; Empathic Concern (EC), evaluating the inclination to experience feelings of warmth and sympathy toward others; Fantasy (FS), measuring the tendency to recognize oneself candidly with characters in fictional circumstances; and Personal Distress (PD), measuring self-oriented feelings as a consequence of seeing another's passionate trouble. Participants completed the Self-Assessment Manikin (SAM) [22] to rate normal, mild, moderate and severe pain conveyed by affective facial expressions. This consists of four sets of humanoid figures representing the dimensions of normal to severe pain. Each rating scale includes ten levels of intensity, ranging from a smiling to a frowning figure for normal, slight muscle movements for mild followed by a little more for moderate pain and high for severe pain. Participants were asked to assess their ratings on a 0-3 scale (0-no pain, 1-mild, 2-moderate, 3-severe pain) which they analyzed while viewing each facial expression.
2.2 Experimental task
The overall idea is to record and analyze the observer and expert’s opinion while they viewed the facial expressions. The experimental work were similar in nature as used by Roelof and colleagues [23] to examine behavioral responses to affective facial expressions (happy, neutral, and angry) along with a slight modification in which the participants and the practitioners (expert’s) were asked to rate the pain intensity level for each video frame separately. We decided to use dynamic rather than static facial expressions and to include expressions of pain ranging from normal (no pain) followed by mild, moderate and severe pain. From a set of video clips, the stimuli were taken of a self-prepared database of patients undergoing pain treatment in Institute of medical science, SSL Hospital,
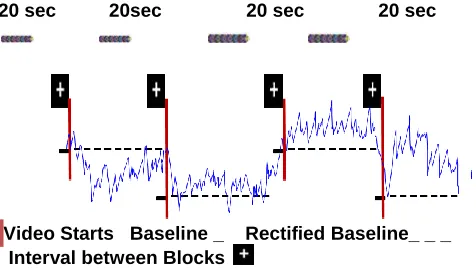
BHU, Varanasi (India). In the present study, ten faces of four males and six females displaying neutral, mild, moderate and severe pain facial expressions were used as affective stimuli. Individual expressions displayed in original video clips starting with a neutral face and ending at the maximum peak of each expression for 1 second. For obtaining a similar presentation time of the facial expressions as used in Roelof et al study [23], original video clips were slowed down to 2.5 seconds length and presented consecutively in blocks of 20 video clips using the same facial expressions (75 seconds) (Figure 1). Four blocks were designed which with a white fixation cross and were timely separated by a 20-seconds black screen. The presentation order of blocks is being pseudo randomized across subjects by using a Latin square design. In order to record participant response they were asked to press numbers on the keyboard e.g. 1 for normal face (no pain), 2 for mild pain, 3 for moderate and 4 for severe pain expressions. The task always started with a 60-seconds black screen followed by a white fixation cross to stabilize subject's concentration. The video clips (frames) were displayed by using the Super Lab 4.0 software on a 380 screen located at a distance of 200 cm using view angles of 23u (horizontal) and 17u (vertical). The responses were automatically generated on an Ms-excel sheet displaying the following attributes: Participant no., Day, Date and Time of filling, Trial name (Frame no.), Response (1-4 of keys pressed), Error Code (answer correct or wrong) and Reaction Time (time taken to identify the expressions in ms). While viewing the frames, participants sat in a comfortable chair positioned in front of the computer. They were alone with no one else present with proper lighting. Participants were also given a short training session prior to starting the experiment.
2.3 Video recording and data acquisition
Facial expressions were recorded with a standard webcam (Logitech) at 30 frames per second located in front of the subject and connected to a laptop. Using a simple Pressure Algometer (PA), the recordings were done, in which the pressure is increased to the limit such that the subject could resist it. Video recordings were converted into frames. Not all the frames were included in the study, except for those that showed major changes in the facial expressions during the various pain conditions.
Normal (None) Mild Pain (Weak)
20 sec 20sec 20 sec 20 sec
Video Starts Baseline _ Rectified Baseline_ _ _ Interval between Blocks
Figure 1. Description of experimental task and pain intensity signals elicited when viewing different pain related
facial expressions. Data present above the baseline represents the amplitude of facial muscle movements
occurring due to pain and data below the baseline correspond to the amplitude of no muscle movements.
2.4 Statistical analysis
Offline, independent observers rated pain intensity (OPI) observing the recorded video. Considerable training in the identification of pain expressions were provided to the observers.The ratings of observer were performed on a 4-point Likert-type scale that ranged from 0 (no pain) to 3 (strong pain). To assess the inter-observer reliability of the OPI pain ratings, the trials were independently rated by second rater (medical practitioner).The Pearson correlation between the observers and experts OPI were 0.60, (p < 0.001), which signifies low inter-observer reliability. Correlation between the subjects self-reported pain on the VAS and the observers rating were 0.71, (p < 0.001) for the trials used in the current experiment. A value of 0.70 is viewed as a large effect and is commonly taken as showing high concurrent validity. The inter-method correlation found here signifies moderate tohigh concurrent validity for pain intensity. Subjective data were checked initially for normal distribution using the Shapiro-Wilk test. As our datasets significantlydeviated from a normal distribution, the effects of the facial expression (normal, mild, moderate and severe pain) on dependent variables were evaluated using the Friedman test. The coding is done in such a manner that the accuracy and the response time in recognizing and classifying the painful facial expressions by both the observers were automatically generated on an Ms-Excel sheet. In addition, to compare all pairs of levels of the independent variable (facial expression) the Wilcoxon signed-rank test is being used. SPSS 19.0 statistical package were used to perform all analyses. For all statistical analyses a significance level of p = .05 were used.
3. Results
3.1 Subjective ratings
The Friedman test yielded a significant effect of facial expressions on normal [𝜒2
(2) = 64.51, p, .001], mild [𝜒2
(2) = 43.32, p, .001], moderate [𝜒2
(2) = 24.21, p, .001] and severe pain ratings [𝜒2
(2) = 11.06, p, .01]. Table1 shows mean and standard deviation of normal to severe pain ratings for each facial expression. Post-hoc pair wise mean comparisons revealed that severe pain faces were more
unpleasant than normal (no pain) [Z = 4.61, p, .001], mild pain [Z=5.10, p,001] and moderate pain faces [Z = 5.41, p, .001], and that normal faces were also more pleasant than pain ones [Z = 4.87, p, .001]. In addition, pain faces were more arousing than normal faces [Z = 3.19, p, .01].
Table 1. Mean (and standard deviation) of pleasantness, arousal, accuracy rate and response time.
Facial Expressio
n
Pleasan
tness Arousal
Accurac y (%)
Reactio n time (ms)
Normal 7.96 (1.5)
3.01
(2.1) 90 240
Mild pain 7.42 (1.4)
3.78
(2.2) 81 398
Moderate pain
3.60 (1.3)
4.08
(2.4) 79 406
Severe pain
2.80 (1.1)
5.27
(2.6) 85 350
Pleasantness ratings ranged from 1 (very unpleasant) to 9 (very pleasant), arousal ratings range from 1 (very calm) to 9 (very excited).
4. Computational Approach
4.1 Prkachin and Solomon Pain Intensity Metric (PSPI)
Much of the effort and energy have been made to study human behavior studies to identify valid pain indicators (e.g., [24], [25], and [26]). The studies shows the pain expression is widely characterized by the activation of a few set of facial muscles and coded by a set of action units (AUs): brow lowering (AU 4), eye closure (AU 43), levator labii raise (AU 9 and AU 10) and orbital tightening (AU 6 and AU 7) (see Figure 2). AU 43 being binary is taken as an exception, each of these actions are measured on a six-point ordinal scale (0 = absent, 5 = maximum) using FACS. In a study done recently Prkachin and Solomon [26] proved and confirmed that information of pain if effectively contained in these Aus and thus defined pain intensity as the sum of their intensities. The PSPI scale is defined as:
Pain= AU4 + (AU6║AU7) + (AU9║AU10) + AU43.. (1)
Figure 2 shows a face in severe pain from the self-prepared database with the corresponding AUs and their intensities. In this example, the pain intensity using the PSPI metric is computed as:
Pain = Intensity (AU4) + (Max Intensity AU6 or AU7) + (Max Intensity AU9 or AU10) + Intensity (AU43)
Considering the intensity of each AU, the PSPI in this example is equal to 12:
Pain = 4 + Max (3, 4) + Max (2, 3) + 1 = 4 + 4 + 3 + 1= 12.
Figure 2. Example of painful face from the self prepared database with the corresponding Action Units and their
intensities. (i = intensity of each AU).
4.2 Database
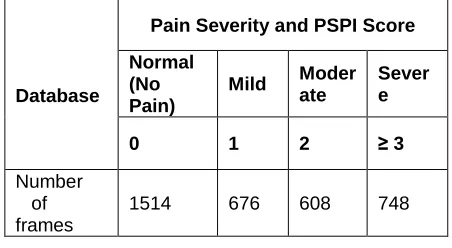
For the recognition of pain expression intensities, the evaluation of the proposed model is made on the self designed database of 10 patients. Sony digital cameras were used to record participant’s facial expressions. Videos were captured with a resolution of 140x200 pixels. An FACS-certified coder coded the facial action units (AU) based on a frame-by-frame basis. Here each AU is coded based on a 4-level intensity dimension (0-normal, 1-mild, 2-moderate and 3-severe). Using equation 1 and the PSPI metric described above the intensity of pain were annotated on each frame. The participants also completed the two self-report pain measures rating their intensity of pain which they experienced: the affective (AFF) verbal pain descriptors and the Visual Analog Scales (VAS). Using the four-point scale of AU intensity and equation 1, there is variation from 0 to 16. The observer scored obtained varied from 0 to 12. The PSPI scores were pooled so as to create a 4-point scale as shown in Table 2.
Database
Pain Severity and PSPI Score
Normal (No Pain)
Mild Moder ate
Sever e
0 1 2 ≥ 3
Number of frames
1514 676 608 748
Table 2. Number of video frames for four levels of pain intensity. For the automatic measurement of these four levels the proposed machine learning method are described
below.
5. MEASUREMENT OF PAIN EXPRESSION
INTENSITY
5.1 Preliminary analyzes
The PSPI were used to train automatic detectors of pain intensity. To evaluate the correspondence between the subject self-reported pain intensity and PSPI, the self-report measures were compared with each other and later with the PSPI. It is observed that the two self-report measures were highly inter-correlated (r= 0 .94 to r = 0.96, all p < 0.001), which represents high consistency between self-reports of pain intensity. To compare the PSPI to the self-report measures, we considered the PSPI score as the maximum intensity over all images for every sequence. While the Pearson’s correlations between self-reported pain and PSPI were r > 0.61 or higher, all p < 0.001. The obtained correlation suggests moderate to strong association between PSPI and self- reported pain intensity.
5.2 Overview
To automatically measure the pain intensity, active appearance models (AAMs) are initially used to extract the canonical appearance of the face (CAPP) [27, 28]. The CAPP obtained is then rescaled and passed through a set of Log-Normal filters [29]. The features extracted are at last given as inputs to four separate support vector machines (SVMs) trained for the automatic measurement of the four levels of pain intensity.
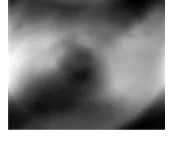
PSPI=0 PSPI=1 PSPI=2 PSPI>=3
Fig.3. Pain Intensity using PSPI metric
5.3 Active Appearance Model
texture and shape variability of the face [28, 32]. Using gradient-descent search, AAMs fit their shape and appearance components. The shape S of an AAM is described by a triangulated 2D mesh. The coordinates of the mesh vertices is defined by the shape S=[x1,
y1,x2,y2…,xn,yn] and ƞ is the number of vertices. The shape
is aligned using these vertex locations corresponding to a source appearance image. As AAMs include linear shape variation, the shape S is represented as a base shape S0
along with a linear combination of m shape vectors Si :
𝑠 = 𝑠0+ 𝑚𝑖=1𝑝𝑖𝑠𝑖 …… (2)
where the shape parameters are the coefficients p = (p1,…..,pm)
T
. All frames were automatically aligned through gradient descent AAM fitting algorithm which is described in [39]. Using [27, 28], the Canonical normalized appearance were derived from the shape and appearance parameters of the AAMs. CAPP a0 signifies that all the non-rigid shape variation has been normalized in respect to the base shape S0 [27]. Figure 3.b shows a CAPP example. This CAPP gives better performances in case of pain recognition compared to similarity-based features. As energy based representation has been found to be highly discriminative in comparison to grayscale image [33, 34], Log-Normal filters are used for the recognition of 4 levels of pain intensity automatically.
5.4 Log-Normal Filters
Pain expression is characterized by the deformations of facial features (see section 5.1). Figure 4.a shows an example where pain expression is characterized by a deepening and orientation change of the nasolabial furrows as well as closure of eyes. The pain intensity can be characterized by the magnitude of deformations taking place (such as the strong or soft appearance of nasal root wrinkles, the degree of eyes closure, etc.). With the magnitude of energy appearing in the face after the filtering process, deformations can be me assured directly compared to the normal state by looking at the energy based representation. In Figure 4.a. the appearance of nasal root wrinkles can be clearly observed. (Figure 4.b) represents high-energy magnitude after filtering process that can be seen as the whitest areas in figure 4.c. The results of CAPP are applied to Log-Normal filters [29]. On comparing this with the Gabor filters commonly used, it is observed that they sample the power spectrum in a better way and are tuned and separable in frequencies and orientations easily [29]. These attributes make it well suited for detecting features at various scales and orientations.
a) Input Frame b) Canonical Normalized Appearance
c) Log-Normal Filtering
Figure 4. (a) Input frame, (b) Canonical Normalized Appearance CAPP, (c) Log-Normal Filtering
5.5 Classification Based on Support Vector Machine
To examine the pain intensities based on the responses received through the Log-Normal filter, support vector machines (SVMs) [35] are used. SVMs are preferred over other classifiers because of its characteristic to cope with large representation spaces and are quite simple to train and generalize. SVMs are very well-suited to the high dimensional representation of responses obtained from Log-Normal filter which are dependent on the number of training examples [36]. Here the SVM is built for each pain intensity level. Using a linear basis function, each SVM is trained on the images (section 4.2). In order to classify separately, the four pain intensity levels, four linear basis function SVMs are employed.
Each SVM-based intensity detector is trained using the positive examples consisting of frames with the PSPI metric labeled, which is equal to that particular intensity. The data is evaluated by using the 5-folds cross-validation process and the other leave-one-subject out validation process, in which all the images of training are excluded from testing.
6. PERFORMANCES
6.1 Classification Results
The performance of the proposed SVM classifiers for the four intensity levels is examined. to quantify the performance of each classifier in comparison to the ground truth, the PSPI we used F1, Recall, and precision. The 5-folds cross-validation in which all video frames of the testing set are removed from the training set is used first for the evaluation. The performance obtained of each SVM is reported in Table 3. Best results are obtained for no pain (PSPI=0) and strong pain (PSPI>=3). The following results may be explained by the extreme difference between these two intensity levels relative to intermediate ones (see Figure 3). The obtained performances are encouraging given the task difficulty.
5-folds cross validation
Leave one subject out validation
Intensity CR PR F1 F1 CR PR
0 95 93 94 61 63 55 1 94 95 90 72 35 65 2 94 95 89 77 33 38 >=3 96 96 93 78 68 58 CR = Classification Rate (%), PR= Precision (%), F1 = F1 measure (%).
Table 3. Performances of Pain Intensity measurement
The Five-fold cross-validation is not actually participant-independent. The frames from the same participant may be reflected in both the training and testing sets. In order to overcome this limitation, we then performed a leave-one participant out cross-validation where all the corresponding images of the training are completely removed from the testing. Because of this validation it allows exploring how the proposed method for measurement of pain intensity generalizes to a new set of participants who were not part of the training set. Leave-one- subject-out validation, consider building 25 classifiers for each one of the four levels of pain intensity and the process is repeated. In case of leave one subject out validation, the total number of training frames from all the video sequences is generally large for training a SVM, as the training time complexity for SVM is O (m3), where m is the number of training examples [35]. To make the learning process practical, in order to make the best use of the training data, each video sequence is down-sampled by taking one of every frame [37]. On only 15% of video images excluding one participant, the training is thus performed. On the left-out participant the SVM testing is then made. Based only on 15% of the training data, the obtained F1 for each level of pain intensity (from 0 to 3) were 0.55, 0.65, 0.38, and 0.58, respectively.
6.2 Intra Class Correlation Coefficient
The prior results are meant for category-level agreement. The following section focuses on comparing the consistency of 4-level automatic measurement with the PSPI. In order to accomplish this, the reliability between the PSPI and the proposed method is quantified by the intra-class correlation coefficient (ICC) [38]. We found that the values fall within a restricted interval [-1, 1]. A perfect consistency is indicated if ICC is 1. To calculate the reliability of judgments ICC is used. ICC is also used to measure concurrent validity between manual and automatic coding of intensity [37]. The ICC values for the automated measurements and the manually labeled pain intensity levels using the PSPI were 0.85 and 0.55 for 5-folds and leave-one-subject-out validation, respectively. Based on the results, PSPI suggest moderate to high consistency between manual and automatic measurement of pain intensity.
7. Discussion and Conclusion
The aim of the study is to evaluate the pain intensity elicited by the observation of facial pain expressions. In the psychological approach, we compared the ratings of pain intensity given by both the categories of observers by observing the facial expressions of pain on a frame by frame basis. The participants rated normal and severe pain faces with good accuracy; however, there were differences of opinion with respect to the mild and moderate pain faces. These same observations were reported by the use of computational algorithms. It is observed that both normal and severe pain faces took lesser response time in comparison to mild and moderate pain faces on a frame by frame basis. For both the participant and the expert (practitioner) separately, the scores obtained were recorded during the experiment.
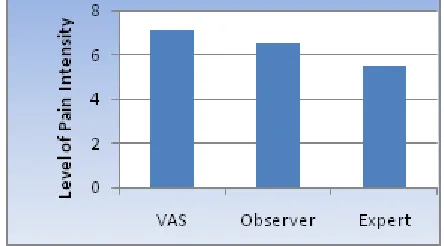
Figure 5. The mean of the pain intensity scores received by the three categories of observer’s i.e., self-report provided
by the patient (VAS), observer and expert (practioner).
clinical setting is a feasible task. For behavioral measurement, intra-class correlation results were within the acceptable range. Replication in shoulder pain populations and applications to other types of pain would be next steps for future research. The current work opens several additional directions for future investigations. First is to compare additional types of features (e.g., Gabor) and classifiers. Second is to evaluate whether pain intensity might be detected better by first detecting AU intensity and then calculating PSPI from the result. In our work, classifiers were trained to directly detect PSPI scores without first detecting individual AU intensities. Detection of AU intensity is in the early stages of research [37]. To our understanding, no one has yet compared direct versus indirect measurement of the intensity of pain or other constructs. Third, following previous work, we measured pain at the frame-by-frame level. However, pain expression is not static but results from the progressive deformation of facial features. Further investigation would be to include dynamics for measuring pain intensity. A potentially informative signal is the head pose. These head pose changes may themselves be a good indicator of pain [39] and pain intensity. We are currently in the process of exploring the dynamic characteristics of head orientation such as (but not limited to) the speed, velocity, and (but not limited to) the speed, velocity, and acceleration of pain indicators. We believe explicit attention to dynamics is an exciting direction for further research.
Acknowledgments
No grants or funds were provided. The authors declare that they have no conflict of interest.
References
[1] A.Huguet, J.N.Stinson and P.J.McGrath, “Measurement of self-reported pain intensity in children and Adolescents,” Journal of psychosomatic research, vol. 68, pp. 329 – 336, 2010.
[2] D. Simon, K.D.Craig, F. Gosselin, P. Belin and P.Rainville, “Recognition and discrimination of prototypical dynamic expressions of pain and emotions,” Pain, vol. 135, pp. 55–64, 2008.
[3] M.Rotteveel and R.H. Phaf, “Automatic affective evaluation does not automatically predispose for arm flexion and extension,” Emotion, vol. 4, pp.156–172, 2004.
[4] M. Gonzalez-Roldan,M. Martınez-Jauand, M.A. Munoz-Garcıa, C. Sitges and I. Cifre, “Temporal dissociation in the brain processing of pain and anger faces with different intensities of emotional expression,” Pain, vol. 152, pp. 853–859, 2011.
[5] A.M.Gonzalez-Roldan, M.A.Munoz,I. Cifre, C. Sitges and P. Montoya, “Altered psychophysiological responses to the view of others’ pain and anger faces in fibromyalgia patients,” The journal of pain, vol. 14, pp. 709-719, 2013.
[6] M.S. Bartlett, G.C. Littlewort, M.G. Frank, C. Lainscsek, I .Fasel and J. Movellan, “Recognizing facial expression: machine learning and application to spontaneous behavior”. In Computer Vision and Pattern Recognition, IEEE, vol. 2, pp.568–573, 2005.
[7] G. Littlewort, J. Whitehill, T.F. Wu, N. Butko, P. Ruvolo, J. Movellan and M. Bartlett, “The motion in emotion-A CERT based approach to the FERA emotion challenge,” In Automatic Face & Gesture Recognition and Workshops IEEE , vol. 151, pp. 897–902, 2011.
[8] C.L. Von Baeyer, L.J.Spagrud, “Systematic review of observational (behavioral) measures of pain for children and adolescents aged 3 to 18 years,” Pain, vol. 127, pp.140–150, 2007.
[9] J.N.Stinson, T. Kavanagh, J. Yamada, N. Gill and B. Stevens, “Systematic review of the psychometric properties, interpretability and feasibility of self-report pain intensity measures for use in clinical trials in children and adolescents,” Pain vol. 125, no. 1, pp.143–157, 2006.
[10]D. Tomlinson, C.L. von Baeyer, J.N. Stinson and L. Sung, “A systematic review of faces scales for the self-report of pain intensity in children,” Pediatrics, 2010.
[11]K.M. Prkachin, S. Berzins and S.R.Mercer, “Encoding and decoding of pain expressions: A judgement study,” Pain, vol. 58, pp. 253–259, 1994.
[12]H. Zhou, P. Roberts and L. Horgan, “Association between self-report pain ratings of child and parent, child and nurse and parent and nurse dyads: meta analysis,” Journal of Advanced Nursing, vol. 63, pp. 334–342, 2008.
[13]K.D. Craig, “The facial expression of pain better than a thousand words? ” APS Journal , vol. 3, pp. 153–162, 1992.
[14]W.E. Fordyce and St. Louis, “Behavioral Methods for Chronic Pain and Illness,” 1976.
[15]K.M. Prkachin and K.D. Craig, “Influencing nonverbal expressions of pain: Signal detection analyses,” Pain, vol. 21, pp. 399-409, 1985.
[16]P. Ekman and W.V. Friesen, “Investigator’s guide to the Facial Action Coding System,” Palo Alto: Consulting Psychologists Press 1978.
[17]C.E. Izard, “The Face of Emotion,” New York: Appleton-Century-Crofts 1971.
[18] C. Eccleston, S. Morley, A. Williams, “Systematic
review of randomized controlled trials of
and adolescents, with a subset meta-analysis of pain relief,” Pain, vol. 99, pp.157–65, 2002.
[19]K.M. Prkachin, “ Pain behaviour is not unitary,” Behavioral Brain Science , pp. 754-757, 1986.
[20]R Rosenthal, “Judgment Studies: Design, Analysis and Meta-analysis,” Cambridge: Cambridge University Press, 1993.
[21]M.H.Davis, “A multidimensional approach to individual differences in empathy. A multidimensional approach to individual differences in empathy” pp. 10:85,1980.
[22]M.M. Bradley and P.J. Lang, “Measuring emotion: the Self-Assessment Manikin and the Semantic Differential,” J Behav Ther Exp Psychiatry, vol. 25, pp. 49–59, 1994.
[23]K. Roelofs, M.A. Hagenaars and J. Stins, “Facing Freeze: Social Threat Induces Bodily Freeze in Humans,” Psychological Science, vol. 21, pp.1575–1581, 2010.
[24]A.C Lints-Martindale, T. Hadjistavropoulos, B. Barber and S.J.Gibso, “A psychophysical investigation of the facial action coding system as an index of pain variability among older adults with and without Alzheimer's disease,” Pain, vol. 8, pp. 678-89, 2007.
[25]K.M.Prkachin, “The consistency of facial expressions of pain: a comparison across modalities,” Pain, vol. 51, pp.297–306, 1992.
[26]K.M.Prkachin and P.E.Solomon, “The structure, reliability and validity of pain expression: Evidence from patients with shoulder pain, ” Pain , vol. 139, pp. 267-274, 2008.
[27]P. Lucey, J.F. Cohn, J. Howlett and S.Sridharan, “Recognizing emotion with head pose variation: Identifying pain segments in video,” Systems, Man, and Cybernetics – Part B vol. 41, no. 3, pp. 664-674, 2011.
[28]S. Lucey, A. Ashraf and J. Cohn, “Investigating spontaneous facial action recognition through AAM representations of the face, in Face Recognition Book”, Kurihara K, Ed. Pro Literatur Verlag, 2007.
[29]Z. Hammal and C. Massot, “Gabor-like Image Filtering for Transient Feature Detection and Global Energy Estimation Applied to Multi-Expression Classification”. In Communications in Computer and Information Science (CCIS 229) (eds. P. Richard and J.Braz, Springer, CCIS 229, pp. 135-153, 2011.
[30]T. Cootes, D. Cooper, C. Taylor and G. Graham, “Active shape models - their training and
application,” Computer Vision and Image Understanding, vol. 61, no. 1, pp. 38–59, 1995.
[31]A.B. Ashraf, S. Lucey, J.F.Cohn, T. Chen, K.M. Prkachin and P.E.Solomon, “The painful face: Pain expression recognition using active appearance models, ” Image and Vision Computing, vol. 27, pp.1788– 1796. 2009;
[32]I.Matthews and S.Baker, “Active appearance models”revisited, International Journal of Computer Vision, vol. 60, no. 2, pp.135–164, 2004.
[33]G. Donato, M. Bartlett, J .Hager, P. Ekman and T. Sejnowski, “Classifying facial actions,” IEEE Transactions on Pattern Analysis and Machine Intelligence, vol. 21, no. 10, pp. 974–989. 1999.
[34]P. Lucey, S. Lucey and J.F..Cohn, “Registration invariant representations for expression detection,” International Conference on Digital Image Computing: Techniques and Applications (DICTA), 2010.
[35]J.C.Burges-Christopher, “A Tutorial on Support Vector Machines for Pattern Recognition, ”Data Mining and Knowledge Discovery, vol. 2, pp.121– 167,1998.
[36]M.S.Bartlett, G. Littlewort, M. Frank, C. Lainscsek, I. Fasel, J. Movellan, “Fully Automatic Facial Action Recognition in Spontaneous Behavior,” Proceedings of the 7th International Conference on Automatic Face and Gesture Recognition, 2006.
[37]M.H. Mahoor, S. Cadavid, D.S. Messinger and J.F.Cohn,“A Framework for Automated Measurement of the Intensity of Non-Posed Facial Action Units”. 2nd IEEE Workshop on CVPR for Human Communicative Behavior analysis (CVPR4HB), Miami Beach, 2009.
[38]P. Shrout and J. Fleiss, “Intraclass correlations: uses in assessing rater reliability,” Psychological Bulletin, vol. 86, no. 2, pp. 420–428, 1979.