Provenance Aware Sensor Networks
for Real-time Data Analysis
Reinier-Jan de Lange
Department of Computer Science
Supervisors:
Enschede, March 14, 2010
This publication is the result of a collaboration between the Computer Science (CS) de-partment of the University of Twente in the Netherlands and the aquatic research insti-tute EAWAG, in particular the department of Water Resources and Drinking Water (WUT, Wasser und Trinkwasser), in Switzerland. This collaboration has advantages for both par-ties:
• At the WUT department the use of sensors for measuring environmental changes is part of most running projects. Due to the day to day use of these sensors, require-ments originate for retrieving, processing and querying the measurement results. By optimizing this data workflow, a lot of time and money can be saved. However, the institute is not specialized in this scientific field of work, therefore the collaboration with the CS department is very beneficial.
• The CS department at the university recently started investigating technical solutions for managing sensor data. There is still a lot of uncertainty on how streaming data should be handled. It is not a simple case of just persisting sensor data: sensor data in its raw form doesn’t really reveal anything interesting. In most cases, some processing (joining, aggregating, etc.) needs to be done to make the data useful. Although these concepts are not new, it is hard for a CS engineer to tell which processing steps yield interesting results. By collecting requirements regarding sensor data from the researchers at the WUT department, they can get a much better understanding of the challenges involved.
Preface i
1 Introduction 3
1.1 Case study: the Distributed Temperature Sensor . . . 3
1.2 Problem Description . . . 3
1.3 Research Questions . . . 4
1.4 Project Outline . . . 5
2 Sensor Middleware Survey 7 2.1 Functionality Description . . . 7
2.1.1 General Functionality. . . 7
2.1.2 Windowing Functionality. . . 10
2.1.3 Storage . . . 11
2.2 Software . . . 11
2.2.1 Global Sensor Networks (GSN) . . . 11
2.2.1.1 About GSN . . . 11
2.2.1.2 GSN Functionality. . . 12
2.2.2 52◦North . . . 15
2.2.2.1 About 52◦North . . . 15
2.2.2.2 52◦North Functionality . . . 15
2.2.3 Open SensorWeb Architecture (OSWA) . . . 18
2.2.3.1 About OSWA . . . 18
2.2.3.2 OSWA Functionality . . . 19
2.2.4 Other solutions . . . 20
2.2.4.1 System S . . . 20
2.2.4.2 SONGS . . . 21
2.2.4.3 IrisNet . . . 21
2.3 Middleware Functionality Summary Table . . . 22
2.4 Case study: Middleware . . . 26
2.4.1 Domain . . . 26
2.4.2 Current situation . . . 26
2.4.3 User requirements . . . 28
3 Provenance 31
3.1 Basic Types of Provenance . . . 31
3.2 The Provenance Challenge . . . 31
3.3 The Open Provenance Model (OPM) . . . 32
3.4 Provenance Recording Objectives . . . 33
3.5 Provenance over Time . . . 34
3.5.1 Workflow State . . . 34
3.5.2 Partial Provenance Graph Updates Using Timed Annotations . . . . 35
3.5.3 Workflow State Checkpoints . . . 35
3.6 Related Work . . . 36
3.6.1 PReServ: Provenance Recording for Services . . . 36
3.6.2 Provenance Aware Storage System (PASS) . . . 37
3.6.3 Trio . . . 38
3.6.4 Chimera. . . 38
3.7 Case study: Provenance . . . 38
3.7.1 Provenance Graphs for Sensor Data . . . 39
3.7.2 Recording and Querying the Provenance Service . . . 40
4 A Query Processing Approach 43 4.1 The Query Network . . . 43
4.1.1 Processing Elements (PE’s) . . . 44
4.1.2 Formalization . . . 44
4.2 The Query Manager . . . 46
4.2.1 Architecture. . . 46
4.2.2 Sinks . . . 47
4.2.3 Query Planning & Optimization . . . 47
4.2.4 Query Definition . . . 48
4.3 Case study: Query Processing . . . 48
5 Sensor Network Query Language Design 49 5.1 Sensor Network Query Language Requirements . . . 49
5.1.1 QL-RE1: Support for interval selections over multiple attributes . . 50
5.1.2 QL-RE2: Support for fixed, landmark and sliding windows . . . 50
5.1.3 QL-RE3: Support for aggregations. . . 50
5.1.4 QL-RE4: Support for stream merging . . . 50
5.1.5 QL-RE5: Support for joining streams . . . 50
5.1.6 QL-RE6: Support for querying sensor data through annotations . . 51
5.1.7 QL-RE7: Support for output structure transformations . . . 51
5.1.8 QL-RE8: Pagination support . . . 51
5.1.9 QL-RE9: Limit expressiveness for easy querying . . . 51
5.1.10 QL-RE10: Support for querying provenance. . . 51
5.2 Case study: Query Language Specification . . . 51
5.2.1 Query Syntax Examples . . . 52
5.2.2 The Query Language Survey . . . 52
5.2.3 Survey Results . . . 53
5.2.3.2 Query Example Preference . . . 54
5.2.3.3 Interval Notation. . . 55
5.2.3.4 Other Remarks. . . 55
5.2.4 Survey Conclusions. . . 56
5.2.5 Final Query Language: PASN-QL . . . 56
6 Case study: Prototype 59 6.1 Global System Architecture. . . 59
6.1.1 Processes . . . 59
6.1.2 External Services . . . 59
6.1.3 Service Providers . . . 61
6.1.4 Backend Services & Applications . . . 61
6.1.5 Infrastructure . . . 61
6.2 Implementation . . . 61
6.2.1 Query Manager (QM) . . . 61
6.2.2 Query Network (QN) . . . 62
6.2.2.1 Workflow . . . 64
6.2.2.2 Orchestration . . . 64
6.2.2.3 Stream Sinks. . . 64
6.2.2.4 Implementation Alternatives . . . 66
6.2.2.5 Features . . . 67
6.2.3 PASN-QL. . . 68
6.2.3.1 Lexer & Parser . . . 68
6.2.3.2 Tree Walker . . . 68
6.2.3.3 Command Interpretation. . . 68
6.2.4 Tupelo2 Provenance Server . . . 69
6.2.5 Web Services . . . 70
6.3 Testing & Validation . . . 72
6.3.1 Fulfilled User Requirements . . . 72
6.3.2 Fulfilled Provenance Requirements . . . 73
6.3.3 Fulfilled Query Language Requirements . . . 74
7 Conclusion 77 7.1 Results. . . 77
7.2 Contribution . . . 78
7.3 Future Work . . . 78
7.3.1 Middleware Research. . . 78
7.3.2 Provenance . . . 79
7.3.3 Query Processing . . . 79
7.3.4 Query Language Design . . . 79
7.3.5 Prototype . . . 79
Acknowledgments 81
Appendices 82
B ANTLR V3 Lexer/Parser Grammar 89
C ANTLR V3 Tree Walker Grammar 91
1 GSN functionality . . . 14
2 52◦North functionality . . . 18
3 OSWA functionality. . . 20
4 Middleware survey summary table . . . 26
5 DTS retrieval user requirements . . . 29
1 A GSN container [1] . . . 12
2 52◦North SOS architecture [2] . . . 15
3 OSWA SCS architecture [3] . . . 18
4 RECORD project domain . . . 27
5 Current DTS data flow . . . 28
6 Graphical representation of OPM entities . . . 32
7 The provenance of baking a cake [4] . . . 32
8 Overlapping account of the provenance model of baking a cake . . . 33
9 Example provenance graph using timed annotations . . . 35
10 Provenance graph for a sensor network view . . . 39
11 Example of recording & querying provenance using an OPM enabled prove-nance service . . . 40
12 The Query Network . . . 44
13 The Query Manager with the Query Network . . . 47
14 Main research areas of the participants . . . 53
15 Percentage of participants with programming experience per main research area . . . 54
16 Reasons for preferring the verbose notation (40% of the participants) . . . . 54
17 Reasons for preferring the mathematical notation (60% of the participants) . 55 18 Familiarity with interval notation . . . 55
19 Prototype global system architecture . . . 60
20 Query Manager global architecture . . . 62
21 Query Network architecture . . . 63
22 Example workflow sequence diagram . . . 65
23 Stream sinks . . . 65
24 An example provenance graph returned by the Tupelo provenance service . 69 25 Query Manager services & the Query Network manager . . . 70
26 RegistrationServlet interaction sequence diagram . . . 72
Introduction
At EAWAG, sensor data is normally processed by first deploying a sensor, then coming back periodically to download the data and finally importing that data in a statistical analysis ap-plication like Matlab or R. By setting up a sensor network, data can be archived, searched for and processed online, allowing sensor data to be reused over multiple projects and pro-viding real-time data analysis. When creating a historical archive, metadata becomes very important for the sensor data to make sense: if configuration changes are not recorded, anal-ysis done on the sensor data can hardly be justified. To this end, this thesis will focus on the creation of a workflow that is able to recordprovenance, a type of metadata describing the origin of data.
1.1 Case study: the Distributed Temperature Sensor
A Distributed Temperature Sensor (DTS) is a next generation sensor for sensing temperature over long distances [5], which is described in further detail in this thesis. It is used by EAWAG to measure the temperature on several places in the side channels of the river Thur to find groundwater influxes: a colder measurement usually depicts a location of such an influx. The DTS will be used as a case study. It will show the whole workflow from the beginning to the end: Reading out the data, processing and persisting the results, recording the process and making it available to the end users. Moreover, the case should clarify which requirements exist and of how much importance they are in order to come up with a good system architecture.
1.2 Problem Description
• The workflow should be able to process streaming data. Getting new sensor data as soon as possible can be very important, since new measurements may predict (natu-ral) disasters. To be able to understand and possibly prevent these disasters, new data should be processed as soon as it comes in.
• The different data sources can be hosted by different organizations, therefore the infrastructure must be able to cross organizational boundaries.
• The workflow should support annotating sensor data on the fly. For example, in order to quickly detect ‘interesting’ measurements, it should be possible to directly classify and annotate the data. An added advantage is that users may even be alerted (by mail, SMS, etc.) upon receiving interesting values, which can be very useful if actions need to be undertaken fast.
• There should be a way to keep track of the sources and processes that were involved in producing a given set of results, which is needed to justify scientific findings based on those results.
• There should be a straightforward way for the users of the system to query the recorded data.
Distributed processing of streaming data is not a new topic, it has already been applied in some systems. To avoid reinventing the wheel, research should be done on finding already existing systems that aim at solving this problem and see to what extent those solutions can be reused.
1.3 Research Questions
This thesis will try to answer the following main research question:
How to apply real-time data analysis on streaming sensor data and manually sampled data considering data provenance?
In order to answer this question, the following subquestions have been defined:
1. What are the requirements of such an infrastructure derived from existing systems and literature?
2. What is the conceptual model of the proposed infrastructure?
3. What is the supported query language as a user interface for the proposed infrastruc-ture?
4. How does the architecture and implementation of the proposed infrastructure look like?
5. How is the proposed approach applicable to the Distributed Temperature Sensor use case from EAWAG?
1.4 Project Outline
To answer the aforementioned research questions, this report will start in chapter2with a description of requirements that should be fulfilled by sensor middleware, followed by a domain analysis of publicly available existing sensor middleware solutions, and to which extent they fulfill these requirements. Next, a separate chapter, namely chapter3, has been dedicated to provenance. It will describe what provenance metadata is, why it is essential in sensor data processing and how this can be recorded and retrieved. These first two chapters are meant to answer the first research question.
In order to answer the second research question, an architecture of a query processing system will be described in chapter 4. It will show an approach for query processing of sensor network data from multiple sources. The third research question will be treated in chapter 5, which will describe the requirements and the design of a query language for querying sensor data and metadata. The architecture and implementation of the proposed workflow will be described by means of the development of a prototype in chapter4. This prototype will not implement all concepts, but is mainly meant to clarify and validate the workflow. Finally, the thesis will end with the final conclusions in chapter7.
Sensor Middleware Survey
Sensor middleware deals with reading data coming from sensors or sensor networks, option-ally aggregating or processing that data and storing the result in a database system. Several solutions have already been implemented and assessed [6], but each solution has its own set of features. This chapter will therefore start off with a comprehensive list of functionalities that sensor middleware should and could have, which can be used as reference for assessing existing solutions and implementing new ones. Next, a survey will be conducted on three relatively recent solutions, which will finally be used in the case study.
2.1 Functionality Description
A lot of aspects should be taken into account by sensor middleware. This section covers which functionalities sensor middleware should have or functionalities that might be nice to have. Requirements may differ greatly depending on the environment, the sensors used and how the sensor data is analyzed. The requirements listed here have partly been derived from literature on this topic [7,8,9] and partly by deriving requirements from documented features incorporated in existing middleware systems [6,10,11,12,3,13,14,15].
2.1.1 General Functionality
Distribution In a sensor network, distributing services can be very important. A common reason is to distribute the load. One computer may be responsible for communicating with a sensor, while processing and presentation is done on other machines. Within sensor networks, often resource constrained devices are involved, such as small Net-books or embedded systems, which can only handle small tasks and are unable to store large amounts of data. Finally, distributing services enables complex data pro-cessing by using sensor data from multiple data sources. These data sources can be sensors, but also manually recorded data or pre-processed sensor data stored on different servers [10].
detect temperature (air, surface), wind speed, humidity and more.
Sensordata metadata recording To be able to understand what some data actually rep-resents, you need some kind of context [9]. Regarding sensor data, this could for example be the configuration of the sensor (e.g. the orientation or angle) or aggrega-tions/classifications performed on the data. Some of this metadata could be part of the sensor specification (for example the location of the sensor), but this is only the case for static (non-changing) variables.
Sensor access All sensor middleware needs some way to communicate with a sensor. Usu-ally this will involve writing some code, since most sensors have their own commu-nication protocol. There are also a lot of different ways to connect to sensors, for example through a serial connection, LAN, WAN or USB.
Sensor discovery Within a good sensor network, it should be possible to add or remove sensors without stopping the (whole) system, since stopping the system may imply loss of important sensor data.
Processing chains Multiple services can benefit from other services making some trans-formation on sensor data. This may be an aggregation, combination or classification of the data. As an example, an actuator service and a notification service could use a common classification service that finds interesting measurements.
Querying An important aspect of sensor middleware is how data can be queried. For some services, getting new sensor data as soon as possible is a must, while other services may be more interested in historical data. So, the system should provide a means of querying realtime as well as offline in an efficient way.
Presentation A good presentation layer is needed to efficiently show sensor data to the user. Since queries may take a long time to complete, calls to the system should be made asynchronously. Other important features of the presentation include keeping the user up to date with what the system is doing and presenting the data in a clear way by using charts or multiple page reports.
Service discovery Once a service is running, it should somehow notify people or other systems of that fact. When using Webservices, this can be achieved by using UDDI. Another approach that is becoming popular within the sensor network community is by publishing sensor data to globally available web services, for example SensorMap [16] or SensorBase [17].
Access control Most sensor data is not highly classified material, but there are exceptions, like images or video captions from (security) cameras. Therefore, there should be a way to secure that kind of data.
Communication protocol The communication protocol can be an important aspect with regard to sensor data. Since the amount of data itself can be quite large, the protocol should be kept simple to avoid getting a lot of overhead.
Fault tolerance Within a sensor network, a lot of things can go wrong. Sensors can be bro-ken, down or just unreachable and connections are usually not very stable, resulting in failed communication or corrupt data. The system should take this knowledge into account and react appropriately when communicating with a sensor fails.
Standards Using standards is often a good idea, since other users of the system will know what to expect from it. Usually standards are very well documented and will thus enable users to interact with the system by just following the rules defined by the standard. It also simplifies integration with other systems that comply to the standard. The most important set of standards with regard to sensor networks come from the Sensor Web Enablement (SWE) initiative of the Open Geospatial Consortium (OGC) [8]. Standards are provided for the different parts making up a sensor network as well as the communication between these parts. The following specifications have been developed:
Observations & Measurements (O&M) Standard models and XML Schema for en-coding observations and measurements from a sensor, both archived and real-time.
Sensor Model Language (SensorML) Standard models and XML Schema for de-scribing sensors systems and processes associated with sensor observations; provides information needed for discovery of sensors, location of sensor ob-servations, processing of low-level sensor obob-servations, and listing of taskable properties.
Transducer Model Language (TransducerML or TML) The conceptual model and XML Schema for describing transducers (devices that that convert variations in a physical quantity, such as pressure or brightness, into an electrical signal) and supporting real-time streaming of data to and from sensor systems.
Sensor Observations Service (SOS) Standard web service interface for requesting, filtering, and retrieving observations and sensor system information. This is the intermediary between a client and an observation repository or near real-time sensor channel.
Sensor Planning Service (SPS) Standard web service interface for requesting user-driven acquisitions and observations. This is the intermediary between a client and a sensor collection management environment.
Sensor Alert Service (SAS) Standard web service interface for publishing and sub-scribing to alerts from sensors.
Web Notification Services (WNS) Standard web service interface for asynchronous delivery of messages or alerts from SAS and SPS web services and other ele-ments of service workflows.
The choice whether or not to use these standards will often depend on the desired level of interoperability. Following the standards will simplify integration with un-known third party systems, but may make the system overly complex for the taks it is supposed to do.
[7]. This can be done by the collecting system itself or by a separate service. The drawback of the latter is that all data will need to be encoded and decoded before it is processed.
Alerters / Notifiers A frequent use case is that users monitoring something would like to be notified as soon as possible when something out of the ordinary occurs, for example a sudden drop in temperature or a sensor breaking down. This introduces the need for a notification service that is able to alert people wherever they are, for example by sending an SMS or e-mail.
Actuators Sometimes, it would be nice if the system would automatically react upon de-tecting anomalies. When a sensor is returning remarkable values, an actuator can react by changing the configuration of the sensor or by increasing the sampling rate in the system itself.
Handling of changing variables For archived sensor data to make sense, variables (like the configuration of a sensor) should either never change or changes should be recorded. When changes to the configuration occurs and that information is lost, sensor data with different configurations will get mixed together, causing the data and all analy-sis on that data to become incorrect and unprovable. Clearly, when using actuators this becomes a very important feature of the middleware.
Shared execution To allow multiple users to access the system at once, it should be mul-tithreaded. It will seldom be the case that only one user is involved in analyzing the recorded data.
2.1.2 Windowing Functionality
When working with realtime sensor data, only an excerpt of a stream is of interest at any given time. This is the motivation for creatingwindow models. A window always consists of two endpoints (moving or fixed) and a window size. Windows are either time based or count based [7]. This yields the following functionality:
Time based windows Time based windows define the window size in terms of time. It will only consist of data that falls within a certain time span, for exampleone hour orten minutes. When newly added sensor data is extending the time span beyond the window size, the endpoints are moved, resulting in asliding window.
Count based windows Count based windows define the window size as the number of tuples it contains. A window can for example have a size of 2000 tuples, meaning that there will never be more than 2000 tuples in it.
Fixed windows A fixed window is a window for which both endpoints are fixed: a window of a fixed point in time (e.g. from the year 2000 to 2001). Fixed windows are based on historical data.
Landmark windows A landmark window is a window in which only one endpoint changes. Often the left endpoint is fixed and the right one moves, causing the window to grow over time (e.g. a window of all data since midnight).
Update interval There are a couple of possibilities to update the window as new data comes in. One is to update after every tuple. However, sometimes it’s better to batch process, meaning the window is only updated after receiving a fixed number of tuples or after a fixed amount of time. This results injumping windows. When the interval is larger than the window size, the whole window is changed after every update. These kind of windows are calledtumbling windows.
2.1.3 Storage
A stream management system usually consists of three types of data storage: temporary storage, summary storage and static storage [7]. The storage model chosen for each of these three types is important for a middleware system to work efficiently. Options include relational databases, flat files and storage in main memory (as objects or using an in-memory database).
Temporary working storage The temporary working storage is for storing window queries or caching. This data will usually be stored in-memory.
Summary storage Summary storage is for recording historical data, presumably aggre-gated in some way. Since this can be a large amount of data, this is usually stored on disk.
Static storage Fixed metadata about sensors, like its geographical location, manufacturer and output specification is all part of static storage. This data can usually be found in flat files or is stored in a relational database.
2.2 Software
Since the concept of sensor networks was invented, several solutions have been imple-mented. Some of these are domain specific prototypes, others are closed source and for in-house usage only and most of them have been discontinued after the project was fin-ished. Just a few aim at creating a generic, publicly available solution. A full assessment will be made of three projects that are at the time of writing the most active projects that aim at providing a sensor network solution that can be applied in several environment de-velopments, namely Global Sensor Networks (GSN) [1], the OGC SWE implementation by 52◦North [2] and the Open SensorWeb Architecture (OSWA) [18]. Finally, at the end of this section a small summary of other solutions will be discussed; these solutions are only described shortly by summarizing available literature.
2.2.1 Global Sensor Networks (GSN)
2.2.1.1 About GSN
Query Processor Notification Manager
Query Repository
Manager Life Cycle
Storage Integrity service
GSN/Web/Web−Services Interfaces
Pool of Virtual Sensors Stream Quality Manager
Query Manager
Virtual Sensor Manager
[image:23.595.193.345.127.351.2]Input Stream Manager Access control
Figure 1: A GSN container [1]
distributed querying, filtering, and combination of sensor data, and supports the dynamic adaption of the system configuration during operation’ [1]. GSN was started in November 2004 by Ali Salehi under supervision of Prof. Karl Aberer at LSIR Laboratory, Ecole Polytechnique F´ed´erale de Lausanne, Switzerland [19].
An instance of GSN is called a GSN container, of which an example can be seen in figure1. The most important concept within a GSN container is thevirtual sensor(VS). A VS publishes output from actual sensors or output generated by other virtual sensors, even if those are running in a different GSN container.
2.2.1.2 GSN Functionality
Table1assesses to which extent the functionalities described in section2.1are available in GSN.
Distribution A GSN container (a running GSN instance, see figure1) consists ofvirtual sensors. A virtual sensor can read and combine data from custom built sensor wrappers (java classes), but it can also read from other virtual sensors using XML-RPC. All data sources (so, wrappers or virtual sensors) have an output specification to accomplish this. Since XML-RPC is used, virtual sensors from one GSN container can communicate with virtual sensors run-ning in other GSN containers.
Sensordata metadata recording
GSN does not support annotation of sensordata, but static prop-erties can be specified in the sensor specification.
Sensor access Data from sensors is periodically collected by usingwrappers. A wrapper needs to be able to connect to a sensor, read out the sen-sor data and encapsulate the retrieved data in aStreamElement object, which is a general object that GSN uses for communi-cation internally. One stream element is basically one row in a relational database.
Sensor discovery Virtual sensor XML definitions are stored in a designated direc-tory, which is monitored for changes. Sensors can be added or removed by adding or removing definitions from this directory.
Processing chains A virtual sensor can be used for data acquisition as well as data processing. Processing chains can therefore be created by cou-pling virtual sensors together.
Querying GSN supports realtime querying and offline data retrieval. The system is built to directly process new stream elements, so batch querying can only be achieved by performing some caching in a custom virtual sensor.
Presentation An XML-RPC servlet has been created to communicate with a GSN container. An example, AJAX enabled web interface is available that frequently checks for new data or sensors, allows a user to query and export offline data and point the location of all found sensors on Google Maps.
Service discovery By adding a specific attribute to a virtual sensor definition, it can be announced to SensorMap.
Access control Another optional attribute of a virtual sensor definition is a pass-word. This enables simple authentication.
Communication proto-col
Whenever data is being sent over the internet, XML-RPC is used for communication. This is the case for communication between virtual sensors and communication with the web interface.
Optimization / Self or-ganization
Queries over data are not optimized and results are not cached; this is left to the database handling the queries.
Standards GSN does not use the approved OGC SWE standards like O&M or SensorML. Instead, it uses XML-RPC, in which sensor data is encoded to a self-chosen markup. There have also been efforts in creating a REST interface.
Data digestion New data is directly stored in the database. The size (amount of records) in the database can be managed. Directly aggregating the data before it is inserted into a database is however not sup-ported and should be done by creating a custom StreamExporter virtual sensor.
Alerters / Notifiers A Notification Manager is included, which can notify users via e-mail or SMS.
Actuators There is no support for actuators, but the Notification manager can easily be extended to support this functionality.
Handling of changing variables
Changes in sensor configurations are not recorded; it is expected that the configuration never changes.
Shared execution The provided servlet is able to handle multiple requests at the same time.
Count / time based windows
If a time window is defined in the virtual sensor definition, GSN instantiates ‘time based sliding handlers’. Count based windows are also supported, these are handled by ‘tuple based sliding handlers’.
Window specification Users can request realtime or historical data and therefore it sup-ports fixed, sliding and landmark windows.
Update interval Windows have a ‘sliding value’ (default 1), meaning that the win-dow will update after receiving that number of new elements. For example, when the sliding value is three, the window will be up-dated after three new tuples have been recorded.
Storage The database that is specified in the main configuration is used for temporary storage and historical data. By default, GSN only supports MySQL, MSSQL and H2 through JDBC. However, if a StreamExporter virtual sensor is used, aggregations on the sensor data can be directly exported to any JDBC compatible database. Static information about the sensor itself is stored within the vir-tual sensor definition.
Figure 2: 52◦North SOS architecture [2]
2.2.2 52◦North
2.2.2.1 About 52◦North
52◦North [2] is an international research and development company whose mission is to promote the conception, development and application of free open source geo-software for research, education, training and practical use. The 52◦North Sensor Web Community focuses on the development of a broad range of services and encoding implementations related to OGC’s Sensor Web Enablement, as well as multi functional clients to access all of these services.
Five different services are offered by 52◦North, namely the Sensor Observation Ser-vice (SOS), Sensor Alerts SerSer-vice (SAS), Sensor Planning SerSer-vice (SPS), Web Notification Framework (WNS) and the OX Framework (OXF). The most important service is the SOS, which provides observations for the other services. Figure2shows the architecture of the SOS. The SOS is very modular to allow developers to adapt the system to their own needs: the data access layer can be extended by a new DAO implementation which connects to an already existing sensor database, new SOS operations can be added by adding new re-quest listeners and communication with clients can be altered by changing/replacing the SOS servlet.
2.2.2.2 52◦North Functionality
Table2assesses to which extent the functionalities described in section2.1are available in 52◦North.
Distribution Every part of the 52◦North implementation of OGC SWE stan-dards is a separate webservice. These webservices can commu-nicate with each other, enabling distribution.
Sensordata metadata recording
The OGC SWE standards do not mention sensordata meta-data. 52◦North’s implementation does therefore not record sen-sor metadata. There has been made a prototype though, which adds RDF data to O&M encoded sensor data (The Semantic Sen-sor Web, see [9]).
Sensor access The SOS itself does not access sensors. Data should be acquired by using a different service. 52◦North provides the SOSFeeder service for this, which inserts data directly into the SOS database. Data acquisition services that cannot access the database can also add observations using the InsertObservation operation of the SOS.
Sensor discovery Descriptions of sensors are initially read from a local directory of the SOS. When an SOS is running, new sensors can be registered using the RegisterSensor operation, a feature that is part of the OGC SOS Transactional Profile (see [21]).
Processing chains The OGC SWE services are not processing services. The SOS only provides filtering sensor data; it does not provide aggrega-tions or other processing. Processing should be done by custom made services that communicate with the SOS.
Querying As the SOS does not directly access sensors, there needs to be an intermediary database. This provides ‘near real-time’ obser-vation of sensor data [8]. Realtime querying is not supported though, this is defined in the OGC TransducerML (TML) stan-dard which is not (yet) implemented by 52◦North.
Presentation 52◦North provides the OX Framework, which is a framework that can communicate with the SOS. A thin (web) and a thick (Java Swing) client have been created to demonstrate the functionality of the framework.
Service discovery Running instances are not automatically published. Within the OX Framework, new services need to be added manually.
Access control The SOS service itself does not provide access control. Securing the service should be done by running it within a closed network. Of course, access to the web client can be restricted by basic HTTP authentication.
Communication proto-col
Optimization / Self or-ganization
The SOS provides functionality for requesting descriptions and capabilities of sensors. To efficiently respond to that kind of queries, the sensor information described in SensorML is cached. Observation query results are however just passed to the database.
Fault tolerance Errors during communication do not cause the services to quit; they are properly caught and logged. Most communication will happen between the SOS and the database, so this strategy is usually fine as such a connection is quite stable. The SOS Feeder framework is a difference case however, but no action is taken there either when communication with the sensor fails.
Standards 52◦North tries to implement the standards defined by the OGC. So far, they support the SOS Core and Transactional Profile, SAS, SPS, WNS, SensorML and Observations and Measure-ments (O&M) standards.
Data digestion All sensor data should first be stored in the SOS database. Fur-ther processing must be done by creating services that request the sensor data from the SOS.
Alerters / Notifiers There have been built a couple of services to alert or notify users, namely the Sensor Alert Service and the Web Notification Sys-tem. The WNS is able to send notifications asynchronously to several devices. It can use e-mail and SMS and can communi-cate with phones and faxes. The SAS can be used for online notifications. Users should join a MultiUserChat (MUC) and the SAS will send alerts to all registered users.
Actuators A client that is registered to the SAS does not necessarily have to be a user. An actuator service that can join a MUC can be created, which can then quickly act upon receiving certain alerts.
Handling of changing variables
The OGC SOS specification describes a dimension of sensor data called itsfeature of interest (FOI). The FOI provides informa-tion about the environment of the sensor, for example a geometry specifying the field that the sensor is sensing. Changing system variables should be handled by adding/updating FOIs.
Shared execution Multiple clients can use the 52◦North services at the same time.
Count / time based windows
Window specification When requesting for data, an event time (period) can be specified for which it should return results.
Update interval Update intervals don’t apply in this case, since sliding windows are not supported.
Storage The system requires a PostgreSQL database with PostGIS exten-sion. It uses this for storing FOIs. Static sensor information is stored in SensorML files located in a designated directory of the SOS.
Table 2: 52◦North functionality
2.2.3 Open SensorWeb Architecture (OSWA)
2.2.3.1 About OSWA
[image:29.595.171.366.465.697.2]The OSWA [18] is an initiative of the Grid Computing and Distributed Systems (GRIDS) Laboratory of the University of Melbourne. OSWA consists of several implementations of the OGC SWE standards, like 52◦North. OSWA is not as far as 52◦North, since only the SOS Core Profile, SPS and WNS are implemented. Figure3shows the global architecture. The SOS has been named the Sensor Collection Service (SCS), which is the old name the OGC had given to the service. The main differences between the OSWA and 52◦North is that the OSWA services are pure SOAP web services and the SCS is able to provide realtime observations, since the SCS is also responsible for data acquisition.
2.2.3.2 OSWA Functionality
Table3assesses to which extent the functionalities described in section2.1are available in OSWA.
Distribution Just like 52◦North’s software, every part of the OSWA imple-mentation of OGC SWE standards is a separate webservice. The main difference between the two is that the OSWA services are pure SOAP services.
Sensor specification A separate database is used for storing SensorML information of sensors. It needs to be filled in manually. This seems a little cumbersome, but the system can create appropriate SensorML XML from this data, so it is probably work in progress.
Sensordata metadata recording
There is no option to record sensordata metadata, but the proto-type described in [9] can also be applied in this system.
Sensor access The SCS uses Proxy instances to retrieve data from several sources. In turn, every sensor Proxy uses Connectors, which are used for communication with the sensor.
Sensor discovery Sensors and services need to be configured in properties files. Registering or unregistering sensors is not possible.
Processing chains Processing services are not provided. Sensor data must be pro-cessed by custom services communicating with the SCS.
Querying OSWA provides realtime and offline querying, depending on the proxy used. It is possible to do batch querying, because the sys-tem supports the O&M complex typeObservationCollection.
Presentation The system exposes its functionality using Axis WS. A frontend is not provided, but by using the WSDL generated by Axis, an application can easily be built on top of it.
Service discovery Since OSWA uses Axis webservices, the services can be regis-tered to a UDDI service.
Access control Axis provides access control for web services, so this can be used to secure the exposed services.
Communication proto-col
The system sends SOAP messages in which OGC SWE stan-dards, SensorML and O&M, are encoded. Requests should also be made using SOAP encoded messages.
Optimization / Self or-ganization
Fault tolerance There is not a lot of error correction; when something fails it is only reported in the error log.
Standards The SOS Core Profile, SPS, WNS, SensorML and Observations and Measurements (O&M) standards are supported by OSWA.
Data digestion In contrast to 52◦North, the SCS does not rely on a database. To save sensor data, a Sensor Repository Service (SRS) has been created. The SRS does not aggregate data, but just saves the data as is. To get observations from the SRS, a special Proxy has been created in the SCS which can communicate with the SRS database.
Alerters / Notifiers The system contains a WNS to send notifications (e-mail, SMS) to registered users.
Actuators Actuators are not yet supported, but support for actuators is one of the objectives of the project.
Handling of changing variables
The system does not expect variables to be dynamic, therefore these changes cannot be recorded.
Shared execution Requests are handled by Axis, which ensures multiple users can use the service at the same time.
Count / time based windows
OSWA enables the user to specify time based windows.
Window specification The SCS can return observations for a certain period, thus en-abling fixed and landmark windows. It is however not possible to define sliding windows, since a window cannot move.
Update interval When an observation period has been specified, the window is updated after every observation. It should be noted that an obser-vation can possibly be an obserobser-vation collection.
Storage The SCS uses the WebService Resource Framework (WSRF) to temporarily store window data. For historical data, which is recorded by the SRS, any JDBC enabled database can be used. Sensor information is stored in a database as well.
Table 3: OSWA functionality
2.2.4 Other solutions
2.2.4.1 System S
operations. PE’s can be created by programming, by using a declarative language (SPADE) or by using a graphical tool called INQ [22]. The query processing approach that will be described in chapter4has many resemblances with the processing approach used in System S, but the difference is that System S can consist of multiple clusters. Like GSN, System S applications can communicate with other running System S applications. The system fulfills many of the defined requirements, but a big drawback is that the communication protocol is unknown. As it is a proprietary system, this protocol is probably proprietary as well, in which case it is unlikely that the system can cross organizational boundaries as easy as web services can.
2.2.4.2 SONGS
Service Oriented Network proGramming of Sensors (SONGS) is an implementation of se-mantic service frameworks for sensor infrastructures [23,24,6]. Semantic services contain inference units, which enable semantic queries. The idea of an inference unit is that it ‘wraps’ one or more sensors into a meaningful object. By specifying the region that is cov-ered by these sensors, the inference unit to which a sensor belongs can be inferred. More-over, when defining an inference unit, the input sensors and the output can be semantically annotated as well. As an example, consider an inference unit calledVehicleDetectionUnit. In SONGS, this can be specified as follows [24]:
inference(VehicleDetectionUnit, needs( sensor(magnetometer, R) ), creates( stream(X),
isa(X, vehicle), property(X,T,time), property(X,R,region) ) ).
In this snippet,Ris a given region. The VehicleDetection unit consists of one sensor that covers the regionR, which is semantically annotated as being a ‘magnetometer’. The output is an event stream with the time and location in which vehicles are detected. The advantage if this approach is that a user can specify queries that are semantically meaningful. Consider for example the following query, which tells the system to only return car events in a certain region [24]:
stream (X), isa (X, car), property (X, [[10,0,0],[30,20,20]], region).
While the publications don’t give much details about the implementation of the system, the approach for enabling semantic query definitions is very interesting. It is one of the first systems to recognize the importance of understanding the meaning of the data that has been processed.
2.2.4.3 IrisNet
stop, but it can theoretically even be used by organizations for perimeter defense (security). The network consists of Sensing Agents (SA’s) and Organizing Agents (OA’s), of which the first are the services for acquiring data from sensors and the latter are for persisting the collected data in a database. The SA’s contain blocks of code calledsenselets, which send the collected data to nearby OA’s that are authorized to record the data. Querying can be done by defining XPath queries, as the data is saved as XML data. [25,6]
To demonstrate the architecture described, a couple of prototypes have been built that were able to monitor parking lots and collect images of a coastal line. The prototypes showed that the architecture works, but that it was mainly meant to focus on the technical challenges. A lot of issues still needed to be addressed (mostly policy and privacy issues) [25], but not much progress has gone into the project ever since.
2.3 Middleware Functionality Summary Table
Table 4 summarizes the three projects assessed in section2.2. Clearly, GSN is the most complete software package of the three. However, this does not mean that it is always the best choice; often this will depend on the current situation and the user requirements. A reason to choose for 52◦North is its good compliance to the OGC SWE standards, which becomes very important if the network needs to be linked to other networks or third party tools. And why would you choose to support realtime data analysis if it is not required by the users of the system? Finally, there is often already a system in place. When this is the case, replacing it with a completely different system can be very time consuming and therefore costly.
General Functionality
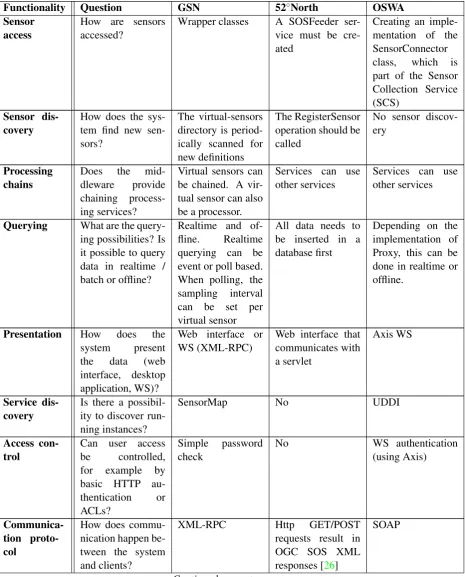
Functionality Question GSN 52◦North OSWA
Distribution Can services be distributed?
Yes: GSN contain-ers
Each main func-tionality (inserting data, reading data, notifications) is a service on its own
Each main func-tionality (inserting data, reading data, notifications) is a service on its own
Sensor specifica-tion
How are sensors defined?
Virtualsensor defi-nition. A unique name, data sources and the sensor’s po-sition can be speci-fied
A sensor can be completely mod-elled in XML using OGC’s SensorML standard
A database must be filled with Sen-sorML information
Sensordata metadata recording
Can metadata over the sensor data be recorded?
Only static meta-data
Only static meta-data
Only static meta-data
Table 4 – Continued
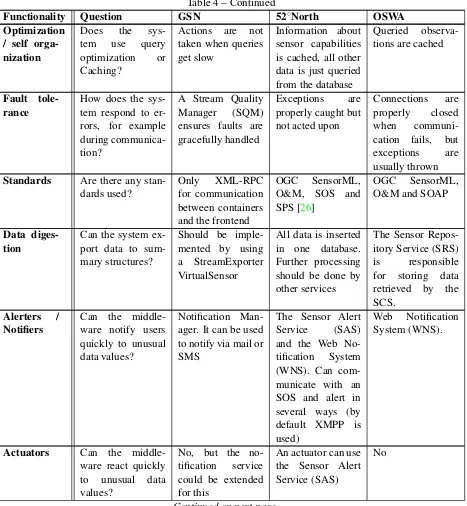
Functionality Question GSN 52◦North OSWA
Sensor access
How are sensors accessed?
Wrapper classes A SOSFeeder ser-vice must be cre-ated
Creating an imple-mentation of the SensorConnector class, which is part of the Sensor Collection Service (SCS)
Sensor dis-covery
How does the sys-tem find new sen-sors?
The virtual-sensors directory is period-ically scanned for new definitions
The RegisterSensor operation should be called
No sensor discov-ery
Processing chains
Does the mid-dleware provide chaining process-ing services?
Virtual sensors can be chained. A vir-tual sensor can also be a processor.
Services can use other services
Services can use other services
Querying What are the query-ing possibilities? Is it possible to query data in realtime / batch or offline?
Realtime and of-fline. Realtime querying can be event or poll based. When polling, the sampling interval can be set per virtual sensor
All data needs to be inserted in a database first
Depending on the implementation of Proxy, this can be done in realtime or offline.
Presentation How does the
system present the data (web interface, desktop application, WS)?
Web interface or WS (XML-RPC)
Web interface that communicates with a servlet
Axis WS
Service dis-covery
Is there a possibil-ity to discover run-ning instances?
SensorMap No UDDI
Access con-trol
Can user access be controlled, for example by basic HTTP au-thentication or ACLs?
Simple password check
No WS authentication
(using Axis)
Communica-tion proto-col
How does commu-nication happen be-tween the system and clients?
XML-RPC Http GET/POST
requests result in OGC SOS XML responses [26]
SOAP
Table 4 – Continued
Functionality Question GSN 52◦North OSWA
Optimization / self orga-nization
Does the sys-tem use query optimization or Caching?
Actions are not taken when queries get slow
Information about sensor capabilities is cached, all other data is just queried from the database
Queried observa-tions are cached
Fault tole-rance
How does the sys-tem respond to er-rors, for example during communica-tion?
A Stream Quality Manager (SQM) ensures faults are gracefully handled
Exceptions are properly caught but not acted upon
Connections are properly closed when communi-cation fails, but exceptions are usually thrown
Standards Are there any stan-dards used?
Only XML-RPC for communication between containers and the frontend
OGC SensorML, O&M, SOS and SPS [26]
OGC SensorML, O&M and SOAP
Data diges-tion
Can the system ex-port data to sum-mary structures?
Should be imple-mented by using a StreamExporter VirtualSensor
All data is inserted in one database. Further processing should be done by other services
The Sensor Repos-itory Service (SRS) is responsible for storing data retrieved by the SCS.
Alerters / Notifiers
Can the middle-ware notify users quickly to unusual data values?
Notification Man-ager. It can be used to notify via mail or SMS
The Sensor Alert Service (SAS) and the Web No-tification System (WNS). Can com-municate with an SOS and alert in several ways (by default XMPP is used)
Web Notification System (WNS).
Actuators Can the
middle-ware react quickly to unusual data values?
No, but the no-tification service could be extended for this
An actuator can use the Sensor Alert Service (SAS)
No
Table 4 – Continued
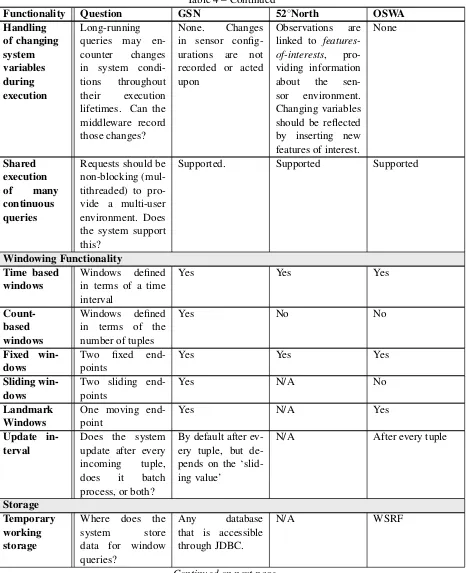
Functionality Question GSN 52◦North OSWA
Handling of changing system variables during execution Long-running queries may en-counter changes in system condi-tions throughout their execution lifetimes. Can the middleware record those changes?
None. Changes in sensor config-urations are not recorded or acted upon
Observations are linked to features-of-interests, pro-viding information about the sen-sor environment. Changing variables should be reflected by inserting new features of interest.
None Shared execution of many continuous queries
Requests should be non-blocking (mul-tithreaded) to pro-vide a multi-user environment. Does the system support this?
Supported. Supported Supported
Windowing Functionality Time based
windows
Windows defined in terms of a time interval
Yes Yes Yes
Count-based windows
Windows defined in terms of the number of tuples
Yes No No
Fixed win-dows
Two fixed end-points
Yes Yes Yes
Sliding win-dows
Two sliding end-points
Yes N/A No
Landmark Windows
One moving end-point
Yes N/A Yes
Update in-terval
Does the system update after every incoming tuple, does it batch process, or both?
By default after ev-ery tuple, but de-pends on the ‘slid-ing value’
N/A After every tuple
Storage Temporary working storage
Where does the system store data for window queries?
Any database that is accessible through JDBC.
N/A WSRF
Table 4 – Continued
Functionality Question GSN 52◦North OSWA
Summary storage
Where can the sys-tem store data for stream synopses (digests)
MySQL, MSSQL or H2 through JDBC, or custom made by using the StreamExporter VirtualSensor PostgreSQL with GIS extension (for specify-ing features-of-interest)
Any database ac-cessible through JDBC
Static stor-age
How is information about the sensor it-self stored?
XML file (Virtu-alSensor defini-tions)
SensorML file SensorML data in a database
Table 4: Middleware survey summary table
2.4 Case study: Middleware
To choose the middleware to use for the case study, it is needed to understand more about the domain and the people involved (thestakeholders). They will play a big role in finding user requirements.
2.4.1 Domain
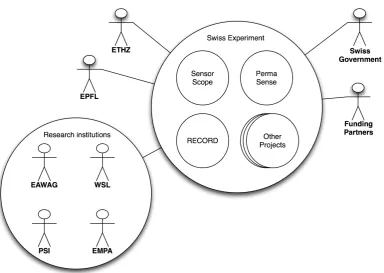
One of the projects in which the WUT department is involved is the RECORD (RE-stored CORridor Dynamics) project. The objective of the RECORD project is “to increase mechanistic understanding of coupled hydrological and ecological processes in near-river corridors.”. [27]. For this purpose, a (channelized) section of the river Thur is one of the sites where experiments are conducted. One measurement tool is the DTS, the sensor that was described in the introduction. The RECORD project itself is also part of the Swiss Experiment (SwissEx). The primary objective of the Swiss Experiment is to “enable effec-tive real-time environmental monitoring through wireless sensor networks and a modern, generic cyber-infrastructure (...) to work efficiently and collaboratively in finding the key mechanisms in the triggering of natural hazards and efficiently distribute the information to increase public awareness” [28]. This research is a contribution to accomplishing that goal, therefore it is good to understand more about this project. Figure4shows the project and the stakeholders of the Swiss Experiment. It consists of about twelve projects, but only SensorScope and PermaSense are explicitly added, since these projects already have an automatized way of collecting sensor data.
Most user requirements will come from the researchers that are actually using sensors for their experiments; the funding partners and the government are mainly interested in the research outcomes. For the RECORD project, these are researchers from ETHZ and EAWAG.
2.4.2 Current situation
Figure 4: RECORD project domain
deployed sensors, such an undertaking can take some days. Moreover, some sensors also need to be checked frequently in order for them to work correctly. And finally, this way of working also causes a lot of observation duplication, since measurements are done over and over again for every project. SwissEx itself is already a big step in the right direction regarding this last point, since the research institutions depicted in figure 4used to work independently of each other.
The previous paragraph clearly shows the usefulness of direct availability of sensor data: • Researchers don’t have to visit every single sensor for getting sensor data, which is a
very time-consuming job
• Researchers can be notified by services that can detect when sensors need mainte-nance
• Data can be queried or searched for from a central place, thus avoiding observation duplication
It must be noted that some projects do already provide real-time monitoring, namely SensorScope and PermaSense. SensorScope is a real-time monitoring system itself. It is a Wireless Sensor Network (WSN) that supports multi-hop routingto be able to reach distant sensors [29]. PermaSense is a project that investigates permafrost and has therefore deployed several sensors at a height of 3500m. GSN is used for recording and analyzing the sensor data, which initially is collected using a WSN as well [30] [31].
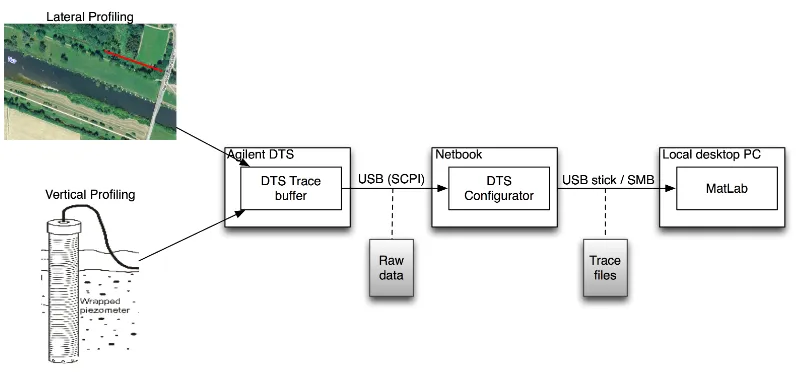
Figure 5: Current DTS data flow
a long distance) as well as vertical profiling (distributed measurement over several depth levels in the soil). An abstract representation of the current data flow is given in figure5. A small computer (Netbook) communicates with the DTS over USB. The DTS Configurator is a DTS administration application supplied by the sensor manufacturer Agilent and is used to configure the DTS and export new measurements to ‘trace files’, which have a format that resembles CSV. Every now and then, new trace files are downloaded by connecting a USB stick to the Netbook or by joining the local network to which the computer is attached. The downloaded data is taken back to the office, after which a MATLAB script is used to parse the trace files and generate plots for analysis and use in publications.
2.4.3 User requirements
Clearly, a lot of time and money can be saved by switching to a real-time processing so-lution. However, this change does yield new requirements. They were gathered by speaking with the people using the DTS and looking into the publications that have followed from their research and are listed in table5. Real-time processing is clearly a new feature, but the others mainly follow from the different way of working; in the current situation, the researcher himself would manually extract the relevant data from the set of measurement results and write down the sensor configuration for use in a publication.
2.4.4 Conclusion
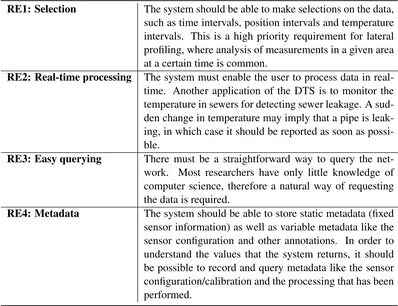
Table 5DTS retrieval user requirements
RE1: Selection The system should be able to make selections on the data, such as time intervals, position intervals and temperature intervals. This is a high priority requirement for lateral profiling, where analysis of measurements in a given area at a certain time is common.
RE2: Real-time processing The system must enable the user to process data in real-time. Another application of the DTS is to monitor the temperature in sewers for detecting sewer leakage. A sud-den change in temperature may imply that a pipe is leak-ing, in which case it should be reported as soon as possi-ble.
RE3: Easy querying There must be a straightforward way to query the net-work. Most researchers have only little knowledge of computer science, therefore a natural way of requesting the data is required.
Provenance
The provenance of a painting is a record of the derivation and passage of an item through its various owners. It is of great importance to determine the value of the painting, which is not only defined by its painter, but also by the owners of the painting, the price that has been paid by each owner and what caused the painting to be in its current state, for example by acts of renovation. In this chapter, we will see that this concept can also be used in the field of computer science to trace back data to its source.
3.1 Basic Types of Provenance
Within computer science, there are two basic types of provenance: process provenance and data provenance. Process provenance, which is also known astransformation provenance [32], describes the provenance of a data item as the processes that lead to its creation. Recording this provenance can be automatic, manual or semi-automatic and can involve user interaction. Data provenance orsource provenance[32] is information about the data that was involved in the creation of a certain piece of data. This information can contain references to the original source of the data, input data that has contributed to the result or even data that did not change the result, but were just involved in the creation of the data item.
This chapter will mostly focus on process provenance, which is the type used by the Open Provenance Model (OPM) described in section3.3. The main argument for focussing on process provenance is that recording data provenance for streaming data should in-tuitively generate a huge, unmaintainable amount of provenance data, without providing remarkable benefits over just recording the process provenance. As will be explained in section 3.4, reproducibilityof a result is a main objective when recording provenance for scientific research, which can be achieved best by recording process provenance.
3.2 The Provenance Challenge
Figure 6: Graphical representation of OPM entities
Figure 7: The provenance of baking a cake [4]
Challenge” should be set to compare and understand existing approaches. At the time of writing, two of these provenance challenges were already held and a third was in progress. The first two challenges resulted in the Open Provenance Model v1.01, which was evaluated in the third challenge [34]. The rest of this chapter will describe the OPM, how it can be used for streaming data and finally an architecture will be presented for web service based provenance recording and querying.
3.3 The Open Provenance Model (OPM)
The OPM is a technology-agnostic provenance model that is aimed at enabling systems to exchange provenance information. It has been designed to represent any kind of prove-nance, even if it has not been produced by computer systems. The model defines a causal graph that consists of Artifacts, Processes, Agents and the causal relationships between these entities [4]. Figure6shows how the different types are represented. An example of representing the provenance of baking a cake by using the OPM can be found in figure7. It consists of the following parts:
• Five Artifacts, namely the cake and the ingredients it is made of. Artifacts are repre-sented as circles.
• A Process, the ‘Bake’ process. Processes are always represented as rectangles.
[image:43.595.165.374.226.384.2]Figure 8: Overlapping account of the provenance model of baking a cake
• Six causal relationships between the before mentioned entities, represented by ar-rows.
The meaning of a causal relation depends on the entities that it connects. This is the case for every combination of two entities connected by a relation. Causal relations can also contain an optionalrole, which designates an artifact’s or agent’s function in a process. The OPM has explicitly been designed to be able to specify provenance forpastevents. It does not provide standards for recording or querying provenance, nor does it specify how provenance models should be serialized by computer systems. Version 1.01 of the OPM does not yet incorporate details about the question how provenance of streaming (sensor) data should be recorded, although there are some footnotes suggesting this will be added in future versions. These limitations make the integration of OPM provenance models into a sensor network a real challenge and the final system presented in this thesis will hopefully clarify to what extent the OPM is suitable for recording provenance of streaming sensor data.
3.4 Provenance Recording Objectives
The big question in recording provenance for sensor data is what level of detail should actually be recorded. The simplest form of provenance in this case is to only record the information that is externally observable, which is basically a list of processes that have performed some function on the data. However, we can also ‘zoom in’ on every process and record the provenance of what is actually happening inside of each process. This extra provenance refinements are calledoverlapping accountsin the OPM.
Figure8is an overlapping account of the model depicted in figure7, because they share some common nodes, namely the ingredient artifacts, the Cake artifact and the cook John. It is a refinement of the baking process.
creating an overlapping account refining that process. This refinement could be interesting if the node behaves differently under different circumstances.
Within scientific research, the most important reaosn for recording provenance is repro-ducibility [35]. Sensor data used in journals and other publications should be reproducible to justify the conclusions that have been made. Therefore, the level of detail of the prove-nance of sensor data should be as high as is needed to reproduce the result. Of course, it should be taken into account that some information will be lost to limit the amount of provenance data that is generated. Getting back to the example of a node generating hourly averages, one could require that the provenance graph should contain a direct reference to the sensor data used for generating a particular tuple. This would mean that the provenance graph of every tuple is different and would therefore result in a massive amount of prove-nance data. However, this could be limited easily if instead the choice is made to see all input of a node as being one input view and thus just one artifact. The actual data that is aggregated will be unknown, but one is probably still able to reproduce a result by using the timestamp of the generated tuple.
3.5 Provenance over Time
Usually, a workflow is not continuous, but will occur every now and then at arbitrary times. It is therefore a logical choice to record the provenance of every time that workflow yields a result. Taking the OPM example of the provenance of a cake, we observe that this workflow is finite and occurs in a clearly distinguishable time period. This is not feasible for contin-uous workflows; new results can come in every second and storing the whole provenance graph for every tuple would yield a massive amount of provenance data in short time.
An important clue in finding a solution to this problem is that, regardless of the continu-ity of a workflow, a lot of duplication is introduced when the execution of the workflow is fixed. The process of making a cake is defined by a recipe, therefore the provenance graph of one cake will often be the same as another cake. Essentially, the recipe of making a cake can be seen as a stateless workflow: it does not change over time. This is the reason for the fact that it can be represented by a timeless provenance model.
3.5.1 Workflow State
As explained in the previous section, the provenance of a workflow is related to thestate of the workflow. A workflow state is defined as follows.
Definition 1 (Workflow State) A workflow state is a collection of artifacts, processes and agents with causal relations that hold for a given time interval. A workflow changes state when any of the entities or relations in the workflow change state.
Definition 2 (Stateless Workflow) A stateless workflow is a workflow that never changes state over time. It can also be seen as a fixed state workflow: a workflow that only has one state and never transitions. Its time interval is unbounded. Conclusively, the entities and causal relations in a stateless workflow never change either.
Figure 9: Example provenance graph using timed annotations
to the provenance of baking a cake. If we assume that the recipe of baking a cake is fixed, we could say that the workflow is stateless. However, the model depicted in figure7also incorporates the cook John as being the Agent of the baking process. Can it be assumed that John will always be the cook? Could it also be Alice? If that is the case, we can clearly see that the workflow is not stateless after all. However, if we decide to lose some detail, for example by calling the Agent ‘Employee’ or by removing the whole Agent, the provenance model can become stateless again.
The problem that remains is that there is no standard way yet for relating provenance to a particular state of a workflow. How can the state of a workflow be identified? And how do we know that a particular result was generated while the workflow was in a certain state? The two following subsections will discuss two possible solutions to solve this problem.
3.5.2 Partial Provenance Graph Updates Using Timed Annotations
If the state of a workflow changes, a new provenance graph could be created. However, if it is known which process in the workflow has changed, it is also possible to update the old graph using timed annotations on the causal links coming in and going out of that process. This is based on the fact that a workflow state transition occurrence means that one or more of its entities or causal relations has transitioned, as described by definition
1. Optionally, the provenance of the process itself can then be specified by creating an overlapping account.
Figure9 is a small example explaining this concept. The original provenance graph, time annotated withT0, shows that a process used theInputartifact directly to produce the Out put. On timeT1 however, it uses theOut putthat was generated by a newly introduced other process, which pre-processes theInput.
This solution is suitable when just a few processes within the workflow change over time; creating a whole new provenance graph to record the change of one process is un-necessary. However, when the whole workflow undergoes big changes, only using timed annotations would result in one huge provenance graph containing a mish mash of timed relations.
3.5.3 Workflow State Checkpoints
![Figure 1: A GSN container [1]](https://thumb-us.123doks.com/thumbv2/123dok_us/1209077.644499/23.595.193.345.127.351/figure-a-gsn-container.webp)
![Figure 2: 52◦North SOS architecture [2]](https://thumb-us.123doks.com/thumbv2/123dok_us/1209077.644499/26.595.170.367.129.268/figure-north-sos-architecture.webp)
![Figure 3: OSWA SCS architecture [3]](https://thumb-us.123doks.com/thumbv2/123dok_us/1209077.644499/29.595.171.366.465.697/figure-oswa-scs-architecture.webp)
![Figure 7: The provenance of baking a cake [4]](https://thumb-us.123doks.com/thumbv2/123dok_us/1209077.644499/43.595.192.346.126.174/figure-provenance-baking-cake.webp)
