ISSN (e): 2250-3021, ISSN (p): 2278-8719
Vol. 08, Issue 5 (May. 2018), ||VIII|| PP 22-28
Non-Linear Analysis Of Thin RC Walls With Openings Subjected
Axial Load With An Eccentricity
Dongjun Lee
1, Soontaek Oh
2*1(Civil engineering, Seoul National University of Science and Technology, Korea, [email protected]) 2(Civil engineering, Seoul National University of Science and Technology, Korea, [email protected])
Corresponding Auithor: Dongjun Lee1
Abstract: -
Thin reinforced concrete wall behavior subjected axially loading with an eccentricity can be accurately predicted using non-leaner analysis application program FEA modeling based on the experimental test. A numerical study was undertaken to verify the effectiveness of the Finite Element Analysis (FEA) in predicting the failure characteristics of thin reinforced concrete walls with openings. The existing experimental RC wall test results which were compression strength 47.0 and 99.3 MPa, height to thickness ratio 40, sectional area 25% opening at the center, and restrained top and bottom sides only were adopted to model numerically. The numerical model was constructed by the nonlinear analysis application program FEA produced by MIDAS-IT. The three-dimensional solid analysis considering concrete and reinforcement properties simultaneously using solid brick element defined the total strain crack model with elastic modulus in compression and brittle in tension is applicable. The ultimate loads, load-deflection responses up to failure, lateral displacements and crack propagations predicted by the FEA were compared at 7 concrete compressive strengths by 24, 35, 47, 60, 70, 80, 90 MPa taken account with linear and non-linear analysis.The comparative study also confirmed that the FEA is a reliable and effective numerical modeling technique for determining ultimate load capacity of high strength concrete walls with high height to thickness ratio and opening. Especially the maximum lateral displacements of wall around opening are investigated at the linear and non-linear mode and compared the test observations.
Keywords
: - Axial loaded with an eccentricity, Crack propagation, Finite element analysis, Lateral displacement, Thin reinforced concrete walls.--- --- Date of Submission: 05-05-2018 Date of acceptance: 21-05-2018 --- ---
I.
INTRODUCTION
There are two useful simplified design equations for axially loaded wall panels given in the Australian Standard AS3600 [1] which was originated from British Standard BS3600 [2] and American Concrete Institute Code ACI-318 (2014) which led to Korean Concrete Standard KCI. The Codes are restraints to walls with height to thickness ratio of less than 25, and are not intended to be acceptable the concrete strength should be less than 65 MPa. The code derived from limited researches [5][6][7]. From the recent research [8][9][10][11] [12][13][14], the thin concrete wall with more than the height to thickness ratio 25 is verified that has structural performance. However, the use of thin concrete walls for tall building with high strength concrete is increasing resulted in needing to provide the reasonable code. It is evident that more investigations are required of the thin walls with higher concrete strength over 65 MPa and height to thickness ratio over 25. It is well known that the concrete characteristic is stronger enough for the compressive strength rather than the tensile strength. There is a need to study how much are influenced about the thin reinforced concrete walls axially loaded with an eccentricity depending on the compressive strength. An experimental test focused on this was carried out by Lee [15]. The thin concrete wall behaviors subjected axially loading with an eccentricity can be accurately predicted to be modeled by the finite element method according to the experimental test procedure.
II.
METHODOLGY
the FEA were compared with 10 types of concrete compressive strength by 24, 35, 47, 60, 70, 80, 90, 100, 120, 150 MPa between linear and non-linear analysis. The comparison of maximum lateral displacement and crack propagation between by FEA and experimental result shows the effectiveness of the use of the non-linear mode in numerical analysis of the thin concrete walls[16][17].
2.1 EXPERIMENTSPECIMEN
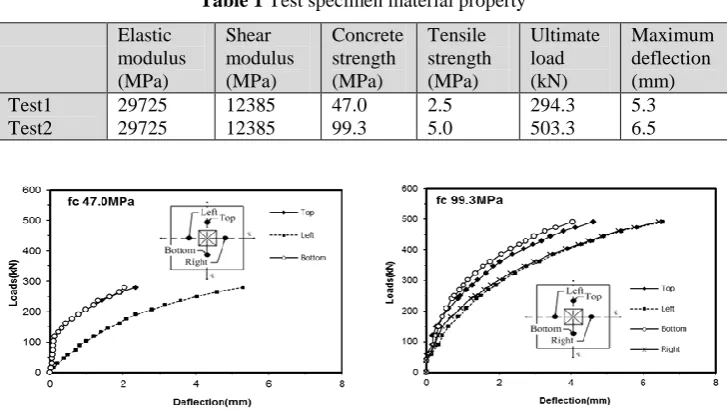
A wall panel with openings was tested by Lee (2008), which is detailed in Fig. 1. The wall panel produced was square type. The lengths and heights of the panels was 1600mm with a thickness of 40 mm. The wall was restrained top and bottom edges; height to thickness ratio was 40, and had one opening located at the center. The opening sectional area ratio was 25% and the opening configuration was based on practical dimensions in common building window situations. The tested wall panel was subjected a uniformly distributed axial load with an eccentricity of thickness over 6 resulting the whole section loaded in compression. The F41 mesh (yield strength of 450 MPa and the minimum tensile strength of 500 MPa) was embedded. The reinforcement ratio was 0.0031 satisfying the minimum requirement in Australian Standard and ACI code. The test specimen material property and load-displacement test result show in Table 1 and Fig. 2 respectively.
16
00
1600
600 400 600
60 0 40 0 60 0 CL L C
Figure 1 Test specimen detail (units: mm)
Table 1 Test specimen material property
2.2 NUMERICALMODELING
A Finite Element Analysis (FEA) is applied to investigate structural behavior of concrete wall with opening. The concrete wall with opening tested by Lee is modeled numerically. Using the MIDAS FEA Version 3.4.0, a numerical model modeled to a wall of 1600ⅹ1600ⅹ40 mm with one opening of 400ⅹ400 mm and
typical lateral deflection contour at failure show in Fig. 3 respectively. The elastic modulus of 29725 MPa, the Poisson’s ratio of 0.2 and compressive strength of 47.0 MPa and 99.3 MPa were identical with material properties of tested walls are adopted. The restraint condition is hinged supporting on the top and bottom edges. The lumped (non-consistent) load approach is used to convert a set of nodal loads on the top edge to simulate a uniformly distributed load at an eccentricity within the sectional core. It usually employs a lumping method in dividing the amount of element load. The total element load is simply divided up and applied as a series of point loads to the nodes that the element is connected.
Figure 2 Numerical model and analyzed displacement
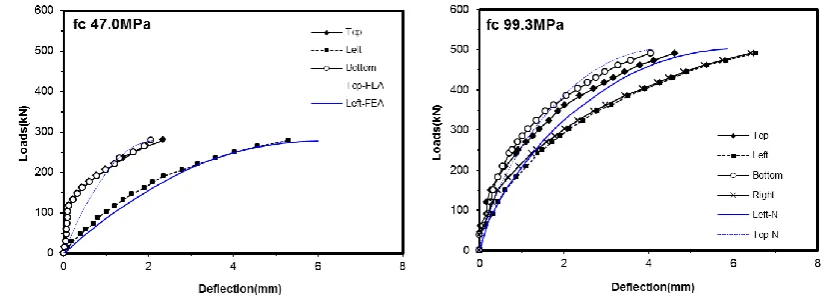
load-deflection responses analyzed by FEA are presented in Fig. 4. The effectiveness of the FEA is demonstrated through a comparison with the test results and observations in terms of the deformed shapes and the load-deflection response as well as the ultimate loads. The successful agreements of the comparisons are satisfied to endure the applicable numerical model of the concrete slender walls. Although more discrepancies exist between the test and FEA due to the limitations of experimental testing, the comparisons further confirm that the numerical model is the appropriate in terms of accuracy. Based on the convergence study, the numerical model is used to conduct comparative studies in the following section.
Figure 3Load-deflection response by test and linear FEA results
III.
RESULTS
In this chapter, the comparative study confirmed that the FEA is a reliable and effective numerical modeling technique for determining ultimate load capacity of between normal and high strength concrete walls with high height to thickness ratio and opening. Especially the maximum lateral displacements of wall around opening are investigated at the linear and non-linear mode and compared with the test observations.
3.1 LINEAR MODE ANALYSIS
indicated in Table 2 as well as the ultimate loads at failure. The maximum lateral deflection occurs at the mid-height of wall panels as a single curvature-deform shape led to the horizontal cracks at the center of walls. Although the maximum lateral displacements occur at the center of opening, the data is recorded at the 1000mm of height to figure out the deflected shape of wall panel horizontally.
Table 2 Linear analysis results; lateral deflection (mm) Compressive
Strength, f’c (MPa)
24 35 47 60 70 80 90 100 120 150 Ultimate Loads,
P (kN) 150 250 300 350 400 450 500 550 650 800
Location (mm)
L1 (0) 3.391 4.815 5.318 5.516 5.938 6.347 6.719 7.084 7.834 9.214
L2(200) 3.317 4.71 5.169 5.396 5.809 6.193 6.573 6.938 7.688 9.068
L3 (400) 3.308 4.696 5.139 5.381 5.792 6.168 6.554 6.919 7.669 9.049
L4 (600) 3.352 4.759 5.208 5.452 5.869 6.25 6.641 7.006 7.756 9.136
L5 (800) 3.395 4.820 5.278 5.522 5.945 6.332 6.726 7.091 7.841 9.221
L6 (1000) 3.352 4.759 5.207 5.452 5.869 6.25 6.641 7.006 7.756 9.136
L7 (1200) 3.308 4.696 5.139 5.381 5.792 6.168 6.554 6.919 7.669 9.049
L8 (1400) 3.317 4.710 5.169 5.396 5.809 6.193 6.573 6.938 7.688 9.068
L9 (1600) 3.391 4.815 5.318 5.516 5.938 6.347 6.719 7.084 7.834 9.214
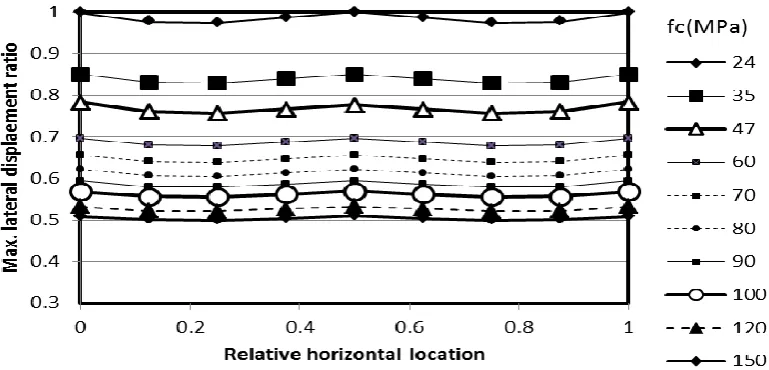
The displacements between two test results and FEA are reasonably identical. Analyzed wall edge over center deformed ratio L1 /L5 and mid over center deformed ratio L2 /L5 are calculated of the average are 100.01% and 97.89% respectively. It means that at the edge of wall L1, L9 and center L5 a crack occurs to start and propagates heading toward mid points L3 and L7. To figure out horizontal deformed shape in terms of varying concrete strength, the maximum lateral displacement ratio (displacement over ultimate load based on the displacement ratio at the center of wall with concrete strength 24 MPa) is presented in Fig. 5. It is obviously different with test observations.
Figure 4 Lateral displacement ratio at the wall center analyzed by linear mode
3.2 Non-Linear mode analysis
Table 3 Linear analysis results; lateral deflection (mm) Compressive
Strength, f’c (MPa)
24 35 47 60 70 80 90 100 120 150 Ultimate Loads,
P (kN) 104.9 153.1 218.6 281 330.3 375.1 414.1 444.5 490.7 531.5
Location (mm)
L1 (0) 2.129 2.647 3.314 3.72 4.081 4.465 4.754 5.054 5.284 5.484
L2(200) 2.255 2.804 3.510 3.94 4.323 4.727 5.035 5.335 5.565 5.765
L3 (400) 2.397 2.98 3.730 4.188 4.594 5.022 5.352 5.652 5.882 6.082
L4 (600) 2.57 3.195 4.000 4.491 4.926 5.384 5.739 6.039 6.269 6.469
L5 (800) 2.712 3.372 4.221 4.739 5.199 5.684 6.056 6.356 6.586 6.786
L6 (1000) 2.57 3.195 4.000 4.491 4.926 5.384 5.739 6.039 6.269 6.469
L7 (1200) 2.397 2.98 3.731 4.188 4.594 5.022 5.352 5.652 5.882 6.082
L8 (1400) 2.255 2.804 3.510 3.941 4.323 4.727 5.036 5.336 5.566 5.766
L9 (1600) 2.129 2.647 3.314 3.72 4.081 4.465 4.754 5.054 5.284 5.484
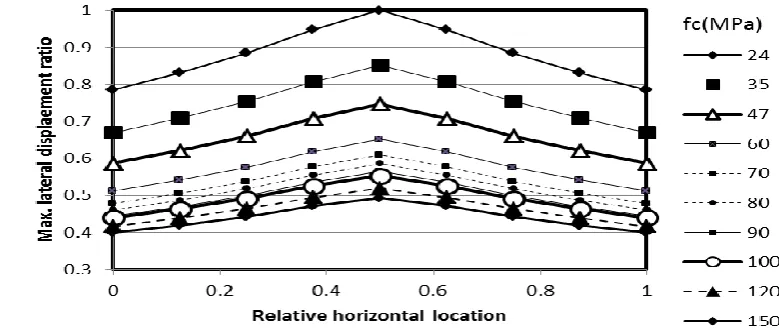
The deformed shapes between two test results and FEA at the non-linear mode are identical. Analyzed wall edge over center deformed ratio L1 /L5 and mid over center deformed ratio L2 /L5 are calculated of the average are 79.16% and 83.66% respectively. It means that a crack occurs to start at the center of wall panel and propagates significantly heading to the edges both side horizontally. It is obviously identical with test observations. The displacement ratios of concrete strength are presented in Fig. 6. The slope of the displacement ratio shows steep about 20~10% and decreases depending on the concrete strength increase as well as steeper around the opening.
Figure 5Lateral displacement ratio at the wall center analyzed by non-linear mode
3.3 Comparison between linear and non-linear mode analysis
Figure 6 Maximum displacements of the wall with respect to concrete strength
The ultimate load analyzed in linear and non-linear mode between normal concrete strength and high strength is illustrated in Fig. 8. The ultimate loads analyzed in non-linear mode are reasonable and safe even though the ultimate load analyzed in linear mode are closer to test results but a little bit overestimate.
Figure 7 Ultimate load of the wall with respect to concrete strength
3.4 Comparison between experimental results and non-linear mode analysis
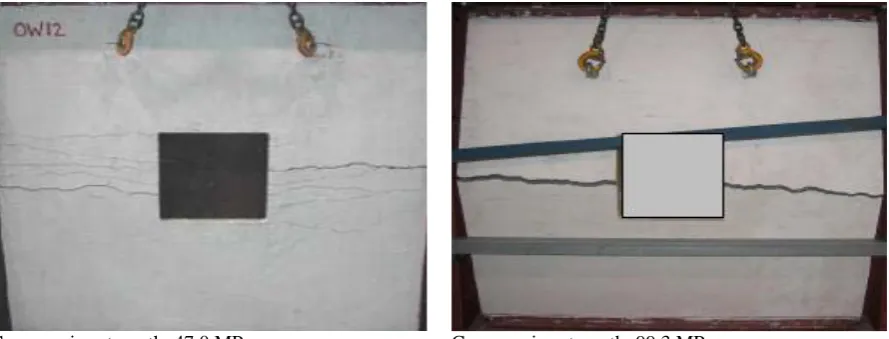
In the experimental results at failure indicated in Fig. 10 shows that the cracks start at the mid height of opening and reach to the both end edges. The clear single crack at high concrete strength wall panel indicates to occur the crushing crack in compression side otherwise the several fine cracks in normal strength wall panel represents the bending crack in tension side.
Compressive strength: 47.0 MPa Compressive strength: 99.3 MPa
Figure 8 Experimental results tested by Lee
294.3kN
International organization of Scientific
Research 28 | P a g e
The displacement ratios graphs between Fig. 6 and 7 shows
1) the deformed shape slope in non-linear analysis is clear to occur crack,
2) the slope decreases smoothly from around 60 MPa; means changing fracture mode from the bending crack to the crushing crack,
3) the slope around mid-height of opening is steeper indicates the cracks start the point otherwise the slope analyzed in linear mode indicates not match with test observation. Therefore, in this study it proposes to use non-linear mode in numerical model of concrete necessary
IV.
CONCLUSION
The structural behaviors of thin reinforced concrete walls axially loaded with an eccentricity, such as ultimate loads, load-deflection response and crack propagation, are non-linear analyzed by the FEA package program. The analyzed result in non-linear mode is identical with existing test observations indicated the model and procedure are appropriated.
ACKNOWLEDGEMENTS
This research was supported by Basic Science Research Program through the National Research Foundation of Korea (NRF) funded by Ministry of Science, ICT and Future Planning (NRF-2017R1D1A1B03034130).
REFERENCES
[1] AS(Australian Standards) (2009) AS3600:Concrete structures, Standards Australia International, Sydney, NSW, Australia.
[2] BS 3600 (1997) Concrete Structures, BSI, London, UK.
[3] ACI(American Concrete Institute) (2014) ACI318: Building Code Requirements for Reinforced Concrete, American Concrete Institute, Detroit, USA.
[4] Korean Concrete Institute (2012) Building Code Requirements for Reinforced Concrete, KCI, Seoul, KOREA.
[5] C. Popescu, G. Sas, T. Blanksvard and N. Taljsten, Concrete walls weakened by openings as compression members: A review, Engineering Structures, Elsevier, 89, 2015, 172-190.
[6] S.M. Saheb and P. Desayi, Ultimate strength of RC wall panels in one-way in-plane action, ASCE
Journal of Structural Engineering, 115(10), 1989, 2617-2630.
[7] S.M. Saheb and P. Desayi, Ultimate strength of RC wall panels with openings, ASCE Journal of Structural Engineering, 116(6), 1990, 1565-1578.
[8] S. Fragomeni, Design of normal and high strength reinforced concrete walls, PhD Thesis, University of Melbourne; Australia, 1995.
[9] F.H. Wong, Behaviour of slender high strength concrete wall panels with opening, MD Thesis, Monash University, Melbourne, Australia, 2000.
[10] J.H. Doh, Experimental and Theoretical Studies of Normal and High Strength Concrete Wall Panels. PhD Thesis, Griffith University, Gold Coast, Australia, 2002.
[11] J.H. Doh, and S. Fragomeni, Evaluation of experimental work on concrete walls in one and two-way action, Australian Journal of Structural Engineering, 6(1), 2005, 37-51.
[12] J.H. Doh, and S. Fragomeni, Ultimate load formula for reinforced concrete wall panels with openings,
Advances in Structural Engineering, 9(1), 2006, 103-115.
[13] S. Fragomeni, J.H. Doh, and D.J. Lee, Behavior of Axially Loaded Concrete Wall Panels with Openings: An Experimental Study, Advances in Structural Engineering 15(8), 2012, 1345-1358.
[14] G. Robinson, A. Palmeri, S. Austin, Design methodologies for one way spanning eccentrically loaded minimally or centrally reinforced pre-cast RC panels, Engineering Structure, Elsevier, 56, 2013, 1945-1956.
[15] D.J. Lee, Experimental and theoretical study of normal and high strength concrete wall panels with openings, PhD Thesis, Griffith University, Gold Coast, Australia, 2008.
[16] H. Guan, Cracking and punching shear failure analysis of reinforced concrete flat plates by layered finite element method, PhD Thesis, Griffith University, Gold Coast, Australia, 1996.
[17] H. Guan, C. Cooper, D.J. Lee, Ultimate strength analysis of normal and high strength concrete wall panels with varying opening configurations, Engineering Structure, Elsevier, 32, 2010, 1341-1355.