Optimal Location and Sizing of Dg in
Distribution System using Moth Swarm
Optimization (MSO)
A.Marimuthu K. Gnanambal
Associate Professor Professor
Department of Electrical & Electronics Engineering Department of Electrical & Electronics Engineering K.L.N. College of Engineering, Sivagangai, India K.L.N. College of Engineering, Sivagangai, India
R. Pavithra S. Radhika
UG Student UG Student
Department of Electrical & Electronics Engineering Department of Electrical & Electronics Engineering K.L.N. College of Engineering, Sivagangai, India K.L.N. College of Engineering, Sivagangai, India
A.Romika UG Student
Department of Electrical & Electronics Engineering K.L.N. College of Engineering, Sivagangai, India
Abstract
DG placement plays a major role due to the increase in application of distribution system. A Standalone DG can provide required power to the remote applications. Optimum locations and sizes of DG sources reduce power losses, and it also has impact on voltage profile and voltage stability of a distribution network. For optimal allocation and sizing of DGs in distribution systems MSO technique is adopted. A complete analysis is carried out on an IEEE 69 bus Radial Distribution System to prove the accuracy of proposed method. The results obtained by the proposed method are better than the other methods in terms of quality of the solution and efficiency.
Keywords: Distributed Generation, Power Losses, Voltage Profile, Voltage Stability, Moth Swarm Optimization (MSO) ________________________________________________________________________________________________________
I. INTRODUCTION
this method does not give a complete solution for optimal cost. Various optimization algorithms and the load flow programs was developed to find the power flow. The load flow analysis is used to check the injected power and power flowing out of bus.
II. PROBLEM FORMULATION
Optimal sizing and placement of DG is the main objective which specially focuses on minimizing losses, improving voltage profile and maintaining voltage stability. For the effective power system operation real power loss reduction is mandatory. The objective function for the minimization of power loss may be described as:
OF= Minimize (PLOSS) Where
PLOSS is the real power loss of the distribution network and is given by:
(1) Where
(2)
(3)
To operate the radial distribution network in a safe and secure manner voltage stability must be maintained. Voltage stability index of radial distribution system is given by:
Maximize
(4) i=2,3,4……nb
Subject to constraints Voltage Constraints:
Current Constraints:
Pi,Qi are the net active and reactive power at the ith bus Pj,Qj are the net active and reactive power at the jth bus rij is the resistance of the line connecting i and jth bus Vi,Vj are the bus voltages at the i and jth bus nb is the number of buses in the distribution network.
III. MOTH SWARM OPTIMIZATION
Moth Swarm Optimization (MSO), is inspired by the orientation of moths towards moonlight for presenting optimal location and sizing of DG on distribution systems. The fitness function of this solution is considered as luminescence intensity of the light source. The proposed moth swarm is considered to have three types of moth the are classified as follows:
Pathfinders: with the principle of First in last out the small group of moth are able to find the new areas over the optimization space. It mainly involves in guiding the main swarm by discriminating the best positions of light source.
Prospectors: These are the group of moth that wander in random spiral path which is indicated by pathfinders within the neighborhood light source area. t
Fig. 1: Movement of Moth towards moonlight
Initialization
(5)
The best moths are found and they are taken as pathfinders, the other best and worst group of moth is taken as prospectors and onlookers. Probability:
(6)
The probability value is estimated proportional to luminescence intensity. Luminescence Intensity
(7) Transverse Orientation
(8) P ∈ {1, 2…np}; I ∈ {np+1, np+2…nf}
Where, ∈ [r, 1] is the random number which defines the spiral shape; r=-1-t/T. Gaussian Walks
i ∈ {1,2,….,nG Best location of moth
Where i ∈ {1, 2...…nA}, 2g /G is the social factor,1-g/G is the cognitive factor and r1 and r2 are random number within the interval [0,1]. bestp is the light source randomly chosen from the new pathfinders group based on the probability value of its corresponding solution.
IV. RESULT
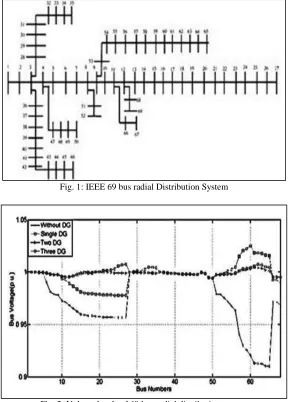
Fig. 1: IEEE 69 bus radial Distribution System
Fig. 2: Voltage levels of 69 bus radial distribution system
Fig.2. gives the voltage levels of the 69 bus radial distribution system. The optimal DG locations of three cases are considered here. The bus voltages vary according to the iterations performed.
Fig. 3: Convergence curves of the proposed algorithm for the 69 bus radial distribution system.
Table – 1
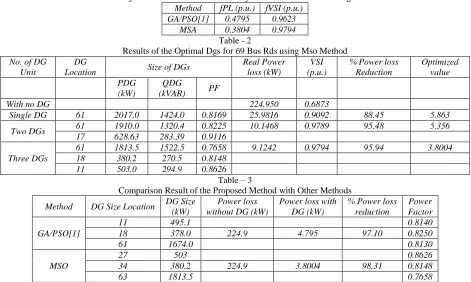
Objective Function Values of the System after Installation of Dg Method fPL (p.u.) fVSI (p.u.)
GA/PSO[1] 0.4795 0.9623
MSA 0.3804 0.9794
Table - 2
Results of the Optimal Dgs for 69 Bus Rds using Mso Method No. of DG
Unit
DG
Location Size of DGs
Real Power loss (kW)
VSI (p.u.)
% Power loss Reduction Optimized value PDG (kW) QDG
(kVAR) PF
With no DG 224.950 0.6873
Single DG 61 2017.0 1424.0 0.8169 25.9816 0.9092 88.45 5.863
Two DGs 61 1910.0 1320.4 0.8225 10.1468 0.9789 95.48 5.356
17 628.63 283.39 0.9116
Three DGs
61 1813.5 1522.5 0.7658 9.1242 0.9794 95.94 3.8004
18 380.2 270.5 0.8148
11 503.0 294.9 0.8626
Table – 3
Comparison Result of the Proposed Method with Other Methods
Method DG Size Location DG Size (kW)
Power loss without DG (kW)
Power loss with DG (kW)
% Power loss reduction
Power Factor
GA/PSO[1]
11 495.1 0.8140
18 378.0 224.9 4.795 97.10 0.8250
61 1674.0 0.8130
MSO
27 503 0.8626
34 380.2 224.9 3.8004 98.31 0.8148
63 1813.5 0.7658
Table 1 gives the objective function values of the 69 bus radial distribution system for the GA/PSO and MSO optimization techniques. Here the comparison is carried out by considering the power loss and voltage stability.
Table 2 result depicts the real power loss, reactive power loss, percentage power loss reduction and the voltage stability index by considering the cases such as (i) With no DG (ii) With Single DG (iii) With Three DG and it is found that the power loss got reduced and voltage stability is improved after the placement of the three DGs.
Table 3 shows that by using MSO algorithm, the total power loss got reduced and the power factor is improved.
V. CONCLUSION
The investigation is carried out for solving complex problem of locating and sizing DG in an electric distribution network for minimization of power losses. The MSO algorithm is employed to determine the optimal location and size of DG. MSO algorithm is able to find the improved quality solutions for the large system with the superior computational efficiency. The numerical results and the convergence profiles of the objective function of the test system confirm the effectiveness and dominancy of the proposed approach over other established algorithms. MSO algorithm exhibits a higher capability in finding optimum size and location of DG in radial distribution system.
REFERENCES
[1] M.H. Moradi and M.Abedini, “A combination of genetic algorithm and particle swarm optimization for optimal DG location and sizing in distribution
systems,” Electrical Power and Energy Systems, Vol.34 (2012), pp. 66-74
[2] Georgilakis pavlos S. and Hatziargyriou Nikos D., “A review of power distribution planning in the modern power systems era: Models,methods and future
research” Electric Power System Resource, Vol.121 (2015), pp.89-100
[3] Sneha Sultana and Provas Kumar Roy, “Krill herd algorithm for optimal location of distributed generator in radial distribution system,” Applied Soft Computing, Vol.40 (2016), pp. 391-404
[4] Krischonme Bhumkittipich and Weerachi phuangpornpitak, “Optimal placement and sizing of Distributed Generation for power loss reduction using Particle
Swarm Optimization,” Energy Procedia, Vol.34 (2013), pp. 307-317
[5] A.S.O Ogunjuyigbe , T.R Ayodele and O.A Akinoa, “Optimal allocation and sizing of PV/Wind/Battery hybrid energy system minimizing the life cycle cost,
carbon emission and dump energy of remote residential building, Applied Energy, Vol.171 (2016), pp. 153- 171
[6] Arash Lotfipour and Hossein Afrakhte, “A Discrete Teaching-Learning- Based optimization algorithm to solve distribution system reconfiguration in presence
of distributed generation”, Electrical Power and Energy Systems,Vol.82 (2016), pp.264-273
[7] Ali E.S. , Abd Elazim S.M. and Abdelaziz A.Y., “Improved Harmony Algorithm and Power Loss Index for optimal locations and sizing of capacitors in
radial distribution systems”, Electrical Power and Energy Systems, Vol.80 (2016), pp.252–263
[8] Sharmistha Sharma,Subhadeep Bhattacharjee and Aniruddha Bhattacharya, “Quasi-Oppositional Swine Influenza based optimization with Quarantine for
optimal allocation of DG in radial distribution network,”
[9] Electrical Power and Energy Systems, Vol.74(2016), pp.348-373
[10] Seyedali Mirjalili and Andrew Lewis, “The Whale Optimization Algorithm,” Advances in Engineering Software, Vol.95(2016), pp.51-67