125 | P a g e
STATISTICAL ANALYSIS OF SURFACE
ROUGHNESS BY RESPONSE SURFACE
METHODOLOGY IN WEDM USING AL COMPOSITE
Vikrant Sharma
1, Onkar Singh Bhatia
21,2
Mechanical Engineering Department, Green Hills Engineering College, Kumarhatti, Solan
ABSTRACT
Non-conventional machining technology is effectively used in modern manufacturing industries. This paper
investigatesthe influence of three different input parameters such Peak current, Pulse on time and Pulse off
Time ofwire electrical discharge machining (WEDM) performances of surface roughness (SR) using response
surface methodology with central compositedesign (CCD). The Machining analyses were performed at WEDM
machine utilizing 0.25 mm wire as electrode material on aluminium based alloy . The machining
characteristicsare significantly influenced by the electrical and non-electrical parameters in WEDMprocess.
The impacts of the methodology parameters on surface roughness were assessed by the examination of change
(ANOVA). Analysis of variance (ANOVA) was performed to find out the significant influence of each factor.
Keywords:wire electrical discharge machine; optimization; Surface roughness; Response surface
methodology,ANOVA
I. INTRODUCTION
WEDM is recognized as an effective machining techniqueused in a wide range of applications namely
automotive, aerospace,defense, electronics, telecommunications, healthcare, environmental,industrial and
consumer products of micro-feature withmicro- and nano-level surface finish. WEDM process transforms
electrical energy into thermalenergy for eroding the material. The electrodes are immersed indielectric liquid or
flowing pressurized dielectric medium. A verysmall amount of work materials melt and vaporize by a series
ofdischarge energy between tool and work piece. Debris materials areflushed out from the sparking area by the
dielectric fluid. Due to thecontactless process between tool and work piece, any conductivematerial can be
machined by WEDM regardless of its hardness andtoughness.Non traditional machining methods are
dynamically used to fabricate great mechanical segments. In non traditional machining methodology wire
electrical discharge machine (WEDM) is a thermo electrical machining process in which the material is expelled
from work piece by series of electrical sparks between wire electrode and work piece. The vitality substance of a
single spark discharge is communicated as a result of pulse on time and peak current. Vitality contained in a
minor sparkle release evacuates as part of work piece material. Extensive number of such time separated minor
releases between work piece and wire electrode causes the electro disintegration of the work piece material. Al,
brass, zinc covered metal or copper wires are generally used as electrode material. The distance across of the
wire electrode is of 0.25mm to 0.50mm measurement .Wire electrical discharge machine will be machine
126 | P a g e
automobile, atomic, machine industry. In the present exploration study WEDM on aluminum alloy has beenconducted . This material is considered for exploration work because of its both high wear resistant and
ductility. Response surface methodology (RSM) is a collection of statistical and mathematical techniques useful
for design of experiments and optimizing process parameters . RSM was used to predict the machining
performance of WEDM process in terms of surface roughness with input process parameters. The optimal
values were obtained from the RSM based on careful planning and execution. Many researchers have evaluated
the machining characteristic of WEDM using response surface methodology. The central composite design
(CCD) is an efficient technique that could be applied to modeling of micro-WEDM in RSM. The polynomial
equation formed from RSM was used to express the machining performance of the WEDM process. In this
experiment, machining performance of SR was modeled in terms of pulse on time, pulse off time and peak
current.
II. LITERATURE REVIEW
1. Rajyalakshmi G et al. (2013) used Inconel 825.Taguchi orthogonal array design of experiment and grey
relational analysis were combined. The main objective of this study is to obtain improved material removal
rate, surface roughness, and spark gap. Grey relational theory is adopted to determine the best process
parameters that optimize the response measures. The experiment has been done by using Taguchi’s
orthogonal array L36. The experimental results confirm that the proposed method in this study effectively
improves the machining performance of WEDM process.
2. Kumar K et al. (2013):- Material used was Al-SiC plate. Experiments have been conducted with parameters
(Time On, Time Off, Wire Speed & Wire Feed)in three different levels. Data related to process responses
viz. Metal removal rate, surface roughness (Ra) have been measured for each of the experimental run.
These data have been utilized to fit a quadratic mathematical model (RSM) for each of the responses, which
can be represented as a function of the process parameters. Taguchi techniques have been used for
optimization of minimizing the surface roughness.
3. Tosun N et al. (2003):- In this study SAE 4140 STEEL was used. The variation of workpiece surface
roughness with varying pulse duration, open circuit voltage, wire speed and dielectric fluid pressure was
experimentally investigated in WEDM. Brass wire with 0.25 mm was used. It is found experimentally that
the increasing pulse duration, OCV and wire speed, increase the surface roughness whereas increasing
dielectric pressure decreases the surface roughness. Regression analysis method is usually used to obtain
relation between input-output parameters.
4. Caydas U et al. (2009) conducted the experiments on AISI D5 TOOL STEEL. In this paper an adaptive
neuro-fuzzy inference system (ANFIS) model has been developed for the prediction of the white layer
thickness (WLT) and the average surface roughness achieved as a function of the process parameters. Pulse
duration, OCV, flushing pressure and wire feed rate were input parameters. Both artificial neural network
(ANN) and fuzzy logic (FL) are used in ANFIS architecture taken as model’s input features. this approach
can greatly improved the process responses such as surface roughness and WLT in WEDM.
5. Kumar A et al (2010).:-Material used was EN-24 TOOL STEEL. A technique for optimization of abrasive
mixed electrical discharge machining (AEDM) process with multiple performance characteristics based on
127 | P a g e
dielectric is mixed with powder form abrasive. As a result, the process becomes more stable, therebyimproving machining rate and surface finish. It was found that abrasive powder addition has stronger effect
on multi performance characteristics than peak current, pulse on time, and duty factor.
6. Vundavilli P.R et al. (2012) used Ti6Al4V TITANIUM ALLOY as a work piece. In present paper, NSGA
II (non –dominated sorted genetic algorithm-II) and PSO (practical swarm optimization)are utilized to
optimize the performance of WEDM process. Both the approaches are found to show similar trend on the
pereto-optimal fronts. Moreover, GA has slightly outperformed PSO in terms of the optimal solution
obtained. It is also important to note that PSO has produced the optimal front in less time when compared
with the GA.
7. Dave .K.V et al. (2012) used AISI H13 STEEL in experiment. This study present the analysis based on
Taguchi design and ANOVA. Experiments were conducted and found the contribution of Tool Geometry
on the Surface Roughness and Material Removal Rate (MRR) with other processing parameters. There are
four different electrode geometry is taken into consideration. They are Round, Square, Rectangle, Triangle
.Tool geometry is not the most significant factor but it is a significant factor that affects the performance
measures.
8. Lal H et al. (2012):- Standard aluminium test piece was used in study. This paper provides a summary of
the three types of manufacturing processes currently being used in the fabrication of micro channels. The
three micromachining techniques compared in this research are wire-cut EDM, micro-slotting and micro-
milling. Surface finish of fabricated micro-channel in case of wire-cut EDM was observed to be superior
than using micro end mill cutter, followed by those from slotting saw. The time taken to finish the job using
wire-cut EDM was highest.
9. Bobbili R.et al.(2013);-Study was done on Armor STEEL. Pulse on-time, spark voltage, wire tension, wire
feed, pulse off-time, and flushing pressure are the main process variables of the WEDM. In the current
investigation, Taguchi orthogonal array (L27) was chosen for designing the experiments. ANOVA and
regression model were employed as mathematical tools in understanding the effects of process parameters.
CuZn37 suncut brass wire with 0.25mm diameter was employed in the present trials. The SR decreases with
the raise in Ton. Conversely, it increases with raise in Toff and SV. The influence of wire tension is not
very significant.
10. Liao Y.S et al.(2004):- With the assistance of Taguchi quality design, ANOVA and F-test, machining
voltage, current-limiting resistance, type of pulse-generating circuit and capacitance are identified as the
significant parameters affecting the surface roughness in finishing process. To obtain good SR, the
traditional circuit using low power for ignition is modified for machining as well. A dc pulse-generating
circuit of positive polarity (wire electrode is set as anode) can achieve a better surface roughness in
finishing operation. A fine surface of roughness Ra = 0.22m is achieved.
11. AravindS.Ret al (2012):-The work-piece material used in this study was Brass. In this work, an attempt was
made to determine the important machining the parameters of brass material for the performance measures
like MRR and SR separately in WEDM process. Factors like the pulse duration and the feed rate have been
found to play as significant role in rough cutting operations for the maximization of metal removal rate and
128 | P a g e
the optimum machining parameters for the maximization of metal removal rate and minimization of surfaceroughness.
12. Reddy P.V et.al (2010):-Material used in the study was Cr-Mo-V alloyed special steel. In this paper the
Artificial Neural Network (ANN) model is developed to predict the surface roughness in WEDM. The
neural network Models strained with experimental results conducted using L16 orthogonal array by
considering the input parameters such as pulse duration, open voltage, wire speed and dielectric flushing
pressure at four different levels. The mathematical relation between the work piece surface roughness and
WEDM cutting parameters is also established by multiple regression analysis method.
13. Yeakub Ali M et al. (2008):-Copper was used as a work material. The effect of discharge current, pulse-on
time, and gap voltage on surface finish were studied. Conventional WEDM could be used to manufacture a
miniaturized component with low cost compared to other methods such as EDM, FIB, LIGA, etc. The size
of the micro components to be produced by WEDM depended on wire electrode diameter. Use of smallest
diameter and optimum machining parameters resulted in high geometrical integrity and surface finish.
14. Lin Y.C et al(2006).:-SKH 57 HIGH SPEED STEEL was used in the study as work material.Parts of the
experiment were conducted with the L18 orthogonal array based on the Taguchi method. Moreover, the
signal-to-noise ratios associated with the observed values in the experiments were determined by ANOVA
and F-test. In this investigation six machining parameters were considered. Three observed values of MRR,
EWR, and SR were examined.
III. EXPERIMENTATION AND RESULTS:
Work piece area (200mm×70mm) with height 5mm is prepared by cutting operation. The material from
substrate is removed by machining and the specimen is ready for wire-EDM process with the help of which
Square pieces are made. Figure of machined pieces is shown below.
Response surface methodology provide an efficient and systematic way to optimize designs for performance,.
The objective is to study a large number of variables with a small number of experiments usingRSM
significantly reduces the number of experimental configurations to be studied. Furthermore, the conclusions
drawn from small-scale experiments are valid over the entire experimental region spanned by the control factors
and their settings. Table1 shows the parameters and their levels.
129 | P a g e
Table 1 Parameters and their levelsAnalysis of variance (ANOVA):
Experimentation according to design of experiment has been done using wire cut EDM. The experimental results
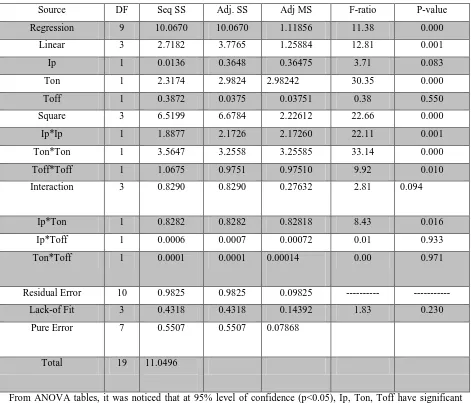
drawn from experimentation has been analyzedTable2 show the analysis of variance done for regression model.
Table2 analysis of variance for regression
Source DF Seq SS Adj. SS Adj MS F-ratio P-value
Regression 9 10.0670 10.0670 1.11856 11.38 0.000
Linear 3 2.7182 3.7765 1.25884 12.81 0.001
Ip 1 0.0136 0.3648 0.36475 3.71 0.083
Ton 1 2.3174 2.9824 2.98242 30.35 0.000
Toff 1 0.3872 0.0375 0.03751 0.38 0.550
Square 3 6.5199 6.6784 2.22612 22.66 0.000
Ip*Ip 1 1.8877 2.1726 2.17260 22.11 0.001
Ton*Ton 1 3.5647 3.2558 3.25585 33.14 0.000
Toff*Toff 1 1.0675 0.9751 0.97510 9.92 0.010
Interaction 3 0.8290 0.8290 0.27632 2.81 0.094
Ip*Ton 1 0.8282 0.8282 0.82818 8.43 0.016
Ip*Toff 1 0.0006 0.0007 0.00072 0.01 0.933
Ton*Toff 1 0.0001 0.0001 0.00014 0.00 0.971
Residual Error 10 0.9825 0.9825 0.09825 --- ---
Lack-of Fit 3 0.4318 0.4318 0.14392 1.83 0.230
Pure Error 7 0.5507 0.5507 0.07868
Total 19 11.0496
From ANOVA tables, it was noticed that at 95% level of confidence (p<0.05), Ip, Ton, Toff have significant
effect on Surface roughness. It can be seen that Toffis most significant in case of surface roughness.
Levels
Input Parameters
-α
-1
0
+1
+α
Units
Peak Current
65.91
100
150
200
230
Amp
Pulse on Time
101.5
105
110
115
118.4
µsec
130 | P a g e
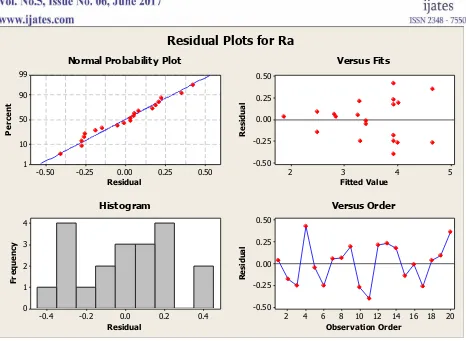
Fig 6.10 Residual Plot for Roughness (Ra)
By generating these plots, the authenticity of regression equation is checked. It can be seen from residual plots
that the residuals follow an approximately straight line in normal probability plot and approximate symmetric
nature of histogram indicates that the residuals are normally distributed. Since residuals exhibit no clear pattern,
there is no error due to time or data collection order. It is indicated in residual vs. fits plot that variances are not
equal.
IV. REGRESSION ANALYSIS
Regression coefficients of the second order equation are obtained by using experimental data. The
regressionequation for the surface roughness as a function of three input process parameters was developed and
is given below.
Ra=-211.488-(Ip×0.106)+(Ton×4.043) - (Toff×0.192) -(Ton×Ton×0.019)+(Toff×Toff×0.003)+ (Ip×Ton×0.001)
(1)
V. CONCLUSIONS
Experimental investigation on wiirecutelectrical discharge machiningof Al composite has been done using
response surface methodology. The following conclusions are made.
1. From ANOVA analysisit was noticed that Toff is most significant in case of surface roughness.
2. The statistical graph has been plotted and from histogramit is observed that the residuals are normally
distributed.and residuals exhibiting no clear pattern.
0.50 0.25 0.00 -0.25 -0.50 99 90 50 10 1 Residual P er ce nt 5 4 3 2 0.50 0.25 0.00 -0.25 -0.50 Fitted Value R es id ua l 0.4 0.2 0.0 -0.2 -0.4 4 3 2 1 0 Residual Fr eq ue nc y 20 18 16 14 12 10 8 6 4 2 0.50 0.25 0.00 -0.25 -0.50 Observation Order R es id ua l
Normal Probability Plot Versus Fits
Histogram Versus Order
131 | P a g e
3. Regression coefficients of the second order equation has been obtained by using experimental data.Mathematical model for surface roughness as a function of three input process parameters was developed.
REFERENCES
[1.] Rajyalakshmi G &VenkataRamaiah P “Multiple process parameter optimization of wire electrical
discharge machining on Inconel 825 using Taguchi grey relational analysis” Int J AdvManuf
Technol.2013.
[2.] Kumara K &Ravikumar R “Optimization of WEDM parameters using Taguchi design to check surface
roughness” International Journal of Modern Engineering Research, Vol. 3, Issue. 3, pp-1645-1648,
May.-June. 2013.
[3.] Tosun N, Cogun C &Inan A “The Effect of Cutting Parameters on Work-piece Surface Roughness in Wire
EDM”, MACHINING SCIENCE AND TECHNOLOGY, Vol. 7, No. 2,. pp. 209–219, 2003.
[4.] Çayda U, Hascalık A&Ekici S “ An adaptive neuro-fuzzy inference system (ANFIS) model for wire
EDM” Expert Systems with Applications 36 pp:6135–6139,2009.
[5.] Kumar A,Maheshwari S, Sharma C &Beri N “ A Study of Multi-objective Parametric Optimization of
Silicon Abrasive Mixed Electrical Discharge Machining of Tool Steel” Materials & Manufacturing
Processes, 25: pp.1041–1047, 2010.
[6.] Vundavilli P.R , Kumar J.P &Priyatham C.S “ Parameter Optimization of Wire Electric Discharge
Machining Process using GA and PSO” IEEE-International Conference On Advances In Engineering,
Science And Management, pp:180-185, March 30- 31, 2012.
[7.] Dave V.K & Patel D.S “Effect of Tool geometry and Process parameters on Surface roughness and MRR
in EDM of Tool Steel” International Journal of Engineering Research & Technology (IJERT) Vol. 1 Issue
5, July 2012.
[8.] .LalH, Lal H & Sehgal S.S, “evaluation of micromachining processes for fabrication of micro-channels”
International Journal of Latest Trends in Engineering and Technology’ Vol. 1 Issue 3 September 2012.
[9.] Bobbili R,Madhu V &Gogia A.K “ Effect of Wire-EDM Machining Parameters on Surface Roughness and
Material Removal Rate of High Strength Armor Steel” Materials and Manufacturing Processes,
28:,pp364–368, 2013.
[10.]Liao Y.S, Huang J.T & Chen Y.H“A study to achieve a fine surface finishes in Wire-EDM” Journal of
Materials Processing Technology 149,pp: 165–171. (2004).
[11.]AravindS.R, SowmyiS &Yuvaraj K.P “optimization of metal removal rate and surface roughness on
wire-EDM using Taguchi method” International Conference On Advances In Engineering, Science And
Management,pp:156-159, March 30, 31, 2012.
[12.]Reddy.P.V, Kumar V &Hemachandra Reddy K “Modelling Of Wire- EDM Process Using Back
Propagation (BPN) and General Regression Neural Networks (GRNN)”IEEE,pp:317-321. 2010.
[13.]YeakubAli.M&Mohammad A.S “Experimental Study of Conventional Wire Electrical Discharge
Machining for Micro-fabrication” Materials and Manufacturing Processes,23, ,pp :641–645. 2008.
[14.]
Lin.Y.C, Cheng C.H, Su B.L & Hwang L.R “ Machining Characteristics and Optimization of MachiningParameters of SKH 57 High-Speed Steel Using Electrical-Discharge Machining Based on Taguchi