IJSRSET1736135 | Received : 01 Oct 2017 | Accepted : 12 Oct 2017 | September-October-2017 [(3)6: 572-583]
© 2017 IJSRSET | Volume 3 | Issue 6 | Print ISSN: 2395-1990 | Online ISSN : 2394-4099 Themed Section: Engineering and Technology
572
A Study by Comparison on Vertical Geometric Irregular
Frame-Wall Structure Under Lateral Loading
Faria Aseem
Department of Civil Engineering, Lords Institute of Engineering and Technology, Himayathsagar,
Hyderabad, India
ABSTRACT
Recent earth quakes in many parts of the globe have revealed the issue regarding the vulnerability of existing buildings. The exiting building structures which were designed and constructed according to earlier code provisions do not satisfy requirement of current seismic code and design practice. Many reinforced concrete buildings in urban regions lying in active seismic zone may suffer moderate to severe damages during future ground motion therefore it is essential to mitigate unacceptable hazards to property and life of occupant. Building may be considered as asymmetric in plan or in elevation based on the distribution of mass and stiffness along each storey throughout the height of the buildings. Most of the hilly regions of India are highly seismic. Buildings on hill slopes differ in a way from other buildings. The various floors of such building steps back towards the hill slope and at the same time buildings may have setbacks also. Due to varied configurations of these buildings become highly irregular and asymmetric. Buildings situated in hilly areas are much more vulnerable to seismic environment. The performance of structures during past earthquakes has shown that asymmetric-plan buildings are especially vulnerable to earthquake damage. Therefore, numerous investigations in the past have investigated the earthquake behavior of asymmetric-plan buildings. In the study, 3D analytical model Ascending and Descending buildings have been generated and analyzed using structural analysis tool "STAAD. Pro." To study the effect of varying height of columns in top storey due to Architectural purpose. The analytical model of the building includes all important components that influence the mass, strength, stiffness, and deformability of the structure. The deflections at each storey level has been compared by performing response spectrum method has been performed to determine capacity, demand and performance level of the considered building models.
Keywords: STAAD, 3D Analytical Model, Complete Quadratic Combination
I.
INTRODUCTION
Man is familiar with many natural disasters that occur on the surface of earth, e.g., earthquakes, floods, tornadoes, hurricanes, droughts, and volcanic eruptions etc. Of all natural disasters the least understood and most destructive are earthquakes. The annual losses due to earthquakes are very large in many parts of the world. Although the incidence of earthquakes of destructive intensity has been confined to a relatively few areas of the world, the catastrophic consequences attending the few that have struck near centers of population have focused attention on the need to provide adequate safety against disaster. Obviously it is impossible to build an earthquake proof structure. All that possible is with effective
application of earthquake engineering knowledge the collapse of structures and the consequent loss of life can be avoided. Usually all structures are designed to resist the intensity of moderate earthquake. This is based on the philosophy that it is less expensive to repair or replace the small number if structures which will be hit by a major earthquake than to build all structures strong enough to avoid damage.
II.
OBJECTIVES OF THE STUDY
The objective of the present work is to study the behaviour of a six, eight & ten storey building with different irregularity in geometry under earthquake loading. Irregularity are categories ranging from 0 percentage to 75 percentage with interval of 25 percentage is considered in this study which generally covers the irregular structures encountered in practice. For each case member forces (such as Bending moment, Shear force Base shear, Displacement, and Drift) are estimated and studied the effect of irregular structures on the member forces. The analysis of the building has been carried out using STAAD PRO V8i.
III.
LITERATURE REVIEW
Kumar and Paul (1994) have stated that buildings having step back and setback configurations are unsymmetrical in horizontal and vertical planes. These are subjected to translational and torsional deformations under earthquake excitations. Centre of mass of each floor of this type of buildings normally lie on different vertical axes. A method of analysis based on transformation of stiffness and mass matrices about a vertical reference axis is developed. Each storey of the building is modelled as having three degrees of freedom per floor with floor diaphragm as rigid.
J. A. Amin Et al. has done the experiments on wind tunnel models to evaluate wind pressure distributions on different faces of typical-plan shape buildings. Models, having the same plan area and height but varying plan shape (“L” and “T” ) are tested in a closed circuit wind tunnel under boundary layer flow. It was observed that there is a large variation in pressure along the height as well as along the width of different faces of the models. The location and magnitude of the measured peak pressure co-efficient vary considerably with wind direction. It was also observed that changing the plan dimensions considerably affects the wind pressure distributions on different faces of the building models.
IV.
METHODOLOGY
When a structure is subjected to earthquake, it responds by vibrating. An earthquake can be resolved in any three mutually perpendicular directions-the two horizontal directions (x and y) and the vertical direction (z). This motion causes the structure to vibrate or shake in all three directions; the predominant direction of shaking is horizontal. All the structures are primarily designed for gravity loads-force equal to mass times gravity in the vertical direction. Because of the inherent factor of safety used in the design specifications, most structures tend to be adequately protected against vertical shaking. Vertical acceleration should also be considered in structures with large spans, those in which stability for design, or for overall stability analysis of structures.
Equivalent Lateral Force (Seismic
Coeficient) Method:
In all the methods of analyzing multi story buildings recommended in the code, the structure is treated as discrete system having concentrated masses at floor levels which include half that of columns and below the floor. In addition, the appropriate amount of live load at this is also lumped with it. It is also assumed that the structure flexible and will deflect with respect to the position of foundation the lumped mass system reduces to the solution of a system of second order differential equations. These equations are formed by distribution of mass and stiffness in a structure, together with its damping characteristics of the ground motion.
1) BASE SHEAR:
According to IS 1893(part1): 2002, the base shear Vb is given by the following formula:
Vb = Ah W eq. 3.1
Here,
Ah = Design horizontal acceleration spectrum value using the fundamental natural period „T‟ in the considered direction of vibration
W = seismic weight of the building
2
a h
S Z I A
R g
eq. 3.2
Z= Zone factor as per table 2 of IS: 1893
I= Importance factor as per table 6 of IS: 1893 = 1.5 for important structures
R= Response reduction factor as per table 7 of IS: 1893 value varies between
3 and 5 with respect to ductile reinforcement detailing Sa/g= Average response acceleration coefficient as per clause 6.4.5 of the
Indian Standard IS 1893:2002.
Figure 3.1 Design spectrum for 5% damping as per Indian Standards 0.0 0.5 1.0 1.5 2.0 2.5 3.0
0.0 1.0 2.0 3.0 4.0
Period (s) S p ct ra l A cc el er ai o n C o ef fic ie n t (S a/ g
) Type I (Rock,or Hard Soil)
Type II (Medium Soil) Type III (Soft Soil)
SEISMIC WEIGHT: The seismic weight of building is the sum of seismic weight of all the floors. The seismic weight of each floor is its full dead load plus appropriate amount of imposed load. While computing the seismic weight of columns and walls in any story shall be equally distributed to the floors above and below the story.
TIME PERIOD:
The approximate fundamental natural period of vibration Ta in seconds, of a moment resisting frame building without brick infill panels may be estimated by the following empirical formula
Ta = 0.075h0.75 for RC frame building eq.3.3
Ta = 0.085h0.75 for steel frame building eq.3.4
The approximate fundamental natural period of vibration in seconds of all other, buildings including moment resisting frame buildings with brick infill panels may be estimated by the following expression.
√ eq 3.5 Where
H= Height of building in meters. (This excludes the basement stories where basement walls are connected with the ground floor deck or fitted between the columns. But it includes the basement stories, when they are not connected)
d= base dimensions of the building at the plinth level, in m, along the consider direction of the lateral force.
As per IS 1893: 2002 in clause 7.7.1 mentioned that the force thus obtained shall be distributed along the height of the building as per the following expression:
2 2 j j i i b i
h
W
h
W
V
Q
eq. 3.6 WhereQi = Design lateral force at floor i, Wi=seismic weight of floor
hi= height of floor measured from base, and
n = number of storeys in the building i.e., number of levels at which masses are located.
Response spectrum analysis
According to IS 1893:2002, high rise and irregular buildings must be analysed by response spectrum method using response spectra. Sufficient modes to capture at least 90% of the participating mass of the building (in each of two orthogonal principle horizontal directions) have to be considered the analysis. If base shear calculated from the response
spectrum analysis
(
V
B)
is less than the design baseshear(VB), the response quantities (member forces,
displacements, storey shears and base reactions) have
to be scaled up by the factor
V
B/
V
B.The response spectra are given by the following equations
For type I soil (Rock or Hard Soil sites)
1 15 ;0.00 0.10
2.50 0.10 0.40
1 0.40 4.00 a T T S T g T T
For type II (Medium soil)
1 15 ;0.00 0.10
2.50 0.10 0.55
1.36 0.55 4.00 a T T S T g T T
For type III (Soft soil)
1 15 ;0.00 0.10
2.50 0.10 0.67
1.67 0.67 4.00 a T T S T g T T
SRSS (square root sum of squares) or the CQC (complete quadratic combination) rule.
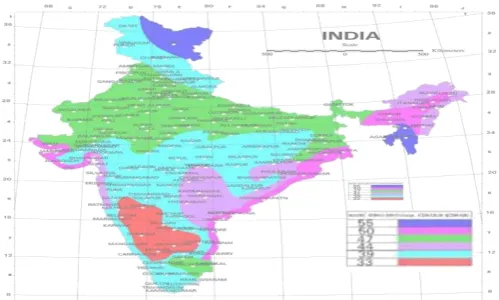
WIND LOADS:
Basic Wind Speed (VB): Figure gives basic wind speed map of India, as applicable at 10 m height above mean ground level for different zones of the country. Basic wind speed is based on peak gust speed averaged over a short time interval of about 3 seconds and corresponds to 10m height above the mean ground level in an open terrain (Category 2). Basic wind speeds presented in Fig.1 have been worked out for a 50-year return period.
Figure 1. Basic wind speed in m/s (based on 50 year return period)
Design Wind Speed (Vz)
The basic wind speed for any site shall be obtained from Fig. 3.2 and shall be modified to include the following effects to get design wind speed, Vz at any height, Z for the chosen structure: (a) Risk level, (b) Terrain roughness and height of structure, (c) Local topography, and (d) Importance factor for the cyclonic region. It can be mathematically expressed as follows: V z = V b k1 k 2 k3
where
V z = design wind speed at any height z in m/s, Vb = basic wind speed in m/s,
k1 = probability factor (risk coefficient) k2 = terrain roughness and height factor k3 = topography factor and
k4 = importance factor for the cyclonic region
NOTE: The wind speed may be taken as constant up to a height of 10 m. However, pressures for buildings
less than 10m high may be reduced by 20% for stability and design of the framing.
Risk Coefficient (k1 )
Fig.1 gives basic wind speeds for terrain category 2 as applicable at 10 m height above mean ground level based on 50 years mean return period. The suggested life span to be assumed in design and the corresponding k factors for different class of structures for the purpose of design are given in Table 3.3. In the design of all buildings and structures, a regional basic wind speed having a mean return period of 50 years shall be used except as specified in the note of Table 1
Table. 1 k factors to obtain design wind speed variation with height in different terrains
Terrain and Height Factor (k2 )
Terrain – Selection of terrain categories shall be made with due regard to the effect of obstructions which constitute the ground surface roughness. The terrain category used in the design of a structure may vary depending on the direction of wind under consideration. Wherever sufficient meteorological information is available about the wind direction, the orientation of any building or structure may be suitably planned.
Terrain in which a specific structure stands shall be assessed as being one of the following
terrain categories:
Category 1 – Expo sed open terrain with a few or no obstructions and in which the average height of any object surrounding the structure is less than 1.5 m. This category includes open sea coasts and flat treeless plains.
open parklands and undeveloped sparsely built-up outskirts of towns and suburbs. Open land adjacent to seacoast may also be classified as Category 2 due to roughness of large sea waves at high winds.
Category 3 – Terrain with numerous closely spaced obstructions having the size of building-structures up to 10 m in height with or without a few isolated tall structures. This category includes well-wooded areas, and shrubs, towns and industrial areas fully or partially developed.
Category 4 –Terrain with numerous large high closely spaced obstructions. This category includes large city centers, generally with obstructions taller than 25 m and well-developed industrial complexes
Variation of wind speed with height for different terrains (k 2 factor) –
Table 1 gives multiplying factor (k2 ) by which the basic wind speed given in Fig.1 shall be multiplied to obtain the wind speed at different heights, in each terrain category.
Terrain categories in relation to the direction of wind –
As also mentioned above, the terrain category used in the design of a structure may vary depending on the direction of wind under consideration. Where sufficient meteorological information is available, the basic wind speed may be varied for specific wind directions
Changes in terrain categories –
The speed profile for a given terrain category does not develop to full height immediately with the commencement of that terrain category but develops gradually to height (h ) which increases with the fetch or upwind distance (x).
Topography (k3 factor) –
The basic wind speed V b given in Fig. 3.1 takes account of the general level of site above sea
level. This does not allow for local topographic features such as hills, valleys, cliffs, escarpments, or ridges, which can significantly affect the wind speed in their vicinity. The effect of topography is to accelerate wind near the summits of hills or crests of cliffs, escarpments or ridges and decelerate the wind in valleys or near the foot of cliffs, steep escarpments, or ridges. The effect of topography will be significant at a site when the upwind slope (θ) is greater than about 3 , and below that, the value of k3 may be taken to be equal to 1.0. The value of k is confined in the range of 1.0 to 1.36 for slopes greater than 3 . A method of evaluating the value of k3 for values
greater than 1.0 is given in Appendix C. It may be noted that the value of k3 varies with height above ground level, at a maximum near the ground, and reducing to1.0 at higher levels, for hill slope in excess of 17
Importance factor for cyclonic region (k4 )
Cyclonic storms usually occur on the east coast of the country in addition to the Gujarat coast on the west. Studies of wind speed and damage to buildings and structures point to the fact that the speeds given in the basic wind speed map are often exceeded during the cyclones. The effect of cyclonic storms is largely felt in a belt of approximately 60 km width at the coast. In order to ensure greater safety of structures in this region (60 km wide on the east
coast as well as on the Gujarat coast),the following values of k4 are stipulated, aapplicable according to the importance of the structure:
Structures of post–cyclone importance 1.30
Industrial structures 1.15
All other structures 1.00
Design wind pressure:
The wind pressure at any height above mean ground level shall be obtained by the following relationship between wind pressure and wind speed: 2
Pz =0.6Vz
where p z = wind pressure in N/m at height z, and V z= design wind speed in m/s at height z.
V.
MODELLING DESCRIPTION OF BUILDING
The structure chosen for study is a six storied commercial complex building. The building is located in seismic zone II on a site with medium soil. A three-dimensional mathematical model for the same is generated in STAAD PRO software the building with dimensions 30m x 30m. Analysis and design for typical building is to be performed.
BASIC DATA:
Structure symmetric regular building
Plan dimensions 30 × 30 m
Height of each floor 3 m Ground floor height 3 m
Dimension of beams (main) 230 × 600 mm Slab thickness 125 mm Support fixed Zone II LOADS
1. Water proofing on terrace = 1.0 kN/m2 2. Floor finishes = 1.0 k N/m2
3. Live load = 2 k N/m2
LOAD CALCULATION
(Seismic weight calculations)
The weight of columns and walls in any story shall be equally distributed to the floors above and below the story. Following reduced live loads are used for analysis: zero on terrace, and 50% on other floors [ IS:1893 (Part 1):2002, Clause 7.4]
(1) Story 7 (Terrace)
From slab = 30*30* 25*(0.125)=2812.5
Column =0.3*0.6*25*147=661.5
Beams = 0.23*0.6*25*245 = 3105 kN Floor finishes = (30*30*1)= 900 Wall load=1*0.115*20*(30*4)=276KN Live load = (30*30*2) = 1800 kN Total dead load = 7756kN Total live load = 1800kN PLINTH
Dead loads:
Beams = 0.23*0.6*25*245= 3105kN Coloums = 0.3*0.6*25*147=661.5KN Wall load= 2.4*0.115*20*245=1353KN Total dead load= 5120 KN
TYPICAL FLOORS (2,3,4,5,) Dead load:
From slab = 30*30* 25*0.125=2812.5, 2812.5*4=11250 Column =0.3*0.6*25*147=661.5, 661.5*4=2646 Beams = 0.23*0.6*25*900 = 3105 kN, 3105*4=12420 Floor finishes = (30*30*1)= 900, 900*4=3600
Wall load=2.4*0.115*20*245=1353KN = 1353*4=5412 Live load = (30*30*2) = 1800 kN=1800*4= 7200 Total dead load = 35328kN
Total live load = 7200 kN
Seismic weight of the entire building =48204 +0.25*9000
= 50454 kN
2) Calculation of lateral forces as per IS 1893: 2002 in clause 7.5
Ta = 0.075 h 0.75 IS: 1893 (Part 1):2002, Clause 7.6.1 = 0.075 * (18)0.75
= 0.65 sec
Zone factor, z = 0.16 for Zone III as per IS: 1893 (Part 1):2002, Table 2
Importance factor, I = 1
Medium soil site and 5% damping
Sa/g = 2.50/0.65 = 3.846 IS: 1893 (Part 1):2002, Figure 2.
Response reduction factor = 3 Ah = (Z/2) (I/R)(Sa/g) = 0.10256
Hence the total design lateral force or design seismic base shear along any principle direction
Vb = AhW W = 42305.5 kN
Vb= AhW
=0.10256 * 50454
Vb= 5175kN.
WIND LOAD
k factors to obtain design wind speed variation with height in differentterrains.
Heigh t (mt)
K1 K2 K3 Vz Pz
Kn/m2
10 1 0.88 1 38.70 0.98
15 1 0.94 1 41.36 1.02
20 1 0.98 1 43.12 1.11
30 1 1.03 1 45.32 1.23
50 1 1.09 1 47.96 1.38
LOAD CASES
The loading on the buildings are dead load, live load, and wind load.
1. Dead load case:
a) Floor load 1.5 KN/m2
b) Wall load 11 KN/m
c) Self weight
The building is designed as a concrete structure and the self weight of the building is taken in the dead load case 2. Live load case:
a) live load 2 KN/m2
Plan of the six storey building
Plan of the eight storey building
Plan of the ten storey building
VI.
RESULT AND DISCUSSIONS
Model Description
MA1= 6 storey Basic Model without vertical irregularity. MA2= 6 storey Basic Model with 25% vertical irregularity.
MA3= 6 storey Basic Model with 50% vertical irregularity.
MA4= 6 storey Basic Model with 75% vertical irregularity.
MB1= 6 storey Basic Model without vertical irregularity.
MB2= 6 storey Model with 25% vertical irregularity. MB3= 6 storey Model with 50% vertical irregularity. MB4= 6 storey Model with 75% vertical irregularity.
MC1= 8 storey Basic Model without vertical irregularity. MC2= 8 storey Basic Model with 25% vertical irregularity.
MC3= 8 storey Basic Model with 50% vertical irregularity.
MC4= 8 storey Basic Model with 75% vertical irregularity.
MD1= 8 storey Basic Model without vertical irregularity.
MD2= 8 storey Model with 25% vertical irregularity. MD3= 8 storey Model with 50% vertical irregularity. MD4= 8 storey Model with 75% vertical irregularity.
ME1= 10storey Basic Model without vertical irregularity. ME2= 10storey Basic Model with 25% vertical irregularity.
ME3= 10storey Basic Model with 50% vertical irregularity.
ME4= 10storey Basic Model with 75% vertical irregularity.
MF1= 10storey Basic Model without vertical irregularity.
MF2= 10storey Model with 25% vertical irregularity. MF3= 10storey Model with 50% vertical irregularity. MF4= 10storey Model with 75% vertical irregularity.
6 storey building with 25% reduction
6 storey building with 25% reduction
8 storey building
8 storey building with 50% reduction
8 storey building with 50% reduction
10 storey building with 75% reduction
10 storey building with 75% reduction
MODEL PROPERTIES:
Maximum bending moment.
Maximum Shear Force
Comparison of base shear on vertical irregularity for 6 storey building.
Building Reduction
(%)
Fy (MA) (kN)
Fy (MB) (kN)
0 7360 8687
25 7663 10384
50 8317 10967
75 18752 10855
Comparison of base shear on vertical irregularity for 8 storey building.
Building Reduction
(%)
Fy (MC) (kN)
Fy (MD) (kN)
0 8725 10577
25 9849 11061
50 10441 11867
75 11466 12995
Comparison of base shear on vertical irregularity for 10 storey building.
Building
Reduction (%) Fy (ME) (kN)
Fy (MF) (kN)
0 10260 12317
25 10351 15584
50 11577 20417
75 14537 20340
Displacement for 6 storey building with vertical irregularity.
Displacements in (mm)
Storey level MA1 (0%) MA2 (25%) MA3 (50%) MA4 (75%)
0 0 0 0 0
G 14 12 14 17
1 91 74 88 109
2 179 144 174 211
3 264 207 267 304
4 337 257 306 376
5 394 289 343 422
6 427 306 364 447
Displacement for 6 storey building with vertical irregularity.
Displacements in (mm) Storey
level
MB1 (0%)
MB2 (25%)
MB3 (50%)
0 0 0 0 0
G 16 20 22 23
1 103 132 140 139
2 204 261 277 274
3 300 386 409 403
4 386 495 524 518
5 452 578 613 606
6 491 629 668 660
Displacement for 8 storey building with vertical irregularity.
Storey level
Displacements in (mm) MC1 (0%) MC2 (25%) MC3 (50%) MC4 (75%)
0 0 0 0 0
G 14 10 12 22
1 91 66 79 140
2 179 131 155 276
3 268 194 230 412
4 351 252 300 540
5 427 301 357 656
6 490 338 401 753
7 535 362 428 826
8 564 374 443 867
Displacement for 8 storey building with vertical irregularity.
Storey level
Displacements in (mm) MD1 (0%) MD2 (25%) MD3 (50%) MD4 (75%)
0 0 0 0 0
G 15 12 16 16.5
1 100 79 104 106
2 200 156 206 210
3 299 232 307 312
4 393 301 400 406
5 478 360 478 485
6 550 404 534 543.5
7 604 427 565 576
8 635 441 583 593.5
Displacement for 10 storey building with vertical irregularity.
Storey level
Displacements in (mm)
0% 25% 50% 75%
0 0 0 0 0
G 14 19.5 19.5 22.6
1 91 127.5 126 148
2 179 253 250 293
3 269 380 374 440
4 356 503 496 584
5 440 620 612 720
6 516 727 718 845
7 584 822 812 956
8 639 900 888 1050
9 678 956 945 1110
10 703 988 976 1150
Displacement for 10 storey building with vertical irregularity.
Displacements in (mm) Storey level MF1 (0%) MF2 (25%) MF3(50% ) MF4 (75%)
0 0 0 0 0
G 15 20 26 26.5
1 99 129 168 171
2 197 257 336 341
3 296 386 508 513
4 392 513 678 682
5 484 635 842 845
6 569 748 995 998
7 645 848 1130 1130
8 707 931 1250 1250
9 752 992 1330 1330
10 780 1030 1390 1380
Storey Drift for 6 storey building with vertical irregularity. Storey level Storey drift MA 1 (0% ) MA 2 25 % MA 3 50
% MA4 75%
0 0 0 0 0
G 14 12 14 17
1 77 62 74 92
2 88 70 86 102
3 85 63 93 93
4 73 50 60 72
5 57 32 37 46
6 33 17 21 25
Storey Drift for 6 storey building with vertical irregularity. Storey level Storey drift MB1 (0%) MB2 25% MB3 50% MB4 75%
G 16 20 22 23
1 87 112 118 116
2 101 129 137 135
3 96 125 132 129
4 86 109 115 115
5 66 83 89 88
6 39 51 55 54
Storey Drift for 8 storey building with vertical irregularity.
Storey level
Storey drift MC1
(0%)
MC2 25%
MC3 50%
MC4 75%
0 0 0 0 0
G 14 10 12 22
1 77 56 67 118
2 88 65 76 136
3 89 63 75 136
4 83 58 70 128
5 76 49 57 116
6 63 37 44 97
Storey Drift for 8 storey building with vertical irregularity.
Storey level
Storey drift
MD1 (0%) MD2 (25%) MD3 (50%) MD4 (75%)
0 0 0 0 0
G 15 12 16 16.5
1 85 67 88 89.5
2 100 77 102 104
3 99 76 101 102
4 94 69 93 94
5 85 59 78 79
6 72 44 56 58.5
7 54 23 31 32.5
8 31 14 18 17.5
Storey Drift for 10 storey building with vertical irregularity.
Storey level
Storey drift
ME1 (0%) ME2 (25%) ME3(50%) ME4 (75%)
0 0 0 0 0
1 14 19.5 19.5 22.6
2 77 108 106.5 125.4
3 88 125.5 124 145
4 90 127 124 147
5 87 123 122 144
6 84 117 116 136
7 76 107 106 125
8 68 95 94 111
9 55 78 76 94
10 39 56 57 60
11 25 32 31 40
Storey Drift for 10 storey building with vertical irregularity.
Storey level
Storey drift for
ME1 (0%) ME2 (25%) ME3(50%) ME4 (75%)
0 0 0 0 0
1 15 20 26 26.5
2 84 109 142 144.5
3 98 128 168 170
4 99 129 172 172
5 96 127 170 169
6 92 122 164 163
7 85 113 153 153
8 76 100 135 132
9 62 83 120 120
10 45 61 80 80
11 28 38 60 50
VII.
CONCLUSIONS
Based on the limited study of analysis results the following conclusions are drawn
a. The base shear were increased by an average 19%, 28% & 42% for regular model with irregularity and whereas for +shape model increased by 25% , 47% and 65%. However, as the height of the structure was increasing the base shear due to vertical irregularity was increasing gradually.
b. The drift of all the building with increasing in percentage of irregularity got increased gradually. That means the greater the drift, greater the likelihood of damage of structure. The value of inter-storey drift exceed 0.10 indicate probable of building collapse.
c. The maximum displacement of 75 percentage irregularity in building were increased by about 75% with respect to +shape without irregularity & similarly 65% were increased for regular shape without irregularity.
d.
can be seen that as the irregularity in structure increases, the bending moments & shear force also increases for column.
VIII.
REFERENCES[1]. IS 456-2000 "Code of Practice for Plain and Reinforced Concrete", Bureau of Indian Standards, New Delhi
[2]. IS 1893-2002 "Criteria for earthquake resistant design of structures", Bureau of Indian Standards, New Delhi
[3]. IS: 875-part-3 (1987), "Indian standard code of practice for design loads (other than earthquake) for buildings and structures", Bureau of Indian Standards, New Delhi [4]. Murty, C.V.R., IIT, Kanpur, (2004)
"Earthquake tips" BMTPC, New Delhi
[5]. A.S.Warudkar, R.P.Sudarsan and G.Visalakshi (1994)-"Effect of torsional stiffness on the dynamic response of RC framed structures" proceeding Tenth Symp. On Earthquake Engineering, Roorkee, pp. 166-178
[6]. Ashok K. Jain and Satish Annigeri (1994) - "Torsional Provisions for Asymmetrical Multistory Buildings" proc. Tenth Symp. On Earthquake Engineering, Roorkee .pp.331-340 [7]. Satish Kumar and D.K.Paul (1994) "Dynamic Analysis of Step back and Setback Buildings", Proc. Tenth Symp. On Earthquake Engineering, , Roorkee, pp. 141-154
[8]. Paulay,T., and Priestley, M.J.N., (1992 ) "Seismic design of reinforced concrete and masonry buildings", John-Wiley Publishers,.