Available online on 15.09.2018 at http://jddtonline.info
Journal of Drug Delivery and Therapeutics
Open Access to Pharmaceutical and Medical Research© 2011-18, publisher and licensee JDDT, This is an Open Access article which permits unrestricted non-commercial use, provided the original work is properly cited
Open
Access
Research Article
FORMULATION AND CHARACTERIZATION OF MICROSPHERES
OF NITAZOXANIDE BY CHEMICAL CROSSLINKING METHOD
*Sachan A.K., Gupta A., Kumari K. and Ansari A.
Dayanand Dinanath College, Institute of Pharmacy, Kanpur -209214 (INDIA)
ABSTRACT
The work investigated the design and evaluation of microspheres of Nitazoxanide by Ionotropic gelation technique method. 32 Factorial designs were used and concentration of polymer carbopol-934 (X1) and Ethyl cellulose (X2) were selected as the independent variables. The surface morphology study by SEM indicated that microspheres were spherical with smooth surface. There was no interaction between the drug and polymers, as studied by FTIR study. The prepared microspheres were characterized by entrapment efficiency, particle size micromeritic properties. It was observed that on increasing polymer concentration of formulations, % yield, the entrapment efficiency and particle size were increased whereas % drug release decreased. The In Vitro release study was done using U.S.P. dissolution rate basket type apparatus in phosphate buffer pH7.4 for 10 hr. It shows that on increasing polymer concentration the drug release of all formulations was gradually decreased. In Vitro mucoadhesion study depicts that as the polymer concentration increased, mucoadhesive nature of the formulation was also increased. The microspheres of NTZ (formulation F9)showed best results due to highest drug entrapment efficiency (85.50%), and percentage drug release after 10.0 hr.
was 50.25%. The rate of release followed First order kinetics. The microspheres exhibits good mucoadhesive properties in in- vitro wash-off test at pH 7.4 (Intestinal pH) than pH 1.2 (gastric pH),because the drug was completely absorbed in Gastrointestinal tract, Therefore, it can be concluded that Nitazoxanide Loaded algino-carbopol-934 microspheres can be formulated for sustained drug delivery of Nitazoxanide used in Chronic Hipatitis-C.
Keywords: Mucoadhesive microspheres, Nitazoxanide, Carbopol-934, Ethyl cellulose, Sodium Alginate, Factorial design.
Article Info:Received 12 June, 2018; Review Completed 02 Aug 2018; Accepted 07 Aug 2018; Available online 15 Sep 2018
Cite this article as:
Sachan A.K., Gupta A., Kumari K., Ansari A., Formulation and characterization of microspheres of nitazoxanide by chemical crosslinking method, Journal of Drug Delivery and Therapeutics. 2018; 8(5):190-199
DOI:http://dx.doi.org/10.22270/jddt.v8i5.1850
*Address for Correspondence:
Anupam Kumar Sachan, Dayanand Dinanath College, Institute of Pharmacy, NH#86, Ramaipur, Kanpur – 209214
INTRODUCTION
Microspheres are small spherical particles, with diameters in the micrometer range (typically 1 μm to 1000 μm), manufactured from natural or synthetic polymers. Microspheres have numerous applications depending on what material they are constructed of and what size they are. Microsphere play numerous applications in biomedical sciences from diagnostic to drug delivery microsphere had reported for chemoembolisation (endovascular therapy), radio imaging topical delivery, vaccine deliveryand delivery of Monoclonal antibodies mediated microspheres targeting.1-10
Nitazoxanide (NTZ) chemically [2-[(5-nitro-1, 3-thiazol-2-yl) carbamoyl] phenyl] acetate, which is a newly approved antiprotozoal drug used in the treatment of cryptosporidiosis in immune comprised patients including those with AIDS or HIV infection7-10.NTZ is rapidly absorbed and converted to active metabolite tizoxanide, which inhibit Pyruvate ferredoxin oxidoreductase pathway. Nitazoxanide appears to have activity against metronidazole (MTZ) resistant protozoal strains and well tolerated.
be due to interference with the pyruvate:ferredoxin oxidoreductase (PFOR) enzyme dependent electron transfer reaction which is essential to anaerobic energy metabolism.15-20 It has also been shown to have activity against influenza A virus. A survey of literature reveals that very few method & solvents were available for the estimation of Nitazoxanide.
MATERIALS AND METHODS
Materials
Nitazoxanide was obtained from Alembic Pharmaceutical Ltd. Vadodara India. Carbopol-934 was obtained from Manish Pharma, Baddi, India. Sodium alginate, ethyl cellulose, calcium chloride, di sodium hydrogen phosphate, and methanol were obtain from S .D. Fine chemicals. All the other chemicals and reagents
were of analytical grade. Drug and polymer were evaluated spectometrically for purity, identity.
Method
In brief weight quantity of sodium alginate (3%) and ethyl cellulose were dissolved separately in distilled water (100mL) and ethanol (5mL). Then solution of ethanol was mixed in previously prepared sodium alginate solution. In separate beaker weight quantity of drug and Corbopol- 934 were dissolved in methanol and added to above solution with continuous stirring. The prepared mixture was dropped into CaCl2 (3% w/v)
solution using 26 G Syringe needle. Microspheres were obtained, filtered, washed with distilled water, air-dried at room temperature and stored in desiccators.20-27
Formulation Design
Table 1: 32 full factorial design, 2-factor, 3-level.
F.code Drug (mg) EC (mg)
(X1)
CP (mg) (X2)
Sodium Alginate %w/v
Crosslinking agent CaCl2
%w/v
F1 30 60 60 3 3
F2 30 30 60 3 3
F3 30 90 60 3 3
F4 30 60 30 3 3
F5 30 30 30 3 3
F6 30 90 30 3 3
F7 30 60 90 3 3
F8 30 30 90 3 3
F9 30 90 90 3 3
Particle size
Particle size of Nitazoxanide microspheres were
measured by optical microscopy. The values obtained were from triplicate experiments and expressed as mean
± standard deviation 28-31.
Microsphere recovery, drug content and entrapment efficiency
Nitazoxanide Microsphere recovery (%) was calculated by weighing lyophilized Microsphere accurately, and using following formula
×100
Drug content study
The drug content of microsphere was determined by spectrophotometrically at 414.4 nm (UV-2201, Systonics). Each determination was made in triplicate.
32-35
Drug content were calculated by using following formula
Drug Content = Conc. × dilution factor × volume/1000
Morphological Examination (SEM)
A texture of surface for prepared microspheres was done by taking Scanning electron photomicrographs. The sample was spread on stub and coated for 120 Swith a layer of gold using a sputter coater. Afterwards, the stub containing the sample was placed in the scanning
electron microscope (ZEISS) chamber at the acceleration voltage of 10 kV, chamber pressure of 0.6 mm Hg. 36-39
X-ray Powder Diffractometry (XRD)
Diffraction patterns of physical mixtures; drug and polymers were recorded with a PW 3040/60 X’ Pert PRO, Netherland. A voltage of 40 KV and a current of 45 mA for the generator were used, with Cu as the tube anode material. The solids were exposed to Cu-Kα radiation (α1=1.54060 Å and α2=1.54439 Å, with a α1/α2 ratio of 0.5), over a range of 2θ angles from 00C
to 600C, at an angular speed of 30 (2θ) per minute.
Differential scanning calorimetry (DSC)
DSC provides information about all physical properties of sample as Crystalline or Amorphous nature and demonstrates the possible interaction between Drug and other Polymers.40
In-vitro mucoadhesion study
hour no of number of microspheres still adhering to tissue was calculated as following.
In-vitro drug distribution study
In-vitro drug distribution study of Nitazoxanide microsphere were calculated spectometrically by using basket dissolution apparatus44-50.
Stability of Mucoadhessive microspheres
Stability studies were performed according to ICH and WHO guidelines. Optimized microspheres were packed in an aluminum foil and kept in petridish at room temperature (37oC) and in Humidity chamber at 40oC, 75% RH for a period of 28 days51-55. At the end of studies, Microspheres were evaluated for physical properties, in- vitro drug release and drug content.
RESULTS AND DISCUSSION
Drug Identification Tests
Melting Point Determination (Capillary Method)
Melting point of the drug was determined using capillary method by the melting point apparatus. Drug was filled in the capillary after sealing the capillary from one end and then the sample was placed in the apparatus along with the thermometer and when the drug melted its temperature is recorded. Melting point of the drug sample was found to be 1980C (Ideal m.p.2020 C).
UV Spectrophotometric Study
The λmax was determined by preparing the 25 ml
Actonitrile & water (9:1) solution of 2µg/ml-10µg/ml and further the sample was scanned at the range of 400-200nm. It was observed that the maximum absorbance was seen at 238.3nm, (using UV2201Pharma Spec Systronics) which was regarded as the λmax of the drug
Nitazoxanide . The λmax of the drug Nitazoxanide in 50
ml Methanol:water (50:50) mixture was found to be 328 nm as & in pH 7.4 phosphate buffer was found to be 414.4 nm.
.
Figure 1: λmax Scan for the drug at 238.3 nm in 25 ml Acetonitrile & water Solution (9:1)
Figure 3: λmax Scan for the drug at 414.4 nm in pH 7.4 phosphate buffer Solution
IR Spectral Analysis
Infrared (IR) spectroscopy was performed using FTIR Spectrophotometer (Shimadzu) the spectrum was recorded in the wavelength region of 4000 to 600 cm−1.
Pellets for the spectra were prepared using KBr hydraulic press, by dispersing a sample of drug in KBr and compressed into discs. The pellet was then placed in the FTIR and the spectrum was obtain and its interpretation is shown below.
Figure 4: IR spectra of pure drug Nitazoxanide
Table 2: Interpretation of IR spectra of pure drug Nitazoxanide
S.No. Functional Group Range (cm-1) Observed Frequency (cm-1)
1 Carbonyl group- ester linkage amide Linkage 1690-1760 1700-1680
1773 1659.7
2 Nitro group 1500-1350 1527.69
Compatibility Studies between the Drug and Polymer
For the drug excipients compatibility studies, the sample were kept at 400C & 75 % RH for 4 weeks, sample withdrawn, carried out and evaluated. For the result of compatibility studies that there was no change
in physical appearance and optimized formulation, no incompatibility in drug alone or with excipients as same peaks were observe. In IR Spectra of physical mixture & optimized formulation are compared to Nitazoxanide drug which shows that there were no interaction between drug and polymer as shown in Figure 5 & Figure 6 .
Figure 5:IR spectra of microspheres of Physical mixture of of Drug Nitazoxanide and Polymer carbopol-934
Figure 6 :IR spectra of microspheres of optimized formulation of Nitazoxanide
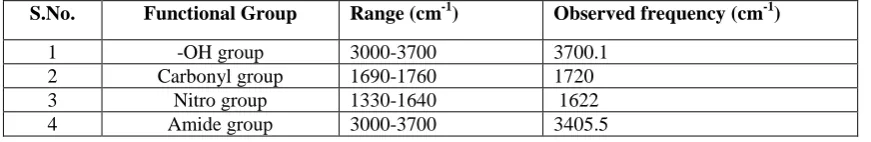
Table 3: Interpretation of IR spectra of Physical mixture of of Drug Nitazoxanide and IR spectra of microspheres of optimized formulation of Nitazoxanide
S.No. Functional Group Range (cm-1) Observed frequency (cm-1)
1 -OH group 3000-3700 3700.1
2 Carbonyl group 1690-1760 1720 3 Nitro group 1330-1640 1622 4 Amide group 3000-3700 3405.5
Evaluation of Microspheres
Micrometric Properties of microspheres
Particle Size Analysis
The optical microscopy method was used to determine the particle size of prepared microspheres, in this
method, the diameter of 100 microspheres was determined and from it the mean diameter was calculated. All readings were taken in triplicate.
Bulk density
The bulk density was found to be 0.320 ±.03 gm/cm3 to 0.450±.03 gm/cm3
Tapped density
The tapped density was found to be 0.358 ±0.01gm/cm3 to 0.520±.02 gm/cm3
Table 4: Characterization of mucoadhesive microspheres of Nitazoxanide
F.Code BulK
Density
Tapped density
%Carr’s index
Hausner’s Ratio
Angle of repose ø= tan-1(h/r)
F1 0.398±0.01 0.422±0.02 5.68±0.10 1.060±0.01 14.06 ± 1.20 F2 0.435±0.02 0.464±0.02 6.25±0.15 1.167±0.01 21.88±0.15 F3 0.411±0.01 0.434±0.02 5.30±0.12 1.056±0.01 12.86±0.14 F4 0.510±0.03 0.546±0.03 6.59±0.09 1.071±0.02 14.25±0.15 F5 0.468±0.02 0.524±0.12 10.68±0.07 1.119±0.03 14.35±0.15 F6 0.407±0.02 0.442±0.13 7.92±0.13 1.086±0.02 15.89±0.19 F7 0.528±0.03 0.563±0.12 6.21±0.12 1.066±0.02 25.32±0.11 F8 0.635±0.03 0.658±0.13 3.49±0.13 1.036±0.09 24.02±0.14 F9 0.571±0.02 0.587±.011 2.73±0.11 1.028±0.01 20.45±0.10
*F5 formulation showed the best flow property and flow of all other formulations were excellent this showed that particles were decreases their crystallinity.
Table 5: Evaluation of mucoadhesive microspheres of Nitazoxanide in 10 hr.
F.Code %Yield
±S.D.
Theoretical drug content (mg)
Actual drug content (mg) ± S.D.
%Drug
entrapment ± S.D.
Average particle size ± S.D.
F1 83.55±1.14 30 22.10±0.71 73.66±1.67 642.65±5.41 F2 80.45 ±2.05 30 21.28±0.74 72.66±2.10 585.45±4.10 F3 87.22±2.01 30 23.15±0.68 77.16±1.96 702.56±5.69 F4 81.61±2.70 30 21.65±0.35 72.16±1.85 642.7±5.13 F5 76.19±1.53 30 20.16±0.25 67.20±1.04 580.75±6.87 F6 85.77±2.93 30 22.69±0.13 75.63±1.25 680.2±6.17 F7 87.09±1.40 30 24.46±0.15 81.53±1.09 648.85±5.51 F8 86.88±1.91 30 22.91±0.08 76.36±1.64 590.62±6.40
F9 90.22±1.51 30 25.65±0.10 85.50±1.54 729.94±10.12
F9 Formulation showed best result due to high % drug entrapment & high % Yield
Because in F9 formulation higher polymer concentration.
SEM
The surface morphology of mucoadhesive microspheres was examined by Scanning electron microscopy (SEM) ,the SEM showed that microspheres obtained from optimized formulation was spherical and smooth surface at two different magnifications (10 µm & 50 µm) as shown in Fig.7.
(A): SEM Photograph (10 μm) of formulation (F9 (B): SEM Photograph (50 μm) of formulation (F9)
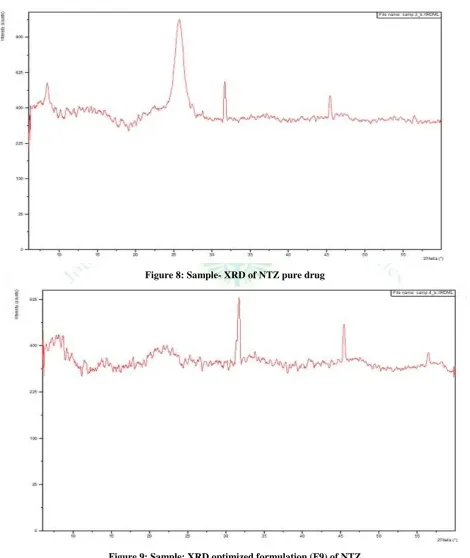
Powder X-Ray Diffraction Study (PXRD) of Drug and Formulation
The presence of several Large peaks in the PXRD of Pure drug Nitazoxanide at a diffraction angle of 6.50º, 25.02º, 31.50º and 46.25º were obtained, but in
Nitazoxanide microspheres formulation small peaks were obtained at diffraction angle 31.53 º, 44.84º&56.85º were obtained revealed that the drug is present as a crystalline form and converted into amorphous form as shown in figure.
Figure 8: Sample- XRD of NTZ pure drug
Figure 9: Sample: XRD optimized formulation (F9) of NTZ
Differential scanning colorimetery (DSC)
DSC provides information about all physical properties of sample as Crystalline or Amorphous nature and demonstrates the possible interaction between Drug and other Polymers. The thermal behavior of Nitazoxanide and physical mixture of drug & polymers are shown in (Figure No. 10 and 11 ), according to thermogram, Nitazoxanide produced sharp Endothermic peak at
Figure 10: DSC Spectra of pure drug Nitazoxanide
Figure 11: DSC Spectra for physical mixture of pure drug Nitazoxanide +Carbopol 934+Ethyl Cellulose
+Sodium Alginate
Mucoadhesion property of optimized formulation of microspheres of Nitazoxanide
The mucoadhesive property of microspheres was evaluated by an in vitroadhesion testing method known as wash-off method in phosphate buffer pH 7.4.
Table 6: % Mucoadhesion of optimized formulation of microspheres of Nitazoxanide
F.code % mucoadhesion
±S.D.
% Cummulative release ±S.D.
F1 84± 1.45 65.81±1.42 F2 90± 1.24 73.31±1.35 F3 70± 1.35 56.81±1.21 F4 85± 1.65 75.18±1.12 F5 45± 1.75 80.06±1.15 F6 78± 1.85 68.44±1.28 F7 90± 1.65 58.31±1.45 F8 93± 1.75 69.94±1.38 F9 95± 1.23 50.25±1.21
Invitro Studies
The prepared microspheres of Nitazoxanide were placed in each of the six basket dissolution apparatus. The assembly was maintained at a temperature of 370C in phosphate buffer, pH 7.4. Samples were withdrawn at definite time intervals and replaced by equal volume of fresh medium. The absorbance of samples was measured from UV spectrophotometer. Concentration and % cumulative release of drug from the formulation was then calculated 56-57.
Dissolution profile revealed that after 10 hr. Formulation F1-F9 released 65.81%, 73.31%, 56.81%, 75.18%, 80.06%, 68.44%, 58.31%, 69.94% and 50.25% drug respectively. The reason behind the lesser drug release of F3, F7, F8 and F9 in comparison to F1, F2, F4, F5, and F6 might be the use of high concentration of Carbopol-934, Ethyl cellulose.
Formulations (F9) showed lesser drug release than (F5) because higher the polymer concentration lower the drug release where as in case of F5 formulation the polymer conc. was less so drug release is higher so F9 Formulation showed best result for sustained release.
Figure 12: In vitro release profile of Microspheres of Nitazoxanide.
Statistical Analysis
Factorial design was used to select the factors displaying the most effects on the microspheres properties. 32 full factorial design, 2-factor, 3-level.The two obtained
Table 7:Two- way ANOVA of Microspheres of Nitazoxanide
Source of Variation SS Df MS F P value Prob.> F
Model 858.76 3 286.25 285.18 0.0128 Significant
A-A 300.31 1 300.31 21.64 0.0288
B-B 729.59 1 729.59 6.43 0.0022
A-B 180.37 1 180.37 6.75 0.0749
Pure error 400.37 9 44.49 17.82
Cor total 1259.13 12 4.05
The Model F-value of 6.43 implies the model is significant. There is only a 1.28% chance that a "Model F-Value" this large could occur due to noise. Values of "Prob > F" less than 0.0500 indicate model terms are significant.
Stability studies
Before storage- Drug Content- 25.65±0.10, % Cummulative release- 50.25±0.12
Table 8: Stability Analysis of Optimized Formulation F9
Date in- 04/04/2014, Storage Condition- 40oC, 75% RH, Packaging- Glass Vials
Sampling interval
One week Two week Three week Four week
Date
Evaluation parameters
10/04/20114 17/04/2014 24/04/2014 01/05/2014
Drug content (mg)
25.09±0.15 24.89±0.11 23.95±0.05 22.98±0.07
%cumulative release
50.02±0.13 49.97± 0.11 48.88 ±0.10 47.99 ±0.12
CONCLUSION
Nitazoxanide loaded Alginate microspheres were successfully prepared by Ionotropic gelation technique. The micromeritic study of microspheres suggests that on formulation of microsphere from pure drug the flow behavior of drug was improved. From the SEM of microspheres it was evident that the microspheres were spherical in shape with smooth surface. The mean particle size of microsphere was found in the range of 580.75µm to 729.94µm. A systemic study using a 32 Factorial design was done. The independent variables had significant influence on dependent variables. Concentration of polymer ratio influence drug release profile & entrapment efficiency of microspheres. As the
polymer concentration increases, % drug release decreases whereas the entrapment efficiency increases. All the formulation followed first order release kinetics. The Formulation F9 showed maximum entrapment
efficiency of 85.50% and 50.25% of control drug release up to 10hr. The microspheres exhibited good mucoadhesive property in the in vitro wash off test and also showed high percentage drug entrapment efficiency. Formulation F9 microspheres were selected
as best formulation for preparation of sustained drug delivery system. The data obtained thus suggest that mucoadhesive microspheres can be successfully designed for sustained delivery of Nitazoxanide and to improve patient compliance.
REFERENCES
1. Adhikari L, Sahu S, Development and validation of
Spectrophotometric and Calorimetric Method for determination of Nitazoxanide Tablet dosage form, Int.jour.of ChemTech Research, 2011; 3:131-135.
2. Bhowmik D, Gopinath H, A Review on Control Release Drug
Delivery System. The Pharma Innovation, 2012; 1:25-26.
3. Betram G, Katzung, Susane BM. Basic Clinical pharmacology.
11th ed. Tata Mc Graw Hill publication; 2010. P. 918.
4. Bhale S, Patankar RD, RP HPLC Development and validation of
Nitazoxanid in Tablet dosage form, International Journal of Pharmacy and Pharmaceutical Sciences, 2011; 3(3):71-73.
5. Kappor D, Patel M, Vyas R, Lad C, Tyagi B. A review on
microsponge drug delivery system. Journal of Drug Delivery and Therapeutics, 2014; 4(5):29-35.
https://doi.org/10.22270/jddt.v4i5.978
6. Deshmukh VN, Jadhav JK, “Formulation, Optimization and
Evaluation of Controlled Release Alginate Microspheres Using Synergy Gum Blends” Research J. Pharm. and Tech, 2009; 2:324-328.
7. Desh P, MM, Soni CS, UV Spectrophotometric estimation of NTZ
in Tablet dosages form, Research journal of pharmacy and technology, 2011; 4:1714.
8. Dhakar RC, Maurya SD, Aggarawal S, Kumar G, Tilak VK,
Design and evaluation of SRM Microspheres of Metformin Hydrochloride, International Journal of Comperhensive Pharmacy 2010; 1(1):1-5.
9. Deshmukh T, Deshmukh V, “Formulation and Evaluation of
10. Dusane A, Rattilal, A Review on Sustained release technology, International journal of research in Ayurveda & pharmacy, 2011; 12:1708.
11. Garg A, Upadhyay P, Mucoadhesive microspheres review, Asian
Journal of Pharmaceutical and Clinical Research, 2012; 5:24-27.
12. Hardenia SS, Jain A, “Formulation and Evaluation of
Mucoadhesive Microspheres of Ciprofloxacin, Journal of Advanced Pharmacy Education & Research, 2011; 1(4):214-224.
13. Jadhav V, Gandhi SV, RP-HPLC Determination of Nitazoxanide
in Bulk and Different Tablet Formulations, Eurasian Journal of Analytical Chemistry, 2008; 3:318-323.
14. Jenifer LH, A Review: Current approaches to treatment of
gastrointestinal infection Focus NTZ, 2009, 263-275.
15. Khan S, Tiwari T, A Review On Microspheres. World Journal of
Pharmacy and Pharmaceutical Sciences, 2012; 1:126-130.
16. Kataria S,Middha A, A Review On Microsphere. International
Journal of Research in Pharmacy & Chemistry, 2011; 1:1186-1193.
17. Kumar S, Singh J, Design and Characterization of Amoxicillin
trihydrate Mucoadhesive Microspheres for Prolonged Gastric retention, International Journal of Pharmaceutical Sciences and Drug Research, 2010; 2(2):112-114.
18. Keerthi TS, Kumar S, “Formulation and evaluation of
microspheres of Losartan Potassium using biodegradable natural polymers” International Bulletin of Drug Research, 2012; 1(2):120-131.
19. Kapoor D, Patel R, “Formulation, Optimization and Evaluation of
Floating Microspheres of Captopril” Asian Journal of biomedical &Pharmaceutical Sciences, 2012; 2(9):1-10.
20. Rastogi V, Shukla S, Singh R, Lal N, Yadav P. Microspheres: a
promising drug carrier. Journal of Drug Delivery and Therapeutics, 2016; 6(3):18-26.
https://doi.org/10.22270/jddt.v6i3.1196
21. Kumar S, Senthil S, Kumar A, Evaluation of Clobazam loaded
ionically cross-linked microspheres using Chitosan, Available online at www.pelagiaresearchlibrary.com, 2012; 3(6):616-623.
22. Kumar S, Kumar A, “Formulation and Evaluation of Colon
Targeted Drug Delivery of an Anti-Amoebic Drug” International Journal of Pharmaceutical Innovations, 2012; 2(2):138-143.
23. Lachman L, Lieberman HA, Kanig JL. The theory and practice of
industrial pharmacy. 3rd ed. Mumbai: Verghese Publishing House;
1991. P. 254 -255.
24. Josephine J, Mehul RT, “Formulation and In Vitro Evaluation of
Floating Microspheres of Anti-Retro Viral Drug as a Gastro retentive Dosage” International Journal of Research in Pharmacy Chemistry, 2011; 1(3):2231-2781.
25. Ahmed MG, Dr. Nagesh, Design of minocycline Hydrochloride
Microspheres Loacal delivery in Treatment of Periodontitis, International Journal of Advance Pharmaceutical and Biological Sciences, 2012; 2(4):245-249.
26. Faizi M, Venkatesh MN, “Formulation and Evaluation of
Mucoadhesive Microspheres of Amoxicillin Trihydrate by using Eudragit RS 100” International Journal of Chem Tech Research, 2010; 2:466-470.
27. Agarwal D, Ranawat M, Chauhan C, Kamble R. Formulation and
charecterisation of colon targeted ph dependent microspheres of capecitabine for colorectal cancer. Journal of Drug Delivery and Therapeutics, 2014; 3(6):215-222.
https://doi.org/10.22270/jddt.v3i6.747
28. Mehta D, Seth AK, “HPLC Method for Simultaneous estimation
of Nitazoxanide in its Tablet dosage form” An International Journal of pharmaceutical Sciences, 2011; 2(4):1-12
29. Khanam N, Sachan AK, Fabrication and evaluation of Propranolol
hudrochloride loaded microspheres by Ionic-gelation technique, At www.scholers research library, 2012; 4:815-820.
30. Ali NW, Abbas SS, Validation Stability indicating methods for
determination of Nitazoxanide in presence of its degradation products, Journal of pharmaceutical analysis, 2012; 2:105-116.
31. Pavanveena, Chintagunta, Kavitha K, “Formulation and
evaluation of Trimetazidine Hydrochloride loaded chitosan microspheres” International Journal of Applied Pharmaceutics, 2010; 2(2):11-15.
32. Parashar V, Ahmad D, “Formulation and evaluation of
biodegradable microspheres of tinidazole” International Journal of Drug Deliver, 2010; 2:238-241.
33. Senthil PS, Sandu NR, Loganathan S, Formulation and evaluation
of Microspheres Containing Imatinib Mesylate using Sodium
Alginate By Chemical Crosslinking Method, Journal of Drug Delivery and Therapeutics, 2012; 2(6):37-40.
https://doi.org/10.22270/jddt.v2i6.339
34. Pundir S, Badola A, A Review on Sustained Release matrix Tech.
& Recent Advances in matrix drug delivery system, Inter. Jour. of Res. and Tech, 2013; 3:12-13.
35. Patel B, Modi V, Preparation and evaluation of ethyl Cellulose
Microspheres Prepared by emulsification-Solvent evaporation method, International Journal for Research in Management and Pharmacy (IJRMP), 2012; 1(1):82-92.
36. Patel RJ, Singh BH, RP HPLC Method for estimation of
nitazoxanide in oral suspension formulation, Der Pharma Chemica, 2012; 4(3):1140-1144.
37. Venkatesh PD, Karki R, “Formulation and Evaluation of
Microspheres Containing Fluvastatin Sodium” International Journal of Drug Development & Research, 2012; 4(2).
38. Gupta M, Khunteta A. Optimization of the release kinetics of
diltiazem hydrochloride from tableted microspheres. Journal of Drug Delivery and Therapeutics, 2018; 8(1):57-63.
https://doi.org/10.22270/jddt.v8i1.1551
39. Rajput S, Agrawal P, A Review on microspheres: methods of
preparations and evaluation, World Journal 0f Pharmacy and Pharmaceutical Sciences, 2012; 1:422-438.
40. Rowe CR, Sheskey P. A Hand Book of Pharmaceutical
Excipients, 6th ed. Php Pharmaceutical Press; 2010. P .450-858.
41. Massa-Reddy RS, Bolmad VB, Metformin HCl loaded
Sod.Alginate Floating Microspheres, Indian Journal of Novel Drug Delivery, 2011, 126-143.
42. Reddy VV, Swaroop AP, Preparation and In-Vitro Evaluation of
Lansoprzole mucoadhessive microspheres, An International Journal of Advances in Pharmaceutical Sciences, 2011, 2.
43. Sharifa S, Ahammad T, RP-HPLC Method development and
Validation for Nitazoxanide in Powder for suspension dosage form, International Journal of Pharmaceutical Science and Research, 2013; 4(1):301-305.
44. Dehghan S, Aboofazeli R, “Formulation optimization of
Nifedipine containing microspheres using factorial design” Affrican journal of pharmacy and pharmacology, 2010; 4:346-354.
45. Murathoti K.S., Saxena T. Development of mucoadhesive
microspheres of levofloxacin for the treatment of H. pylori infection. Journal of Drug Delivery and Therapeutics, 2016; 6(1):34-45. https://doi.org/10.22270/jddt.v6i1.1179
46. Singh A, Sharma R, A Review Article on Sustained release drug
delivery system, Int. Res. Journal of Pharmacy, 2012, 3, 22-23.
47. Steve, Bhaskara RD. Standard Hand Book of Biomedical
Engineering & Design. 3rd ed. P. 223-224.
48. Senthil A, Thakkar HR, “Formulation and Evaluation of
Mucoadhessive Glipizide Microspheres using Carboxy methyl Cellulose” International Journal of Preclinical and Pharmaceutical Research, 2011; 2(1):45-51.
49. Vyas SP, Khar RK. Targated and Control drug delivery. 4th ed.
C.B.S. Publications; 2008. P. 418-454.
50. Steve-1, Bhaskara R. A Standard Hand Book of Biomedical
engineering. P. 223-224.
51. Sagostarch SA, Journal of Biosciences and Bioengineering, 2002;
94(6):526-529.
52. Kumar TU, Kumar N, Design and evaluation of aceclofenac
microspheres by solvent Evaporation technique, International Journal of Pharmaceutical Sciences Letters, 2013; 3(1):170-172.
53. Jilakara VS, Design and characterization of mucoadhesive
microspheres loaded with Metronidazole for colon specific delivery, Current pharma research, 2013; 3:901-910.
54. Prasanth VV, Rawat S, “Formulation and Evaluation of Floating
Microspheres of Captopril” International Journal of Research Article Pharmaceutical Innovations, 2013; 3(2):41-52.
55. Wadke DA,Serajuddin A, Jacobson H, Preformulation testing. In:
Lieberman HA, Lachman L, Schwartz JB, eds. Pharmaceutical Dosage Forms: Tablets. New York: Marcel Dekker: 1989, 1-73.
56. Yadav A, Kumar JD, “Formulation and evaluation of
mucoadhesive microspheres of propranolol hydrochloride for sustained drug delivery” Asian Journal of Pharmacy and Medical Science, 2011; 1 (1):1-8.
57. Zhang Y, Wei W, Preparation and evaluation of Alginate–chitosan