e-ISSN: 2278-7461, p-ISSN: 2319-6491
Volume 8, Issue 1 [January 2019] PP: 57-62
Recyclable Solid Waste Materials Management in Erbil
City-Iraq
Shuokr Qarani Aziz
1, Srwa Othman Ismail
1, Imad Ali Omar
1,2 *1 Department of Civil Engineering, College of Engineering, Salahaddin University-Erbil, Iraq; 2 Ministry of Municipality and tourism, General Directorate of Water and Sewerage-Erbil, Iraq
Corresponding Author: Imad Ali Omar
ABSTRACT: This paper presents a study on recyclable solid waste materials in Erbil City-Iraq. The data collected from Directorate of Services and Environmental Protection. Collected samples were tabulated and separated to their components: plastic, corrugated & paper, glass, aluminum, and ferrous. In addition, the percentage ratios of recyclable materials were determined for the collected samples. The amount of daily residential solid waste generation in Erbil City was found to be about 1.27 kg/capita for the population of 1,118,187. Average percentage ratios of recyclable materials such as plastic, corrugated & paper, glass, aluminum, and ferrous were 34.87%, 13.39%, 1.84%, 0.5%, and 1.74%, respectively. It is also found that food (organic) waste is the major non-recyclable component (> 50 %) followed by mix plastics and mix paper as recyclable materials. In 2016, the predicted income from the recyclable solid waste in Erbil City was334,488.85 $/day. Along with estimated population growth and their business activities, it has been observed that the city is still lacking in terms of efficient waste treatment technology, sufficient fund, public awareness, maintaining the established norms of industrial waste treatment etc.
KEYWORDS:Municipal solid waste; recyclable materials; economic; Erbil City.
--- ---Date of Submission: 28-03-2019 ---Date of acceptance:08-04-2019 --- ---
I.
INTRODUCTION
Due to economic development and increasing population, problems related to the expanded consumption and depletion of resources and the increased output of wide-ranging types of waste are becoming more serious than ever. Clearly, the way to limit the impact on the environment is by reducing the amount of waste that is generated. Failing this, waste must be either be recycled. Recycling is the best approach to address the issue since it reduces the waste to be directly disposed of in a landfill (Connet and Sheehan, 2001). Additionally, recycling has the potential to reduce disposal costs, waste transport costs and to prolong the lifespan of landfills site (Folz, 1991; Bolaane, 2006). Studies have shown can create a new product from the source materials that indirectly benefit the environment and the economy (Akil et al., 2015). However, the success of the recycling program is depending on the active public participation in the separation of recyclable waste (Akil et al., 2015).For this purpose of this analysis, recycling is defined as the recovery of useful materials such as: paper, glass, plastic, metals, and construction and demolition materials. There are numerous studies related to recycling behavior. In Erbil City, an author studied quality and quantity of household solid waste contents (Shekha, 2011). Recycling of waste engine oils by using a new washing agent (Hamawand, 2013). In the developed country most studies on waste recycling focused on technical applications such as models and tools (Akil et al., 2015). They also involved policy analysis and to measures to improve recycling practices. Turan et al. (2009) presented a brief history of the legislative trends in Turkey for municipal solid waste management (MSWM) and present situation of generation, composition, recycling, and treatment. A study by Wilson et al. (2009) highlighted the role of the informal sector in waste minimization through recycling.
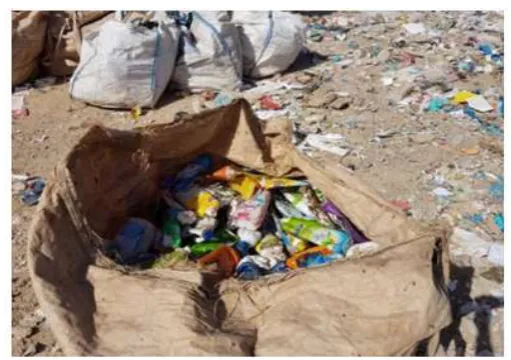
and3. A small fraction of recyclable materials, such as plastic, glass, and metals, are separated by scavengers on-site (Aziz and Maulood, 2015).
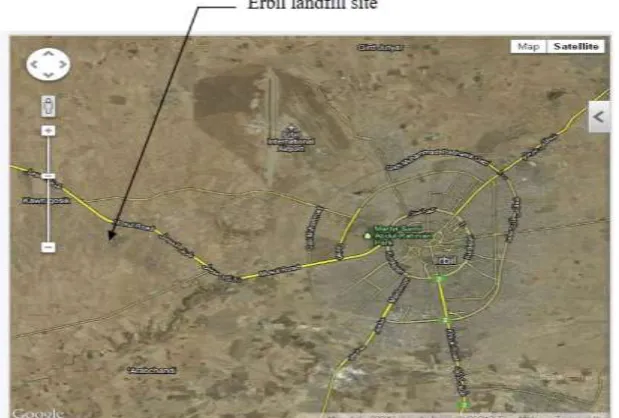
Figure 1. Satellite image of Erbil landfill site at center.
Figure 3. Recyclable materials from landfill site.
2-2 Types of Solid waste
The common materials of solid waste can be classified in several different ways. The point of origin is important in some cases, so classifications as domestic, institutional, commercial, industrial, street, demolition, or construction may be useful. The nature of the material may be important, so classification may be made on the basis of organic, inorganic, combustible, noncombustible, putrescible, and non-putrescible fractions. But one of the most useful classification is based on types of materials such as rubbish, ashes, street, refuse, dead animals, abandoned vehicles, industrial wastes, demolition wastes, construction generated solid wastes, special wastes, and sewage treatment residue (Davis and Cornwell, 2008).In this study, the classification of the nature of the materials has been depended.
2-3 Percentage Ratio of Recyclable Materials
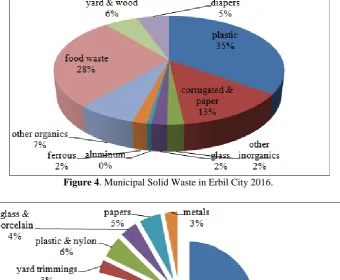
Percentage ratio of recyclable materials in Erbil city was collected in 2016 from Director of Service and-Environment Protection. For example: plastic, glass, aluminum, ferrous, corrugated & paper; the percentage ratios calculated as follows: Total weight of municipal solid waste in Erbil city for example = 1559460 kg/day
Plastic % = (543783.702*100)/1559460 = 34.87 % Glass % = (28694.064*100)/1559460 = 1.84 % Aluminum %= (7797.3*100)/1559460 = 0.50 % Ferrous %= (27134.604*100)/1559460 = 1.74 %
Corrugated & paper % = (208811.694*100)/1559460 = 13.39 %
These materials can be used as raw materials for manufacturers.
The average percentage ratio of the recyclable materials = 34.87+1.84+0.50+1.74+13.39 = 52.34 % Generation rate of recyclable materials = 0.5234*1.27*1000 = 664.718 g/cap/day. Average daily recyclable materials from solid waste in Erbil city = 664.718*1118187/10^6 = 743.3 tons/day (Ojeda-Benitez et al., 2000).
III.
RESULTS AND DISCUSSIONS
Due to increase in population MSW increased in Erbil city, and population in this place approximately about 1118187, and waste generation of 1.27 kg/capita/day. Manycompanies in Erbil city collect the MSW such as Glass Stuttgart, Qadar, BaghiPrgul, Artush, Zug, Nrkh, Halmat, Governmental Trucks, and Private SectorTrucks. Average daily collected of MSW for all companies are 1559.460 tones. The variation is due to different consumer style, per capita waste production, and population composition,
Figure 4. Municipal Solid Waste in Erbil City 2016.
Figure5. Percentage for different solid waste component of Erbil city in 2009.
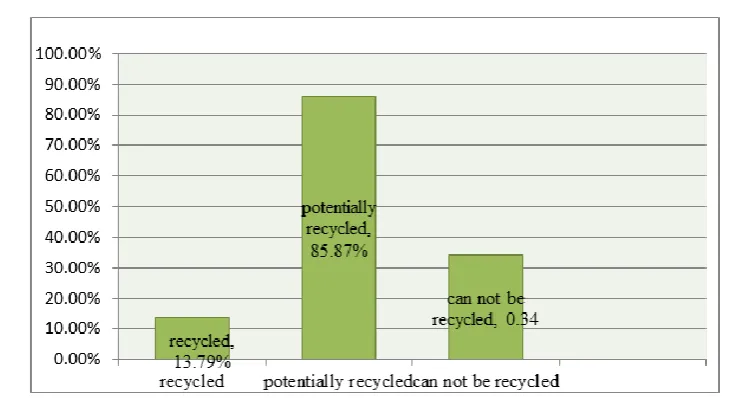
Figure 6. Recyclable, potentially recyclable and non-recyclable refuse as percentage of total refuse.
As the average weights present an unbiased result for the mean by minimizing the sampling error (Bolaane and Ali, 2004). In order to forecast the quantity of waste generation using per capita figure and population number, the simple equation below was used (Gardner, 1988):
Qd=pi Cd
Where Qd is the daily quantity of waste production; Cd is the daily per capita waste generation, and Pi is the population number for a certain year i.
Shekha (2011) provides the average national population growth rate of 3.03% for Iraq, it has been estimated that Erbil city dwellers will reach 939517 inhabitants in 2009. As shown in the Tab. 1, it is estimated that the daily waste production in 2009 will be 400 tones, while the production per month and year expected to reach 12002 and 144028 ton respectively.
Table 1. Expected daily solid waste generation (kg) for Erbil city in the year 2009. Waste component Cd Qd = (Pi Cd)
Food scraps 0.2867 320.42
Yard trimmings 0.0126 14.1914
Plastic & nylon 0.0144 20.05284
Glass & porcelain 0.01223 16.22228
Papers 0.02262 22.00004
Metals 0.01197 11.8848
Rubber 0.00006 0.048852
Textile & leather 0.00695 7.81484
Inert 0.00110 1.39606
Miscellaneous waste 0.00646 6.49924
Kg/capita/day 0.420 Kg/capita/year 153.3 Tones/city/month 120,02.33 Tones/city/year 144,027.95
Recyclable materials more useful if we made them to money by selling them for example if tone of recyclable materials Tab. 2, such as plastics are about (300-600) $/ton, and weight of plastic are 543.784 ton/day, 543.784ton*500$ = 271,891.851 $/day it is more useful for developing in economic.
Table 2. Weight and price of recyclable materials in Erbil City Recyclable
materials (R.M)
Weight of (R.M) Tone/day
Price of (R.M) $/tone
Weight*price $/day
Plastic 543.784 500 271,892
Glass 28.7 75 2152.1
Aluminum 7.8 1700 13,255.41
Ferrous 27.135 200 5427
Corrugated and
paper 208.8 200 41,762.34
from the disposed MSW.
REFERENCES
[1]. AFON, A. O. & OKEWOLE, A. 2007. Estimating the quantity of solid waste generation in Oyo, Nigeria. Waste management & research, 25, 371-379.
[2]. AGAMUTHU, P. 2001. Solid waste: Principles and management: with Malaysian case studies, Insitute of Biological Sciences, University of Malaya.
[3]. Akil, A. M., et al. (2015). The effects of socio-economic influences on households recycling behavior in Iskandar Malaysia. Procedia-Social and Behavioral Sciences 202: 124-134.
[4]. AZIZ, S. Q. & MAULOOD, Y. I. 2015. Contamination valuation of soil and groundwater source at anaerobic municipal solid waste landfill site. Environmental monitoring and assessment, 187, 755.
[5]. AZIZ, S. Q., OMAR, I. A. & MUSTAFA, J. S. 2018. Design And Study For Composting Process Site. International Journal of Engineering Inventions 7, 09-18.
[6]. BOLAANE, B. & ALI, M. 2004. Sampling household waste at source: lessons learnt in Gaborone. Waste management & research, 22, 142-148.
[7]. Bolaane, B. (2006). Constraints to promoting people centered approach in recycling. Habitat International, 30(4),731-740. [8]. Che Mamat, R. and T. Chong (2007). Public’s Role in Solid Waste Management: In IMPAK, quarterly DOE update on
environment, development and sustainability. Issue (4): 5-7.
[9]. Connett, p., & Sheehan, B. (2001). A citizen's agenda for zero waste. Grassroots Recycling Network. [10]. Davis, M. L., & Cornwell, D. A. (2008). Introduction to environmental engineering: McGraw-Hill Companies. [11]. Directorate, E. S. (2009). Erbil governorate population according to food card. Archive.
[12]. Directorate, E. S. (2016). Erbil governorate population according to food card. Archive.
[13]. Donnini Mancini, S., Rodrigues Nogueira, A., Akira Kagohara, D., Saide Schwartzman, J. A., & de Mattos, T. (2007). Recycling potential of urban solid waste destined for sanitary landfills: the case of Indaiatuba, SP, Brazil. Waste Management & Research, 25(6), 517-523.
[14]. FERNANDEZ, A. 1996. Introduction in UNCRD, Recycling in Asia: Partnerships for Responsive Solid Waste Management. UNCRD Research Report.
[15]. Folz, D. H. (1991). Recycling program design, management, and participation: a national survey of municipal experience. Public Administration Review, 222-231.
[16]. GARDNER, H. S. 1988. Comparative economic system, Dryden Press.
[17]. Hamawand, I., T. Yusaf and S. Rafat (2013). Recycling of waste engine oils using a new washing agent. Energies 6(2): 1023-1049.
[18]. Mancini, S.D., Nogueiria, A.R.; Kagohara, D.A.; Schwartzman, J.A.S and Mattos, T. (2007). Recycling potential of urban solid waste destined for sanitary landfills: the case of Indaiatuba, SP, Brazil. Waste Management & Research 25(6): 517-523 [19]. OJEDA-BENITEZ, S., DE VEGA, C. A. & RAMÍREZ-BARRETO, M. E. 2000. The potential for recycling household waste:
a case study from Mexicali, Mexico. Environment and Urbanization, 12, 163-173.
[20]. Saeed, M. O., Hassan, M. N., & Abdul Mujeebu, M. (2009). Development of Municipal Solid Waste Generation and Recyclable Components Rate of Kuala Lumpur: Perspective Study.
[21]. Shekha, Y. A. (2011). Household Solid Waste Content in Erbil City, Iraq Kurdistan Region, Iraq. Zanco Journal of Pure and Applied Science 23(3): 1-8.
[22]. Skourides, I., and Smith, S. R. (2008). Sources and factors controlling the disposal of biodegradable municipal solid waste in urban and rural areas of Cyprus. Waste Management & Research 26(2): 188-195.
[23]. Turan, N. G., S. Çoruh, A. Akdemir and O. N. Ergun (2009). Municipal solid waste management strategies in Turkey. Waste Management 29(1): 465-469.
[24]. Wilson, D. C., A. O. Araba, K. Chinwah and C. R. Cheeseman (2009). Building recycling rates through the informal sector. Waste management 29(2): 629-635.