Abstract— Digital filter plays an important role in today’s world of communication and computation. On the other hand to design a digital finite impulse response (FIR) filter satisfying all the required conditions is a challenging one. In this paper, design techniques of low pass FIR filters using Blackman window method, Frequency sampling method and Optimal method are presented. The magnitude responses are demonstrated for the different design techniques of digital FIR filters and those are compared with ideal response curves. In this paper, we have introduced an iterative method to find the optimal solution of optimal FIR filter design. It is shown that in optimal FIR filter design the passband and stopband ripples of response curve depend on the width of transition band. Further, Remez exchange algorithm is applied on optimal method to analyze the response of FIR filters. This shows that the degree of flatness in passband and stop band depend on the weighting factor and width of the transition band. Filter design by using Blackman window and frequency sampling technique, the degree of flatness varies with the length of filter.
Index Term— Blackman window, FIR filter, Optimal method, Rectangular window, Remez exchange algorithm
I. INTRODUCTION
In general case filter is applied to illustrate a device that distinguishes, according to some attribute of the objects applied at its input. For frequency domain concept this is used to pass the frequencies of passband and attenuates all other frequencies out side the passband. So the properties of the filtering depend on the frequency response functionH(), which settles on the choice of system parameters. Indeed FIR filters are used to design a filter where there is a requirement for a linear phase characteristic within the pass band of that filter. The performance of different methods depends on the similarities of its frequency response with the desired frequency response. To follow this philosophy, there are three
S. M. Shamsul Alam
Electronics and Communication Engineering Discipline, Khulna University, Khulna-9208, Bangladesh. Phone:+8801712163906; e-mail: [email protected]
Md. Tariq Hasan
Electronics and Communication Engineering Discipline, Khulna University, Khulna-9208, Bangladesh. Phone:+8801914066244; e-mail: [email protected]
techniques to design FIR filters. In this paper, the spectral responses of those methods are analyzed.
Since this is FIR system so it has an impulse response of finite duration length, N. The general equation of frequency
response function H (ω) for odd number of N [1] is given by
Now comparing Eq. (1) with the polar representation of
H , the magnitude is
H1
H
where H1
is a real quantity given by
n N n h N h H N n 2 1 cos 2 21 3/2
0
1 (2)
The magnitude of H (ω) has been analyzed for different design techniques by taking equal filter parameters.
II. ANALYTICAL DESIGN OF OPTIMAL FIRFILTER To design a low pass filter, the desired frequency response is given by
(3)
For this system, consider N = 51, S = 1 rad/s and the
corresponding frequency response, determined by from Eq. (2)
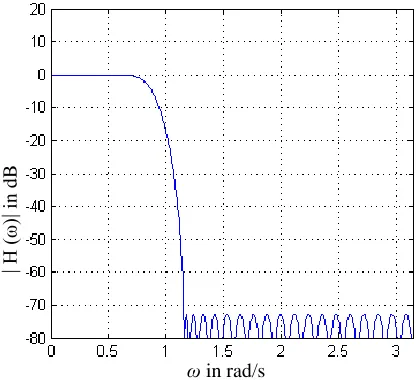
(4) There are various methods to determine the filter coefficients. Among these, the most widely used method is that of McClellan, Parks and Rabiner [2]. Their program is capable of designing optimal FIR filters including low-pass; high-pass, band-pass and band reject filters. We wish to design a low pass linear phase FIR frequency response H1() such that it has very flat passbands and low stopbands ripples. Also assume that the response has very sharp attenuation slop. To determine the filter coefficients of Eq. (4), it is required to sample the desired frequency response of Eq. (3) considering non uniform frequency spacing and put the values of those samples into Eq. (4). The values of filter impulse response coefficients, h(n) are cited in the Table 1. From these values the desired equation of |H(ω)|, that is H1(ω) is found in terms of impulse response, h(n) and from this we can get the Fig. 1 and Fig. 2 which show flat, that is ripple less passband and
Performance Analysis of FIR Filter Design by
Using Optimal, Blackman Window and
Frequency Sampling Methods
S. M. Shamsul Alam , Md. Tariq Hasan
Electronics and Communication Engineering (ECE) Discipline, Khulna University Khulna 9208, Bangladesh.
E-mail: [email protected] , [email protected]
) 1 ( 2 1 cos ) ( 2 2 1 ) ( 2 / ) 3 ( 0 2 / ) 1 (
N n N j n N n h N h eH
s d H 0 0 1 p
h
h
n
n
Hn
cos 25
2 25
24
0
there are ripples in the stopband which are gradually decreasing.
TABLE I
OPTIMAL FIR LOWPASS FILTER FILTER LENGTH =51 Impulse Response h(0) -0.0053 h(50) h(1) 0.0081 h(49) h(2) 0.0070 h(48) h(3) -0.0121 h(47) h(4) -0.0068 h(46) h(5) 0.0035 h(45) h(6) 0.0107 h(44) h(7) 0.0064 h(43) h(8) -0.0061 h(42) h(9) -0.0137 h(41) h(10) -0.0067 h(40) h(11) 0.0099 h(39) h(12) 0.0186 h(38) h(13) 0.0073 h(37) h(14) -0.0158 h(36) h(15) -0.0263 h(35) h(16) -0.0080 h(34) h(17) 0.0260 h(33) h(18) 0.0398 h(32) h(19) 0.0086 h(31) h(20) -0.0479 h(30) h(21) -0.0711 h(29) h(22) -0.0090 h(28) h(23) 0.1321 h(27) h(24) 0.2797 h(26) h(25) 0.3425 h(25)
Fig. 1. Frequency response of an optimal FIR lowpass filter.
Fig. 2. Optimal FIR filter response.
III. ANALYTICAL DESIGN OF LINEAR PHASE FIRFILTER USING BLACKMAN WINDOW
Here we begin to determine the impulse response hd(n) [1]
from the desired frequency responseHd(). The impulse response sequence is obtained from
(5)
where 25
2 1 N
The Blackman window [1] is defined by
(6) for 0nN1.
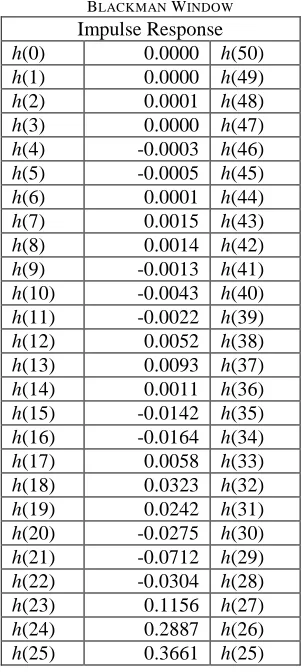
The values of filter impulse response coefficients, h(n) for Blackman window are following:
TABLE II
LOWPASS FILTER (BLACKMAN WINDOW) FILTER LENGTH =51 BLACKMAN WINDOW Impulse Response
h(0) 0.0000 h(50)
h(1) 0.0000 h(49)
h(2) 0.0001 h(48)
h(3) 0.0000 h(47)
h(4) -0.0003 h(46) h(5) -0.0005 h(45)
h(6) 0.0001 h(44)
h(7) 0.0015 h(43)
h(8) 0.0014 h(42)
h(9) -0.0013 h(41) h(10) -0.0043 h(40) h(11) -0.0022 h(39) h(12) 0.0052 h(38) h(13) 0.0093 h(37) h(14) 0.0011 h(36) h(15) -0.0142 h(35) h(16) -0.0164 h(34) h(17) 0.0058 h(33) h(18) 0.0323 h(32) h(19) 0.0242 h(31) h(20) -0.0275 h(30) h(21) -0.0712 h(29) h(22) -0.0304 h(28) h(23) 0.1156 h(27) h(24) 0.2887 h(26) h(25) 0.3661 h(25)
|
H(
)
|
in rad/s
|
H
(ω
)
|
in
d
B
ω in rad/s
n n n
n n
h c
d
sin
c
1 4 cos 08 . 0 1 2 cos 5 . 0 42 . 0
N n N
n n
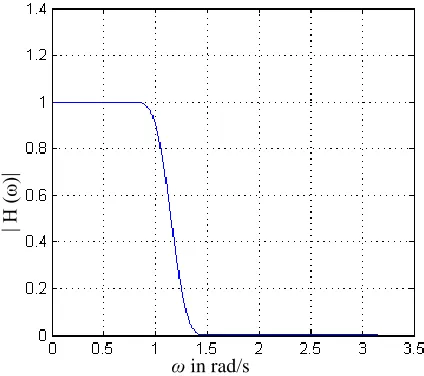
Fig. 3. Frequency response of FIR lowpass filter using Blackman window.
Fig. 4. Frequency response of FIR lowpass filter using Blackman window. The frequency responses of Blackman window are shown in Fig. 3 and Fig. 4. From the fig. it is clear that passband is flat
and there are ripples in the stopband, which are gradually decreasing.
IV. ANALYTICAL DESIGN OF LINEAR PHASE FIRFILTER USING FREQUENCY-SAMPLING METHOD
A set of samples is determined from a desired frequency response and is identified as discrete Fourier transform (DFT) coefficients. The filter coefficients are then determined as the inverse discrete Fourier transform (IDFT) [3] of this set of samples. For this design technique, the frequency samples are chosen to be
N k
k
2 k = 0, 1, 2, …………, N-1
Sampling the desired frequency response we get
(7)
and finally the impulse response, h(n) is obtained [3] by taking IDFT of Eq. (7).
2 / 1
1 2
1 2
cos 2
0
1 N
k
n N
k k
G G
N n
h
where
N k H k
G 1k 2 k = 0, 1, ……… 2
1 N
The coefficients of impulse response,h
n for frequency sampling technique are listed in Table 3.TABLE III
LOWPASS FILTER (FREQUENCY SAMPLING METHOD) FILTER LENGTH =51
Impulse Response
h(0) -0.0030 h(50)
h(1) 0.0022 h(49)
h(2) 0.0048 h(48)
h(3) 0.0000 h(47)
h(4) -0.0064 h(46)
h(5) -0.0051 h(45)
h(6) 0.0043 h(44)
h(7) 0.0105 h(43)
h(8) 0.0039 h(42)
h(9) -0.0099 h(41)
h(10) -0.0142 h(40) h(11) -0.0008 h(39)
h(12) 0.0172 h(38)
h(13) 0.0174 h(37)
h(14) -0.0051 h(36) h(15) -0.0272 h(35) h(16) -0.0200 h(34)
h(17) 0.0159 h(33)
h(18) 0.0428 h(32)
h(19) 0.0219 h(31)
h(20) -0.0386 h(30) h(21) -0.0761 h(29) h(22) -0.0231 h(28)
h(23) 0.1240 h(27)
h(24) 0.2863 h(26)
h(25) 0.3569 h(25)
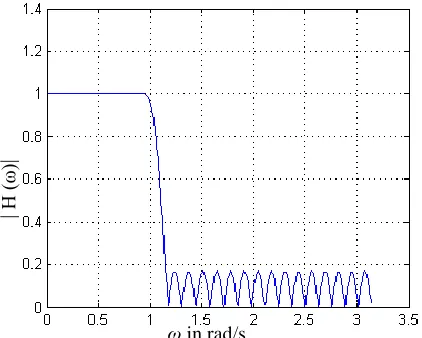
The frequency responses of the low pass FIR filter designed using frequency sampling method are shown in Fig. 5 and Fig. 6. From the fig. it is clear that there are some ripples at the edge of passband and the in the stopband are gradually decreasing as the increase of frequency of input signal increases. Here transition is quite narrow. It is important that the choice of sample points in this method plays a very significant role. So choosing appropriate number of samples and samples positions, one can design the desired FIR filter.
Fig. 5. Data for FIR lowpass filter using frequency sampling method.
|
H
(ω
)
|
ω in rad/s
|
H
(ω
)
|
in
d
B
ω in rad/s
N
kn Nn
e n h k
H 2 /
1
0
|
H
(ω
)|
Fig. 6. Frequency response of FIR lowpass filter using frequency sampling method.
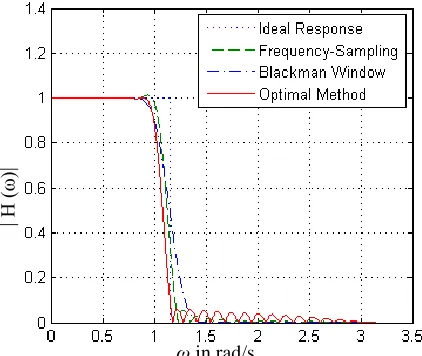
V. SIMULATION RESULT AND PERFORMANCE EVALUATION The magnitude responses of different design techniques are illustrated in Fig. 7 and Fig. 8. Optimal method shows the superior passband performance but in this method, there are relatively large oscillations or ripples near the cutoff frequency. It decreases with increase in the frequency of the input signal. While the Blackman window gives much better stopband attenuation but the Blackman window response shows poor performance in the transition band. So to achieve a given transition band performance (narrow transition band) with a Blackman window, a much higher filter order is needed than optimal method. These points are demonstrated clearly in Fig. 7. On the other hand, filters with arbitrary amplitude and phase response can be designed by frequency sampling method. The frequency sampling method shows sharp transition band than window response. It lacks precise control of the band edge frequencies or the passband ripples and relies on the availability of the design [5].
Fig. 7. Comparison of frequency responses of FIR lowpass filters.
Fig. 8. Comparison of frequency responses of FIR lowpass filters.
Fig. 9. Frequency response of FIR lowpass filter using optimal method and Remez Exchange Algorithm (when stop band and stop band have the same
weight).
The Remez exchange algorithm is used to find the frequency response of FIR lowpass filter using optimal method.
Fig. 10. Frequency response of FIR lowpass filter using optimal method and Remez Exchange Algorithm (when stop band and stop band have the same
weight).
|
H
(ω
)
|
in
d
B
ω in rad/s
|
H
(ω
)
|
ω in rad/s
|
H
(ω
)
|
in
d
B
ω in rad/s
|
H
(ω
)
|
ω in rad/s
|
H
(ω
)
|
in
d
B
Fig. 11. Frequency response of FIR lowpass filter using optimal method and Remez Exchange Algorithm (when pass band has more weight than stop band
).
Fig. 12. Frequency response of FIR lowpass filter using optimal method and Remez Exchange Algorithm (when pass band has more weight than stop
band).
Fig. 13. Frequency response of FIR lowpass filter using optimal method and Remez Exchange Algorithm (when stop band has more weight than pass
band).
Fig. 14. Frequency response of FIR lowpass filter using optimal method and Remez Exchange Algorithm (when stop band has more weight than pass
band).
If Remez exchange algorithm is applied in optimal method, frequency response becomes somewhat different. The magnitude response is illustrated in Fig. 9 and Fig. 10 using the same weight in passband and stopband. It introduces ripples in the passband as well as stopband.
If the weight of passband is more than that of stopband, response of the passband becomes flat or ripple less but the ripples in the stopband become larger, which are shown in Fig. 11. Exactly opposite response is found if the weight of stopband is more than that of the passband, which is shown in Fig. 13 and Fig. 14.
If the weight of passband and stopband is same and the transition bandwidth is increased then almost flat passband and stopband response is found, which is shown in Fig. 15. But this broadens the transition band, which reduces the ideal properties of a filter.
Fig. 15. Frequency response of FIR lowpass filter using optimal method and Remez Exchange Algorithm (when pass band and stop have same weight but
transition band is more).
|
H
(ω
)
|
ω in rad/s
|
H
(ω
)
|
in
d
B
ω in rad/s
|
H
(ω
)
|
ω in rad/s
|
H
(ω
)
|
in
d
B
ω in rad/s
|
H
(ω
)
|
Fig. 16. Frequency response of FIR lowpass filter using optimal method and Remez Exchange Algorithm (when pass band and stop have same weight but
transition band is more).
VI. CONCLUSION
The design of linear phase optimal FIR filters, with very flat passbands, can be done by solving the frequency response equations for different frequency components. To solve the filter parameters, one can use an iterative algorithm like Remez exchange algorithm [3]. The response of Remez algorithm is shown in fig. 9. We can also do this, by sampling the desired frequency response with non uniform frequency spacing as shown the response in Fig. 1. Here we see that the degree of flatness in passbands and ripples in stopbans depend on the transition bandwidth. If we set this bandwidth low then ripples increases and vice versa. We can get better stopband attenuation using Blackman window method. In summary, the optimal solution is not always a good solution to the filter design problem. The major disadvantage of the window design method is the lack of precise control of the critical frequencies, such as p ands, in the design of a low pass
FIR filter and its value depends on the type of window and the filter length N [3]. Fig. 8 shows the relative performance of the different filtering methods. The frequency sampling method provides an improvement over the window design method, since Hr() is specified at the frequencies k 2k/N and transition band is a multiple of 2/N [3]. This filter design method is particularly attractive when the FIR filter is realized either in the frequency domain by means of the DFT or any of the frequency sampling realizations.
REFERENCES
[1] J. R. Johnson, “Introduction to Digital Signal Processing,”4th ed., Prentice-Hall of India Private Limited, 1997, pp. 85-95.
[2] J. H. McClellan., T. W. Parks, and L. R. Rabiner, “A Computer Program for Designing Optimum FIR linear Phase Digital Filters,”
IEEE trans.Audio Electroacoust., AU-21, December 1973, pp. 506-526. [3] J. G. proakis., D. G. Manolakis., Digital Signal Processing principles, Algorithms, and Application.” 3rd ed., Prentice-Hall of India Private
Limited, 1997, pp. 620-662.
[4] E. C. Ifeachor, B. W. Jervis, “Digital Signal Processing A Practical Approach,” 2nd ed., Pearson Education Pte. Ltd. 2003, pp. 342-398.
[5] L. R. Rabiner, B. Gold, and C. A. McGonegal, “An approach to the approximation problem for nonrecursive digital filters,” IEEE trans. Audio Electroacoustics,Vol.18, Iss. 2, pp. 83- 106.
|
H
(ω
)
|
in
d
B