in the population sciences published by the Max Planck Institute for Demographic Research Konrad-Zuse Str. 1, D-18057 Rostock · GERMANY www.demographic-research.org
DEMOGRAPHIC RESEARCH
VOLUME 23, ARTICLE 7, PAGES 153-190
PUBLISHED 23 JULY 2010
http://www.demographic-research.org/Volumes/Vol23/7/ DOI: 10.4054/DemRes.2010.23.7
Research Article
Ethnic differentials in the timing of family
formation: A case study of the complex
interaction between ethnicity, socioeconomic
level, and marriage market pressure
Heather Booth
© 2010 Heather Booth.
This open-access work is published under the terms of the Creative Commons Attribution NonCommercial License 2.0 Germany, which permits use, reproduction & distribution in any medium for non-commercial purposes, provided the original author(s) and source are given credit.
1 Introduction 154
2 Fiji: Relative population size and fertility transition 155
3 Methods and materials 155 3.1 Conceptual framework 155
3.2 Measures 156
3.3 Data 157
4 Ethnic differentials in the timing of family formation at
the population level 159
5 The four hypotheses 161 5.1 Minority group hypothesis 161
5.2 Norms hypothesis 162
5.2.1 Fijian norms and their influence on fertility behaviour 163 5.2.2 Indian norms and their influence on fertility behaviour 164 5.2.3 Differing norms and ethnic differentials in the timing of
family formation
165
5.3 Characteristics hypothesis 166 5.4 Interaction hypothesis 167
6 A more complex interaction 168 6.1 Socioeconomic subgroups and the timing of family formation 168 6.2 True interaction: socioeconomic differentials by ethnicity 173 6.3 The effect of the marriage market 174 6.4 Net effect on age at marriage 175 6.5 The complex interaction 176
7 Case study discussion 178 7.1 Strengths and limitations 178 7.2 Conceptual frameworks 180 7.3 Case study findings 181
8 Conclusions 182
8.1 Limitations of existing hypotheses 183 8.2 A more comprehensive approach 184
9 Acknowledgments 184
Ethnic differentials in the timing of family formation:
A case study of the complex interaction between ethnicity,
socioeconomic level, and marriage market pressure
Heather Booth1
Abstract
Ethnic differentials in the timing of family formation in Fiji cannot be adequately explained by the norms, characteristics, minority group, and interaction hypotheses. The missing dimensions are socioeconomic level within ethnicity and time, including the marriage market effects of fertility transition. A complex interaction of factors involves underlying norms and the opposing effects of modernisation, including the interaction between socioeconomic level and ethnicity, and the changing marriage market pressures determined by the ethnically differentiated fertility decline consistent with the minority group hypothesis. Within each ethnicity, marriage market pressures are concentrated at lower socioeconomic levels, resulting in decreasing trends in age at marriage, and increased socioeconomic differentiation.
1 Australian Demographic and Social Research Institute, Australian National University, Canberra, ACT
1. Introduction
Ethnicity has been found to have a substantial effect on fertility behaviour, including the timing of family formation, and ethnic differentials in age at marriage and childbearing have been widely observed (e.g., Cheung et al. 1985; Watkins 1986; Lesthaeghe, Kaufmann, and Meekers 1989; Arnaldo 2004). Previous studies of fertility behaviour have often sought to explain ethnic and religious differentials in terms of one of four hypotheses. Briefly, the minority group hypothesis focuses on the insecurities of a minority group in terms of either numerical strength or social mobility (Goldscheider 1971). The norms hypothesis holds that cultural norms and religious doctrines lead to differentials in fertility through their influence on fertility-related behaviour, while the
characteristics hypothesis would explain ethnic differentials entirely in terms of demographic and socioeconomic composition (Goldscheider 1971). The fourth hypothesis, the interaction hypothesis, explains ethnic differentials in terms of both socioeconomic level and cultural or religious norms (Chamie 1981).
Many cross-sectional studies in developing countries have found cultural or religious norms to be highly relevant in explaining ethnic or religious differentials in fertility behaviour after socioeconomic factors have been taken into account (e.g., Cheung et al. 1985, Knodel et al. 1999, Arnaldo 2004). Knodel et al. (1999) also found some support for the minority group and interaction hypotheses. However, cross-sectional studies do not take into account the dynamics of change. For the timing of family formation, especially female age at marriage, educational attainment is widely regarded as an important determinant (e.g., Jejeebhoy 1995), though it has recently been questioned as the main driver of change (Mensch, Singh, and Casterline 2006). The opposing dynamic of marriage market pressure stemming from earlier fertility decline may mask the delaying effects of education and other socioeconomic change. Variations by ethnicity in the onset and pace of fertility decline may thus influence observed ethnic differentials in the timing of marriage and family formation in the later stages of transition.
2. Fiji: Relative population size and fertility transition
The population of Fiji includes two ethnically and culturally distinct populations: the indigenous Fijians and the Fiji Indians (hereafter referred to as Fijians and Indians, respectively). Together, these two groups make up 90% of the total population. Intermarriage between the two populations is negligible, and their family formation patterns and broader demography differ in complex ways.
The Indian population emanates from indentured labour brought to Fiji by the British during colonial times to work in the sugar industry. This relatively young migrant population experienced rapid natural increase in the first half of the 20th century, raising concerns among Fijians about relative population size. The Fijian population comprised less than half of the total by 1936, and became a minority by 1946 (Chandra and Chandra 1990). This situation prevailed until the 1986 census. The 1996 census showed that Fijians comprised 50.8% of the total population, while Indians made up 43.7% (Bureau of Statistics 1998a).
Crude birth rates and general fertility rates (based on registration data) began to decline in the early 1960s, with the Indian decline commencing about five years earlier than the Fijian decline, and continuing at a faster pace (Naroba 1990). Total fertility in 1966-68 was 5.3 for Fijians and 4.9 for Indians. By 1985-87, the more rapid decline among Indians had resulted in a total fertility differential of 1.1, or 4.1 and 3.0, respectively (Bureau of Statistics 1998b).
The fertility transition was interrupted in the early 1990s as a result of the ethnically motivated coups d’état of May and September 1987, which led to a renewed focus on differentials in population size. The coups came in direct response to the April 1987 election of the first government in which Indians played a dominant role (Lal 1988). Faced with a lack of political representation and economic uncertainty, many Indians left the country (Bedford and Levick 1988), though some later returned. While the Indian transition resumed in the mid-1990s, Fijian fertility remained constant. In 1994-96, total fertility was 3.9 for Fijians and 2.5 for Indians, a differential of 1.4 (Bureau of Statistics 1998b).
3. Methods and materials
3.1 Conceptual framework
not occur, and age at marriage and the first birth interval are independent. If, on the other hand, most marriages are precipitated by premarital conception, the appropriate framework (Framework B) would specify dependence of age at marriage on the independent variables, age at first birth, and the first birth interval. To the extent that premarital conceptions do not precipitate marriage, age at marriage and age at first birth are independent, as well as being independent of the first birth interval (Framework C). In populations among whom premarital conceptions are common, different conceptual frameworks may apply to different subgroups. Based on Booth (2001), Framework A would seem most appropriate for Indians; while for Fijians, a combination of Frameworks A, B, and C may apply (see also Section 7.2). This difference in conceptual frameworks should be borne in mind in the interpretation of the analysis.
3.2 Measures
In the absence of direct data, the singulate mean age at marriage (SMAM) is calculated from census data on proportions of women who are never-married using Hajnal’s method (Hajnal 1953): SMAM = (15 +5P – 50N)/(1-N), where P is the sum of the proportions of women who are never-married at ages 15-19 to 45-49, and N is the proportion of women who are never-married at the exact age of 50 (estimated as the average of the proportions at 45-49 and 50-54). Use of proportions of women who are nulliparous produces the mean age at first birth (MAFB), and the difference between SMAM and MAFB gives the ‘mean first birth interval’ (MFBI) (Booth 2001).
This method produces age-standardised measures, and is exact except for age distribution effects within age groups, as in abridged life tables. The measure strictly refers to the mean age at first event among those experiencing the event before age 50. As very few marriages and first births occur at age 50+ in Fiji, the measure approximates the mean age among those who ever experience the event. The percentages of women who are never-married at age 50 are 4.5 for Fijians and 1.7 for Indians in 1986, and 5.7 and 2.9, respectively, in 1996; the percentages of women who are nulliparous at age 50 are 10.0 and 5.6 in 1986, and 7.7 and 4.7 in 1996, respectively. Strictly, SMAM and MAFB are independent in that they refer to different (if overlapping) groups of women (see Section 7.1). However, as both events are almost universal, the measures refer to roughly the same women. At age 50, 1%-6% of married women are nulliparous.
period (Agarwala 1962). Smoothing was used in order to avoid irregularities in the intercensal proportions at older ages (Booth 2001). Among Indians, SMAM and, hence, MAFB are subject to bias arising from female emigration for arranged marriage and residence overseas; overestimation is likely in the more recent estimates (Booth 1994a, 2001). The elevated level of out-migration among Indians following the 1987 coups is not expected to result in significant additional bias in 1996 because the main determining factor is the difference in rates of migration between the never-married and ever-married (or the nulliparous and parous), rather than in the level of migration per se
(Booth 1994a, Appendix); and because, by 1996, some migrants had returned, many of the affected cohort had married (if delayed), and a new cohort had entered the calculation at the influential early ages.
The analysis by socioeconomic subgroups is based on single-census estimates which are subject to bias due to the changing age at the first event. Such bias is not expected to be significant: even in the case of rapidly increasing Indian age at marriage between 1946 and 1976, bias was at most 0.3 years (Booth 2001). Bias in socioeconomic differentials will at least partly cancel, except when rates of change are in opposite directions. Because other biases are likely to be in the same direction and of similar magnitude for subgroups within a population, the socioeconomic differentials and changes over time will be relatively free from bias.
3.3 Data
The quantitative data employed in this analysis are from the decennial population censuses of 1946 to 1996, and refer to women aged 15-54. Data on socioeconomic characteristics were available for 1986 and 1996. Most results refer to the total enumerated population; the 1986 socioeconomic differentials exclude the institutional population, with negligible effect.
Marriage was defined on a de facto basis. Cases in which marital status was not stated were removed from the analysis, equivalent to assuming the same proportion never-married as for respondents; any overestimation due to this assumption is negligible since such cases were relatively rare (for any subgroup, at most 0.4% in 1986 and 1.0% in 1996). The proportions of women who are nulliparous were derived from the number of children ever born. There were no cases in which number of children ever born was coded as not stated; since it is likely that not stated cases had been coded as zero, MAFB would be overestimated.
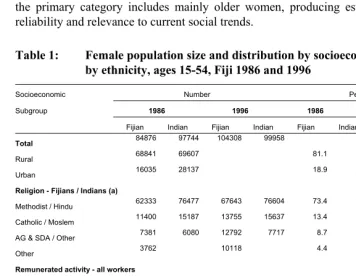
defined for ‘all workers,’ which includes employees, the self-employed, those looking for work, homemakers and, in 1986, those not looking for work. All workers constitute 82%-84% of the population aged 15-54. Remunerated workers are all those receiving any cash income and those looking for work, while non-remunerated workers are those working purely in subsistence-level activities, homemakers and, in 1986, those not looking for work. The definition of remunerated worker was broader in 1996 than in 1986, resulting in an increase in the proportion of women who are remunerated, and a decrease in the proportion of women who are homemakers. Occupation was defined for those employed in remunerated work, with the exception of those looking for work, and was broken down into four groups. Educational attainment was defined on two bases: all workers and the remunerated employed. Since educational attainment has increased over time, with a primary education completion rate of 79% in 1985-92 (Booth 1994b), the primary category includes mainly older women, producing estimates of reduced reliability and relevance to current social trends.
Table 1: Female population size and distribution by socioeconomic subgroup by ethnicity, ages 15-54, Fiji 1986 and 1996
Socioeconomic Number Percentage
Subgroup 1986 1996 1986 1996
Fijian Indian Fijian Indian Fijian Indian Fijian Indian
Total 84876 97744 104308 99958
Rural 68841 69607 81.1 71.2
Urban 16035 28137 18.9 28.8
Religion - Fijians / Indians (a)
Methodist / Hindu 62333 76477 67643 76604 73.4 78.2 64.8 76.6
Catholic / Moslem 11400 15187 13755 15637 13.4 15.5 13.2 15.6
AG & SDA / Other 7381 6080 12792 7717 8.7 6.2 12.3 7.7
Other 3762 10118 4.4 9.7
Remunerated activity - all workers
Remunerated 19881 17277 26753 18970 25.5 19.4 30.4 22.5
Non-remunerated 57988 71689 61146 65370 74.5 80.6 69.6 77.5
Homemakers 50124 66321 40179 59576
Occupation - remunerated employed
Professional & related 2934 3142 5603 4641 18.3 23.4 21.1 24.6
Clerks, service, sales 8815 6978 8492 6094 55.1 51.9 31.9 32.3
Agriculture 2448 1152 3381 753 15.3 8.6 12.7 4.0
Table 1: (Continued)
Socioeconomic Number Percentage
Subgroup 1986 1996 1986 1996
Fijian Indian Fijian Indian Fijian Indian Fijian Indian
Education - all workers
Primary 18307 30443 10549 18784 23.7 34.5 12.0 22.3
Secondary 57302 54779 71126 58544 74.2 62.1 80.9 69.4
Tertiary 1614 2986 6224 7012 2.1 3.4 7.1 8.3
Education - remunerated employed
Primary 2478 2745 2170 2281 15.5 20.4 8.2 12.1
Secondary 12002 8400 19731 11912 75.3 62.3 74.1 63.1
Tertiary 1458 2335 4715 4698 9.1 17.3 17.7 24.9
Note: (a) For Fijians, the categories are: Methodist, Catholic, Assembly of God & Seventh Day Adventist, Other; for Indians, the categories are Hindu, Moslem, Other.
Source: 1986 and 1996 census data.
The sizes of the different socioeconomic subgroups are shown in Table 1. Whenever possible, the categories were designed to be sufficiently large to ensure that random error is minimised. In some cases, however, the creation of small subgroups was unavoidable due to ethnic or temporal differences in distributions. Results for small subgroups (<2000, or 2000-2500 with one or more subgroups <100) are italicised. (See Booth 1994a, Appendix, for the extent of the bias arising from given errors in proportions).
4. Ethnic differentials in the timing of family formation at the
population level
Figure 1: SMAM and MAFB by ethnicity, Fiji, 1946-56 to 1986-96
17 18 19 20 21 22 23 24
1950 1960 1970 1980 1990
A
ge (
year
s)
Fijian SMAM Fijian MAFB Indian SMAM Indian MAFB
Source: Author’s calculations based on census data.
Though changes were introduced in the legal marriage age, these cannot be held responsible for the increases in SMAM that occurred among Indians. Rather, the rapid increase in the Indian age at marriage has been attributed to the more balanced marriage market resulting from demographic factors: as the Fiji-born population came of marriageable age, the migration-related shortage of females eased and, consequently, the female age at marriage began to increase well before 1956 (McArthur 1971). In 1946-56, the sex difference in age at marriage was 4.0 years, though Mayer (1973:66) reports that five years was regarded as ideal in 1951. By 1966, there was a surplus of never-married females relative to males of the appropriate age (McArthur 1971), leading to even later marriages and further reductions in the sex difference in age at marriage (2.5 years in 1966-76). Reductions in this surplus contributed to the more recent levelling off in female age at marriage.
marriage and the average first birth interval: Indians married 1.8 years earlier, and their first birth interval was 1.7 years longer.
5. The four hypotheses
How useful are the four existing hypotheses in explaining the observed population-level ethnic differentials in the timing of family formation in Fiji? In this section, each hypothesis is considered in relation to the observed differentials, and the consistency of the two is assessed.
5.1 Minority group hypothesis
The minority group hypothesis has two sub-hypotheses. Minority group hypothesis A states that, where acculturation is not sought and the minority group suffers economic or political disadvantage, fertility behaviour will be oriented towards maintaining fertility levels that are relatively high in order to secure greater numerical strength. On the other hand, if the group seeks acculturation and upward social mobility, minority group hypothesis B states that their behaviour will limit fertility as long as group ideology is not strongly pronatalist (Goldscheider 1971). As noted above, concerns about relative population size have a long and prominent history; they might therefore be expected to influence fertility behaviour.
The enthusiastic response of the Indian population to the availability of family planning might, however, be attributable to economic insecurity, which led to a desire for social mobility (aside from their higher socioeconomic standing (Laquian and Naroba 1990). Though the desire for acculturation is absent, the desire on the part of the Indian population for full involvement in public affairs may possibly be viewed in a similar light; in this case, lower Indian fertility is consistent with hypothesis B. For Fijians, the relatively low use of family planning may be partly related to a low desire for upward mobility stemming from their subsistence lifestyle and greater sense of security (Roizen, Gyaneshwar, and Roizen 1992). This is not inconsistent with hypothesis B. Clegg (1988) similarly attributed the slower decline in Fijian fertility to lower levels of involvement in economic development and stronger cultural ties with the village.
Thus, the minority group hypothesis is consistent with the observed differential in the fertility quantum. Hypothesis A is consistent with higher Fijian fertility in order to secure greater population size, while hypothesis B is consistent with lower Indian fertility in order to achieve social mobility. However, this consistency does not extend to the timing of family formation, as the differential in the quantum is theoretically inconsistent with differentials in the timing. Lower Indian fertility is inconsistent with earlier Indian SMAM and rough parity in MAFB. Further, the trends in Figure 2 do not support this hypothesis: the rapid adoption of family planning among Indians had no effect on MFBI, while increasing Fijian MAFB is not consistent with the maintenance of higher fertility. Clearly, the timing of family formation is not instrumental in determining fertility quantum differentials; this is borne out by age-specific fertility patterns (Bureau of Statistics 1998b).
5.2 Norms hypothesis
5.2.1 Fijian norms and their influence on fertility behaviour
Traditionally, Fijian marriage was arranged and premarital sexual relations were taboo for females (Nayacakalou 1955, 1978), though chiefly prerogative over young unmarried women resulted in significant numbers of births (Lukere 1997). ‘Elopement,’ in which marriage resulted from the female spending a night under the male’s (family’s) roof, regardless of her volition or whether coitus took place, was shameful for the male’s kin, and required conciliation with the female’s kin (Ravuvu 1983). European contact and Christianity led to the erosion of some traditional practices, but the taboo on premarital sexual relations was reinforced. Traditional sanctions, such as shaving the young woman’s head, may still be applied in rural areas (Chandra 2000). In the late 19th and early 20th centuries, the female average age at marriage was 22 (Pulea 1986).
In the modern social and economic environment, wider social interactions resulting from travel by both sexes for education and work (Ravuvu 1983) have led to diminished parental control in the choice of marriage partner. In cases in which parents are not agreeable to a marriage partner, the couple may elope, drawing on tradition and conciliation. After marriage, signs of pregnancy are ‘eagerly awaited’ (Ravuvu 1983:52). The weakening of customary beliefs and practices has also led to more widespread premarital sexual relations (Chandra 2000). Seniloli (1996) found that the average age at first coitus of ever-married women aged 15-34 preceded the average age at first union by 1.9 years.
5.2.2 Indian norms and their influence on fertility behaviour
The Indian population comprises several distinct communities (Table 1) that share common values and norms with regard to family formation, including arranged and patrilocal marriage and the dowry system. Marriage is of central importance because of the threat to family and, in particular, to male honour posed by female sexuality and loss of sexual purity (Brenneis 1979; Chandra 2000; Srinivasan 2005). The prohibition of female premarital sexual relations is enforced through early and arranged marriage (Mayer 1973:66; Gupta 1976:4). Once married, couples are subject to considerable social pressure to produce a first child. In Fiji in the post-indenture period, strict moral codes were reinforced in relation to sexuality and women (Lateef 1990). In the early 1950s, 16 was a common age at marriage, and 20 was considered late (Mayer 1973:66). These cultural values have not changed appreciably, but certain practices have been adapted to accommodate socioeconomic change. Importantly, education has been integrated into the marriage process, with higher educational attainment increasing the prospects of a good marriage (Mayer 1973:65). The status for the parents is also greater when the partner resides in a developed country (Chandra 2000). Daughters must, however, comply: the overriding importance attached to the control of female sexuality is seen in the withdrawal of girls from school for an arranged marriage, precipitated by signs of sexuality (Seniloli 1996). Females are under-represented in school at ages 17-18, despite having higher attendance rates than males up to age 16 (Booth 1994b). Female employment also contributes to marriage prospects. Further, the income offsets the costs of marriage to the family. Education and employment also increase the prospects of making a ‘love marriage.’ Chandra (2000) found that educated and employed adolescents fully expected to select their own marriage partner, but that arranged marriage at age 20 or younger was still the norm for those not completing school and not working. The value accorded to higher education and a professional career has also led to some relaxation of pressures to produce a first child soon after marriage.
Chandra 2000). Premarital pregnancy means that the young woman’s continued education, employment, and prospects for a good marriage are doomed: her marriage will be hastily arranged by parents anxious to avoid shame, with considerable pressure on the responsible male to comply should he resist (Chand 1995). Illegitimacy is considered a ‘very serious offence’ (Laquian and Naroba 1990:115), and is consequently a rare occurrence. Where illegitimacy does occur, the stigma and dishonour faced by the whole family usually lead to outright rejection of both the young mother and infant (Chand 1995; Chandra 2000:61). Data for 1994-95 show that only 1.2% of births to Indian women aged 15-19 were illegitimate (Reproductive and Family Health Association 1996).
5.2.3 Differing norms and ethnic differentials in the timing of family formation
The above descriptions provide evidence of considerable normative differences between Fijians and Indians in relation to the timing of family formation: in broad terms, Indian norms place great emphasis on chastity and control, while Fijian norms are less restrictive and more accommodating. The emphasis among Indians on female sexual purity at marriage can be readily identified as the main normative factor leading to relatively early marriage, and this factor remains strongly operational at lower socioeconomic levels. Though these pressures are resisted where tertiary education is involved, the use of education to increase status in the marriage market serves to minimise age at marriage for given educational attainment. Indian norms surrounding female sexual purity at marriage also ensure the near absence of premarital childbearing, if not premarital pregnancy, such that MFBI and, for given SMAM, MAFB are determined by norms governing childbearing within marriage. Prevailing normative pressures to prove fecundity and produce the first child can thus be held responsible for the fact that, at the population level, MFBI approximates 1.4 years (allowing for time to conception).
accommodation surrounding premarital sexual relations and childbearing provides little incentive for the use of contraceptives, while barriers to use are presented by the restriction of family planning programs to married women, in line with Fijian-Christian ideals.
The norms hypothesis is thus entirely consistent with the observed ethnic differentials, whereby marriage is later among Fijians, and the first birth interval is wider and more positive among Indians. Given the dependence of MAFB on SMAM and MFBI in the Indian population, and the partial dependence and shared norms governing all three measures in the Fijian population (see Section 7.2), it can be concluded that the ethnic differential in MAFB is also consistent with the norms hypothesis. The role of norms in relation to changing ethnic differentials is addressed in Section 5.4.
5.3 Characteristics hypothesis
In explaining ethnic differentials at the population level in socioeconomic terms, the characteristics hypothesis holds that this differential is the product of socioeconomic compositional differences between the ethnic groups (or populations) and overall socioeconomic differentials in behaviour (Goldscheider 1971). Socioeconomic composition by ethnicity in 1986 and 1996 appears in Table 1. Compositional differences stem from greater Fijian rural residence and involvement in subsistence and remunerated agriculture, and greater Indian non-remunerated activity, principally as homemakers. In addition, remunerated Indians are more likely to have tertiary education and professional and related occupations, but are also more likely to be engaged in production and other occupations. However, none of these differences reaches 10 percentage points, though differences for primary or secondary education reach 10-13 percentage points. Socioeconomic differentials in the timing of family formation for the overall population (not shown) were estimated using the weighted averages of the Fijian and Indian values in Table 2 (Section 6.1).
inconsistent with the direction of the observed differential at the population level. For example, given the trend towards later marriage in urban areas, the higher proportion of Indians living in urban areas would, under the hypothesis, point to later Indian than Fijian marriage, which is not observed. On both counts, the limiting factor is that the hypothesis fails to take into account ethnic differentials within subgroups – in other words, statistical interaction. The explanatory power of socioeconomic composition alone is poor. The characteristics hypothesis thus contributes little to explaining the observed ethnic differentials.
5.4 Interaction hypothesis
The interaction hypothesis maintains that, particularly during fertility transition, ethnic differentials in fertility behaviour at a given point in time are temporary and ‘depend on the interaction’ of group (or population) socioeconomic level and cultural norms governing the speed or degree of response to socioeconomic level (Chamie 1981:9). Under this hypothesis, ethnic groups respond in a similar manner to socioeconomic level, albeit at different speeds, such that their fertility behaviour eventually converges in the post-transitional period, when normative influences are ‘negated by the conditions of modern society’ (Chamie 1981:11). The interaction hypothesis was formulated under the assumption of equal behaviour in the pre-transitional period (Chamie 1981). In Fiji, this is not the case for the timing of family formation; it has already been established (Section 5.2.3) that norms play an important differentiating role in the pre-transitional period, as well as more recently. This hypothesis cannot therefore be considered in its exact formulation, and it is necessary to consider
increased Indian response. Thus, the interaction hypothesis is of doubtful relevance to the case under examination.
6. A more complex interaction
Examination of the four hypotheses has shown that only the norms hypothesis holds direct explanatory power for the observed ethnic differentials. However, the norms hypothesis does not address the effect of modernisation in delaying family formation, and is thus only partially explanatory. The interaction hypothesis, which does address modernisation, is of questionable relevance.
A common feature of the four hypotheses is their restriction to the population level. However, the above discussion of norms strongly suggests that socioeconomic disaggregation is essential to understanding the observed ethnic differentials. The hypotheses also fail to address the dimension of time. The incorporation of time is essential for two reasons. First, as already noted, strong underlying normative differences in Fiji necessitate a focus on changing ethnic differentials in order to fully understand the processes involved. Second, the effects of earlier fertility decline – which are inevitable in the later stages of transition – can only be addressed through temporal change. This section examines socioeconomic differentials in the timing of family formation, including statistical interactions between socioeconomic level and ethnicity. In addressing time, it examines changing marriage market pressures and the net effect of these pressures and modernisation. A more comprehensive explanation of the observed differentials is then constructed.
6.1 Socioeconomic subgroups and the timing of family formation
Table 2: SMAM, MAFB, and MFBI by socioeconomic subgroup by ethnicity, Fiji, 1986 and 1996
Socioeconomic Fijian Indian
Subgroup SMAM MAFB MFBI SMAM MAFB MFBI
1986: TOTAL 23.36 22.84 -0.53 21.63 23.02 1.39
Residence
Rural 23.26 22.72 -0.54 21.32 22.71 1.39
Urban 23.60 23.04 -0.56 22.34 23.73 1.38
Religion - Fijians / Indians
Methodist / Hindu 23.38 22.92 -0.46 21.71 23.13 1.42
Catholic / Moslem 23.53 22.39 -1.14 20.85 22.29 1.44
AG & SDA / Other 23.25 22.88 -0.37 22.62 23.45 0.83
Other 22.99 22.81 -0.18
Remunerated activity - all workers
Remunerated 26.17 24.82 -1.35 25.56 26.91 1.35
Non-remunerated 21.84 21.64 -0.20 19.80 21.64 1.84
Homemakers 20.87 21.16 0.28 18.66 20.88 2.23
Occupation - remunerated employed
Professional & related 23.77 24.11 0.34 22.74 25.04 2.30
Clerks, service, sales 25.81 24.77 -1.04 25.07 26.55 1.48
Agriculture 24.32 23.36 -0.95 22.15 25.79 3.64
Production & other 25.60 24.33 -1.27 24.63 26.36a 1.73
Education - all workers
Primary 23.94 22.17 -1.78 20.77 22.03 1.26
Secondary 22.80 22.79 -0.01 20.73 22.54 1.81
Tertiary 23.68 23.43 -0.25 22.70 24.75 2.05
Education - remunerated employed
Primary 25.88 23.14 -2.74 24.57 25.44 0.87
Secondary 25.49 25.25 -0.24 23.89 25.24 1.35
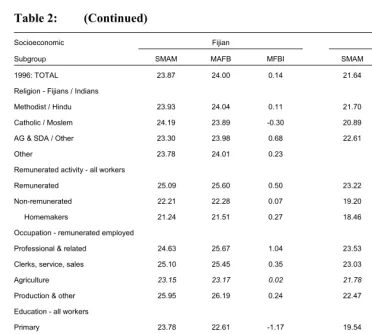
Table 2: (Continued)
Socioeconomic Fijian Indian
Subgroup SMAM MAFB MFBI SMAM MAFB MFBI
1996: TOTAL 23.87 24.00 0.14 21.64 23.11 1.47
Religion - Fijians / Indians
Methodist / Hindu 23.93 24.04 0.11 21.70 23.19 1.49
Catholic / Moslem 24.19 23.89 -0.30 20.89 22.24 1.35
AG & SDA / Other 23.30 23.98 0.68 22.61 24.13 1.52
Other 23.78 24.01 0.23
Remunerated activity - all workers
Remunerated 25.09 25.60 0.50 23.22 25.14 1.92
Non-remunerated 22.21 22.28 0.07 19.20 21.18 1.99
Homemakers 21.24 21.51 0.27 18.46 20.70 2.24
Occupation - remunerated employed
Professional & related 24.63 25.67 1.04 23.53 26.26 2.72
Clerks, service, sales 25.10 25.45 0.35 23.03 25.14 2.11
Agriculture 23.15 23.17 0.02 21.78 23.64 1.86
Production & other 25.95 26.19 0.24 22.47 23.60 1.13
Education - all workers
Primary 23.78 22.61 -1.17 19.54 21.20 1.65
Secondary 22.92 23.20 0.29 19.76 21.61 1.85
Tertiary 23.79 25.13 1.33 22.90 25.74 2.84
Education - remunerated employed
Primary 25.10 24.37 -0.74 22.58 24.27 1.70
Secondary 25.23 25.54 0.30 22.78 24.18 1.40
Tertiary 24.62 25.64 1.02 23.84 26.52 2.68
Note: (a) Adjusted for bias due to high recorded proportions nulliparous at age 45-54 (probably non-responses) which gave a negative MFBI.
Italics indicate based on either <2000 women or 2000-2500 with one or more age groups of <100.
Figure 2: Timing of family formation patterns across socioeconomic subgroups by ethnicity, Fiji 1986 and 1996
Fijian 1986
y = 0.618x + 8.4965 R2 = 0.6052
19 21 23 25 27
19 21 23 25 27
SMAM
MA
FB
Fijian 1996
y = 1.0326x - 0.5403 R2 = 0.726
19 21 23 25 27
19 21 23 25 27
SMAM
MA
FB
Indian 1986
y = 0.9421x + 2.9914 R2 = 0.8529
19 21 23 25 27
19 21 23 25 27
SMAM
MA
FB
In dian 1996
y = 1.1255x - 0.8792 R2 = 0.9226
19 21 23 25 27
19 21 23 25 27
SMAM
MA
FB
Source: Table 2
levels are unexpected (see Section 6.2). Similarly, while wider MFBI at the high socioeconomic level is expected, the medium–low differentials are unexpected. In 1996, most socioeconomic rankings are in the expected order. Changes over time at the medium socioeconomic level are potentially affected by the wider definition of remunerated work in 1996, which tends to produce findings of earlier family formation. However, similar patterns for clerks and service and sales occupations, and by education for all workers, which is not affected by this definition, indicate that this bias is not dominant.
Figure 3: Trends in SMAM, MAFB and MFBI by ethnicity and in the ethnic differential by socioeconomic level, Fiji, 1986-1996
Fijian SMAM Indian SMAM Indian-Fijian SMAM
Fijian MAFB Indian MAFB Indian-Fijian MAFB
Fijian MFBI Indian MFBI Indian-Fijian MFBI
19 20 21 22 23 24 25 26 27 1986 1996 19 20 21 22 23 24 25 26 27 1986 1996 19 20 21 22 23 24 25 26 27 1986 1996 19 20 21 22 23 24 25 26 27 1986 1996 -2 -1 0 1 2 1986 1996 0 1 2 3 4 1986 1996 -4 -3 -2 -1 0 1 2 3 1986 1996 -4 -3 -2 -1 0 1 2 3 1986 1996 0 1 2 3 4 1986 1996 1 8.00 2 3.00 1 2
Low socio-economic Medium socio-economic High socio-economic
6.2 True interaction: socioeconomic differentials by ethnicity
It can be seen in Figure 3 that, while the patterns by socioeconomic level are broadly similar in the two populations, larger differentials are found among Indians than among Fijians. This interaction between socioeconomic level and ethnicity is examined by focusing on 1986, as additional factors are involved in 1996 (Section 6.3).
A large part of the interaction in SMAM and MAFB arises from very early marriage among Indians at the low socioeconomic level, producing a high–low differential of 3.3 years in 1986, compared with only 1.6 years for Fijians. This large differential is consistent with the way in which education has been integrated into the Indian marriage process (Section 5.2.2). The overriding importance of norms regarding sexual purity reinforces the association between early marriage and both lower educational attainment and non-remunerated activity. At the same time, the status accorded to higher education leads to the association of later marriage with tertiary attainment. Among Indians, therefore, normative factors have a sharply differentiating effect between low and high socioeconomic levels. In contrast, Fijian normative factors have a weaker differentiating effect. The smaller high–low differential is consistent with the absence of norms favouring very early marriage, the lower degree of parental control over female sexuality, and generally more accommodating norms. While early sexual activity resulting in pregnancy may lead to lower educational attainment, it does not necessarily lead to early marriage. Further, the adoption of illegitimate children by the extended family and the care of children by grandparents enables parous women to further their education. More generally, stronger Fijian cultural ties with the village, custom-based status structures, and traditional obligations to the extended family constitute a way of life that does not encourage socioeconomic differentiation.
contributing to the differential). All of these factors also affect MAFB, for Indians through SMAM and for Fijians either directly or through SMAM. The larger Fijian differential may be attributable to weaker normative pressures to marry, such that economic delaying factors dominate to a greater extent at the medium socioeconomic level. The radical change in these differentials in 1996 reflects the operation of additional factors (Section 6.3).
The interaction in MFBI in 1986 stems from the shorter Indian interval at the medium than at the low socioeconomic level. This may reflect the relatively late age at marriage at the medium socioeconomic level, and possibly a greater proportion of marriages that are love marriages or precipitated by pregnancy. At the low socioeconomic level, conception may be delayed by teenage subfecundity and arranged marriage. Among Fijians, there is no difference in MFBI between the medium and low socioeconomic levels.
Thus, the interactions observed in the 1986 data between ethnicity and socioeconomic level are largely attributable to the different ways in which norms operate at different socioeconomic levels within the two populations. Norms are thus instrumental in determining both overall ethnic differentials and interactions with socioeconomic level.
6.3 The effect of the marriage market
An important factor in explaining the timing of marriage and family formation is the balance in the marriage market. Declining fertility leads, a generation or so later, to a relative shortage of females (given later male age at marriage), creating pressure towards earlier female age at marriage, or possibly the alternative of later male marriage (or both). Though formulated in terms of the marriage market, this factor is directly and indirectly relevant to age at first birth. The indirect effect operates through age at marriage, when this first occurs. The direct effect involves pressure towards earlier premarital sexual activity (including, in the Indian case, signs of sexuality) stemming from the surplus of males, which may in turn precipitate marriage.
the Indian population provides the basis for greater decreases in Indian age at marriage. Similar effects can be expected in MAFB. These gross effects, which are population-level effects, are not observable.
6.4 Net effect on age at marriage
As modernisation and the marriage market effect operate in opposing directions on age at marriage, it is their balance that produces the observed trends between 1986 and 1996. Socioeconomic differentiation in this balance derives from socioeconomic differentiation in the response to modernisation: marriage market pressure is opposed, by definition, to a greater extent at the high socioeconomic level, concentrating the pressure at lower levels as long as there is substitutability of marriage partners of different socioeconomic levels. This concentration of pressure will also be greater when the high socioeconomic level constitutes a larger proportion of the population; socioeconomic composition is therefore a factor.
In the Indian population, significant pressures towards early marriage are balanced against sharply differentiated normative responses to modernisation. At the high socioeconomic level, marriage market pressures are opposed by a response to modernisation governed by strong norms according status to higher education, resulting in the observed increase in SMAM of 0.8 years (Figure 3). Pressures to marry early are, therefore, concentrated at lower socioeconomic levels. As norms regarding sexual purity present no impediment to earlier marriage, the marriage market effect dominates, resulting in the observed decrease in SMAM of 1.1 years at the medium socioeconomic level. At the low socioeconomic level, the marriage market effect also dominates: SMAM also decreases, but less rapidly (by 0.6 years).
In the Fijian population, the weaker marriage market effect is balanced against a response to modernisation that is less differentiated by socioeconomic level. Again, the effects of modernisation dominate at the high socioeconomic level, and age at marriage increases by 1.2 years (Figure 3). At the medium socioeconomic level, the marriage market effect is dominant, resulting in a decrease of 0.3 years in SMAM, but it is not dominant at the low socioeconomic level, where an increase of 0.4 years occurs.
6.5 The complex interaction
Observed ethnic differentials in the timing of family formation by socioeconomic level (Figure 3) can now be fully explained in terms of fundamental normative differences, the interaction of socioeconomic level and ethnicity, and the changing balance between the effects of modernisation and the marriage market. At the population level, socioeconomic composition must also be taken into account.
Differing norms have been identified as instrumental in determining the earlier Indian age at marriage (Section 5.2.3). At the high socioeconomic level, the response to modernisation is greater (or earlier) among Indians (seen in the large high–low socioeconomic differential) because of the status attached to education, such that, by 1986, the Indian SMAM approaches the normatively later Fijian SMAM. The still-increasing Indian response in 1996 is limited, however, by normative pressures favouring marriage once tertiary education has been completed, and by marriage market pressures. In contrast, the smaller (delayed) Fijian response increases more rapidly, and is relatively unopposed by weaker normative and marriage market pressures. The negative ethnic differential is thus widening slightly. Though the dominant influence of modernisation results in increasing trends in both populations and in a relatively small differential, stronger normative and marriage market pressures in the Indian population result in slight ethnic divergence.
At the medium socioeconomic level, relatively late marriage in 1986 in both populations suggests a significant response to modernisation. As already noted, this response is probably influenced by economic factors, though the influence of norms persists. While both populations experience a decrease in SMAM by 1996 as a result of dominant marriage market pressures, the Indian decrease is greater. The negative ethnic differential thus widens significantly. At the low socioeconomic level, the large ethnic differential in 1986 is consistent with the strong influence of normative differences. The widening differential is the result of greater Indian marriage market pressures, negating the delaying effects of modernisation and forcing SMAM downwards, while the Fijian SMAM slowly increases due to the marginally dominant influence of modernisation.
interval). Indeed, at the high socioeconomic level, barriers to contraceptive use are more easily circumvented by accessing health services with more liberal policies at tertiary institutions, both during, and after completing, tertiary education. (The alternative explanation of increased control of premarital sexual relations is highly unlikely, especially when age at marriage is increasing.) The increased demand for contraceptives is itself a response to modernisation. As a result of these influences, the ethnic differential in MFBI at the high socioeconomic level is slowly converging.
At the medium socioeconomic level, the ethnic differential in MFBI is relatively small in 1986, and decreases slowly over time. The more rapid increase in Fijian MFBI again suggests increased contraceptive use. For Indians, MFBI is constant, reflecting the continuing strength of norms promoting the first birth soon after marriage. At the low socioeconomic level, the constant differential reflects unchanging normative influences in both populations. At this socioeconomic level, it would appear that a response to modernisation has barely begun by 1996.
To a large extent, the ethnic differentials in MAFB depend on the relative strengths of the complex interactions in SMAM and MFBI. At all socioeconomic levels, the differential is becoming smaller (or negative) over time. Convergence at the high socioeconomic level results from greater increases among Fijians in both SMAM and MFBI (see also Section 7.2). At the medium and low socioeconomic levels, divergence results from opposing trends stemming from the strong marriage market effect among Indians. The increase at the medium socioeconomic level in Fijian MAFB, despite decreasing SMAM, is in line with increased contraceptive use by 1996.
When taking the marriage market into account in explaining ethnic differentials, it is pertinent to revisit the role of the minority group hypothesis, which has been shown (Section 5.1) to be consistent with the more rapid transition to lower fertility among Indians than Fijians. As the stronger marriage market effect for Indians stems from their greater fertility decline, the minority group hypothesis has underlying relevance in explaining ethnic differentials in age at marriage, particularly at lower socioeconomic levels.
factors at different times and at different socioeconomic levels in the two populations produce the changing pattern of ethnic differentials in the timing of family formation observed in Fiji in the late 20th century.
7. Case study discussion
This case study has succeeded in providing a satisfactory explanation for the observed ethnic differentials in the timing of family formation, and has significantly increased understanding of the processes involved. This section discusses the strengths and limitations of the case study, the differing conceptual frameworks, and case study findings.
7.1 Strengths and limitations
An important outcome of the case study is the provision of novel information describing the timing of family formation in Fiji. In the absence of data on age at events of interest, indirect methods have been used to provide—for the first time—estimates of the timing of family formation for different socioeconomic subgroups for the Fijian and Indian populations. These estimates form the basis of the explanatory analysis, increasing understanding of the processes of family formation in the two populations.
The analysis has incorporated the dimensions of both time and socioeconomic level within ethnicity, bringing several benefits. Historical data have facilitated both the assessment of the extent to which a response to modernisation had been initiated by 1986, and the identification of the point in time when marriage market pressures change. Further, an examination of trends between 1986 and 1996 has identified recent effects net of fundamental normative differences. Disaggregation by socioeconomic level has shown the different trends and important interactions that underlie population-level differentials, significantly enhancing understanding of marriage market effects.
and Baschieri 2010) incorporate marriage market effects through community-level proxy variables, including relevant-age sex ratios.
Many studies of ethnic differentials in fertility behaviour do not explicitly draw on existing hypotheses (e.g., Torabi and Baschieri 2010). However, studies seeking to explain behaviour in terms of socioeconomic variables using regression-based methods implicitly adopt a framework dictated by the characteristics hypothesis. As noted by Forste and Tienda (1996), this approach subordinates the minority group and norms hypotheses, which are restricted to explaining the residual differential. The attention paid to these hypotheses strengthens this study. The discussion of the minority group hypothesis has taken historical factors into account, and has distinguished between the quantum and timing of fertility. Similarly, the discussion of the norms and interaction hypotheses has identified specific norms that support particular behaviour, rather than attributing residual ethnic differentials to undefined cultural differences. Though the regression-based approach may incorporate proxy variables to capture cultural factors, the approach fails to address the mechanism involved (Forste and Tienda 1996).
The study has several limitations that are related to the method employed. Unlike direct measures, SMAM and MAFB refer to an undefined point in the past. Because the study is restricted to the analysis of indirectly estimated group means, it is not possible to isolate net effects among several independent variables; thus, this study has identified only the main socioeconomic differentials within populations.
A potential limitation is bias in SMAM and MAFB. There are several reasons why biases are unlikely to detract from the conclusions. The analysis of trends at the population level is based on intercensal measures, which avoid biases arising from changing age at first event. Further, concordance at the population-level between single-census values (Table 2) and intercensal values (Figure 1) suggests that the conclusions are not subject to distortion from this bias. Indeed, though the extent of this bias will be greater at socioeconomic levels undergoing more rapid change, the conclusions for Fiji are (if anything) strengthened because this source of bias would serve to underestimate the socioeconomic differentials, particularly where change is in opposite directions, such that ethnic differentials are also underestimated (see Booth 2001 for a full discussion of biases).
and less subject to other influences than most economic and educational variables. For MFBI, biases in the same direction in SMAM and MAFB will cancel, but those in opposite directions will cumulate. Many biases in SMAM and MAFB, including biases due to migration and changing age at first event, are likely to be cancelling. In general, the analysis has focused on broad trends and socioeconomic differentials, limiting the influence of specific biases. The consistency of the results increases confidence in the conclusions.
The use of cross-sectional data is an obvious limitation in a study of the timing of events. In calculating MFBI as the difference between two means, SMAM and MAFB are treated as independent: there is no assumption that these means stem from marriage and first birth in the same individual women. Given the greater association between marriage and first birth among Indians (see Section 7.2), MFBI will more accurately estimate the average of actual first birth intervals of Indians than of Fijians.
The cross-sectional nature of the data also restricts interpretation of the findings by socioeconomic level to association. Even where norms can be drawn upon to illuminate the findings, as in the case of socioeconomic differentials among Indians, causation and reverse-causation are inextricable. Further, the regression equations in Figure 2 should be interpreted with caution, as the conceptual framework differs between populations (Section 7.2); these equations seek only to facilitate comparison. In addition, the comparison of cross-sectional measures over time has been complicated by the definitional change concerning remunerated activity (Section 3.3). Finally, it should be borne in mind that socioeconomic characteristics refer to the time of the census rather than the time of the event.
7.2 Conceptual frameworks
The analysis has provided evidence of the appropriateness of the alternative conceptual frameworks (Section 3.1). For the Indian population, the dominance of Framework A, in which premarital conceptions do not occur (or occasionally precipitate marriage), is apparent from the discussion of norms prohibiting premarital sexual relations (Section 5.2.2); while Framework B, in which premarital conception precipitates marriage, may apply in a small minority of cases, Framework C is clearly inappropriate. Thus, in the Indian case, there is a high degree of dependence of MAFB on SMAM, such that MFBI will approximate the first birth interval for married women. Further evidence for the appropriateness of Framework A is seen in Figure 2. For Indians, SMAM and MAFB are very closely correlated, while SMAM and MFBI are uncorrelated (R2 < 0.13). The
0.06). All three associations are stronger in 1996, and that between MAFB and MFBI (R2 = 0.37) is significant, while the association between SMAM and MFBI remains
non-significant; this strongly supports Framework A.
For the Fijian population, it is apparent from the discussion of norms that Frameworks A, B, and C may apply. Framework A represents the Fijian-Christian ideal. Framework B represents the case in which premarital conception precipitates marriage, including cases in which marriage occurs after the first birth. Framework C represents the case in which the first birth is unrelated to (possible) subsequent marriage. Thus, SMAM and MAFB are less strongly interdependent, and the interpretation of MFBI is less well-defined. A weaker association between SMAM and MAFB is seen in Figure 2, though the correlation coefficient is still highly significant. The dominance in 1986 of Framework B is suggested by the negative MFBI, and is confirmed by the highly significant association between MFBI and SMAM (R2 = 0.37).
Uncorrelated MAFB and MFBI (R2 < 0.01) also indicates that Framework A is less
relevant. In 1996, significant associations between SMAM and MAFB and between MAFB and MFBI (R2 = 0.32), but not between SMAM and MFBI (R2 < 0.01), suggest
that Framework A dominates, though negative MFBI still occurs. In both years, the possibility that Framework C also applies is supported by the relatively weak association between SMAM and MAFB. These results support the view that a changing mix of all three frameworks applies. The change in dominance from Framework B in 1986 to Framework A in 1996 is in keeping with an increased use of contraceptives before marriage in 1996 (Section 6.5).
7.3 Case study findings
The 1986 finding in both populations of earlier marriage among remunerated women with tertiary education, compared with remunerated women with secondary education, is anomalous in terms of these extant findings. The restriction to remunerated women may affect this finding, as it does not apply to educational differentials for all workers. The small numbers of women with tertiary education and the limitations of the measure employed may—together with the substantive reasons already discussed (Section 6.2)—help to explain this anomaly. It is also the case that most studies relating fertility behaviour to education employ a much lower cut-off to define the highest educational category (e.g., Singh and Samara 1996; Yabiku 2005), though a monotonic increase in age at marriage is found at all levels up to tertiary education in East and Southeast Asia (Jones and Gubhaju 2009). The relationship between higher levels of education, employment, and family formation in developing countries warrants further investigation.
This study has found decreasing age at marriage at medium and low socioeconomic levels, and has explained these in terms of socioeconomically differentiated net effects of modernisation and marriage market pressures. Similar factors may explain some of the contradictory findings noted by Jejeebhoy (1995) in studies addressing the relationship between education and age at marriage over time. Previous studies of the changing timing of family formation have not taken this more complex factor into account, as they have incorporated either socioeconomic level or marriage market pressures, but not both (e.g., Mensch, Singh, and Casterline 2006, Quisumbing and Hallman 2006). Socioeconomically differentiated net effects of modernisation and marriage market pressures may partly explain the contradictory results and weak associations reported in such studies.This study has demonstrated that trends at the population level may mask opposing subgroup trends.
Finally, the finding that none of the hypotheses commonly used to explain fertility differentials by ethnicity, nor a combination of hypotheses, adequately explains the observed differentials supports previous findings (Knodel et al. 1999). The inconsistency of the minority group hypothesis with trends in the timing of family formation, but consistency with trends in the fertility quantum, is in line with findings that delayed marriage is not a deliberate means of fertility decline (McDonald 1981; Caldwell, Reddy, and Caldwell 1983).
8. Conclusions
understanding ethnic differentials in the timing of family formation in the context of transition.
8.1 Limitations of existing hypotheses
As has already been noted, the shortcomings of the four hypotheses are their failure to address, or to fully address, the dimensions of socioeconomic level and time. These restrictions limit the applicability of the norms, characteristics, and interaction hypotheses. The norms hypothesis does not explicitly address modernisation and the role of norms in the emergence of socioeconomic differentials within an ethnicity.
The explanatory power of the characteristics hypothesis in explaining differentials at the population level is limited to the effect of socioeconomic composition in the hypothetical situation in which there is no statistical interaction between a socioeconomic characteristic and ethnicity. By ignoring interactions, this hypothesis may predict ethnic differentials that are in the opposite direction of those observed. It is also possible for compositional differences to mask differentials at the population level that exist at the subgroup level.
As noted by Knodel et al. (1999), the interaction hypothesis (despite its name) also fails to take into account true interactions or different responses by ethnicity to socioeconomic level. This hypothesis is also limited by its failure to take time into account: though formulated in the context of transition, the hypothesis seeks only to explain cross-sectional differentials, and takes no account of the consequences of transition. When the inevitable marriage market effects are ignored, the relative responses to modernisation are likely to be misjudged.
In practice, the interaction hypothesis is also limited by its assumptions. In particular, assumed identical pre-transitional fertility behaviour is likely to be violated in populations differentiated by ethnicity, leading to potential misinterpretation. Assumed convergence at the population level in the post-transitional period takes no account of socioeconomic compositional differences between populations, the effects of which also operate throughout the transition. Bongaarts (2003) showed that educational differentials in fertility persist throughout and after transition.
hypothesis may be consistent with observations only at certain socioeconomic levels. Thus, it may be necessary to separately consider hypotheses in relation to different aspects of fertility behaviour and different subgroups of the population.
8.2 A more comprehensive approach
It is evident that a more comprehensive approach than those encompassed by the four hypotheses is needed to address ethnic differentials in the timing of family formation. While the elements of these hypotheses are not to be ignored, two missing dimensions identified in this study are socioeconomic level within ethnicity and time. The importance of taking all relevant dimensions into account in order to explain ethnic differentials in fertility behaviour is in keeping with Hirschman (1994) and Forste and Tienda (1996). The importance of incorporating the dimension of time is noted by Forste and Tienda (1996).
It has been shown that a temporal dimension is essential, not simply for the examination of trends, but in order to take potential marriage market effects of previous fertility transition into account. Both socioeconomic level and time are necessary to capture the inevitable socioeconomically differentiated net effects of modernisation and marriage market pressures in any population in the later stages of fertility transition, and these dimensions are essential to the understanding of ethnic differentials because of the potential complex interaction between ethnicity and socioeconomic level in the response to modernisation balanced against ethnically differentiated marriage market pressures.
This study has used simple methods to identify the complexity of processes governing ethnic differentials in the timing of family formation in the context of transition in a population with well-defined marriage markets. Such complexity is likely to exist in other populations, including those for which population-level ethnic differentials are less pronounced, or marriage markets are less clearly defined. Further research, based on individual longitudinal data and the detailed dynamics of the marriage market, and employing more sophisticated methods, is needed to examine these complexities in greater detail.
9. Acknowledgments
References
Agarwala, S.N. (1962). Age at Marriage in India. Allahabad: Kitab Mahal.
Arnaldo, C. (2004). Ethnicity and marriage patterns in Mozambique. African Population Studies 19(1): 143-164.
Australian Agency for International Development (1995). The Economy of Fiji: Supporting Private Investment. International Development Issues No. 40. Canberra: Commonwealth of Australia.
Bavadra, T. U. and Kierski, J. (1980). Fertility and family planning in Fiji. Studies in Family Planning 11(1): 17-23.doi:10.2307/1965893.
Bedford, R.D. and Levick, W. (1988). Recent Migration from Fiji to New Zealand. New Zealand Population Review 14(1): 69-81.
Bongaarts, J. (2003). Completing the fertility transition in the developing world: the role of educational differences and fertility preferences. Population Studies
57(3): 321-336.doi:10.1080/0032472032000137835.
Booth, H. (1994a). The Estimation of Levels and Trends in Age at First Birth and Age at First Marriage in the Pacific Islands. Canberra: Australian National University. (Working Papers in Demography 45. Online: http://adsri.anu.edu.au/pubs/demography_papers.php.)
Booth, H. (1994b). Women of Fiji: A Statistical Gender Profile. Suva: Department for Women and Culture.
Booth, H. (1999). Gender, power and social change: youth suicide among Fiji Indians and Western Samoans. Journal of the Polynesian Society 108(1): 39-68.
Booth, H. (2001). Trends in mean age at first birth and first birth intervals in the Pacific Islands. Genus LVII(3-4): 165-190.
Brenneis, D. (1979). Conflict in Bhatgaon: the search for a third party. In: Subramani (ed.). The Indo-Fijian Experience. St Lucia: University of Queensland Press: 41-56.
Bureau of Statistics (1976). Fiji Fertility Survey 1974 - Principal Report. Suva: Government Printer.
Bureau of Statistics (1998b). 1996 Fiji Census of Population and Housing: Analytical Report, Part 1 Demographic Characteristics. Parliamentary Paper No 49. Suva: Parliament of Fiji.
Caldwell, J.C., Reddy, P.H., and Caldwell, P. (1983). The causes of marriage change in South India. Population Studies 37(3): 343-361.doi:10.2307/2174503.
Chamie, J. (1981). Religion and Fertility: Arab Christian-Muslim Differentials. Cambridge: Cambridge University Press.
Chand, A. (1995). The needy children of Fiji: a development flaw? Pacific Health Dialog 2(1): 51-56.
Chandra, D. (2000). Understanding socio-cultural factors affecting demographic behaviour and the implications for the formulation and execution of population policies and programmes. UNESCO-UNFPA Interregional Project – INT/92/P78. Country Report for Fiji. Suva: University of the South Pacific. Chandra, R. and Chandra, D.W. (1990). Population size, growth, composition, and
distribution in Fiji. In: Chandra, R. and Bryant, J. (eds.) Population of Fiji. Nouméa: South Pacific Commission: 18-29.
Cheung, P., Cabigon, J., Chamratrithirong, A., McDonald, P.F., Syed, S., Cherlin, A., and Smith, P.C. (1985). Cultural variations in the transition to marriage in four Asian societies. International Population Conference, Florence 1985 Volume 3. Liège: International Union for the Scientific Study of Population: 293-308. Clegg, E.J. (1988). Aspects of fertility in Suva, Fiji. Journal of Biosocial Science 20(3):
295-311.doi:10.1017/S0021932000006635.
Forste, R. and Tienda, M. (1996). What's Behind Racial and Ethnic Fertility Differentials? Population and Development Review Vol. 22, Supplement: Fertility in the United States: New Patterns, New Theories: 109-133.
Goldscheider, C. (1971). Population, Modernization and Social Structure. Boston: Little, Brown and Company.
Gupta, A.R. (1976). Women in Hindu Society: as Study of Tradition and Transition. New Delhi: Jyotsna Prakashan.
Hajnal, J. (1953). Age at marriage and proportions marrying. Population Studies 7: 111-132.doi:10.2307/2172028.
Herbst, P.H. (1976). Ethnic conflict in urban Fiji. [PhD thesis]. Cornell University. Hirschman, C. (1985). Premarital socio-economic roles and the timing of family
formation: a comparative study of five Asian societies. Demography 22(1): 35-59.doi:10.2307/2060985
Hirschman, C. (1994). Why fertility changes. Annual Review of Sociology 20: 203-233. doi:10.1146/annurev.so.20.080194.001223.
Hull, T. and Hull, V. (1973). Fiji: a study of ethnic plurality and family planning. In: Smith, T.E. (ed.). The politics of family planning in the Third World. London: Allen and Unwin: 168-216.
Jejeebhoy, S.J. (1995). Women’s education, autonomy, and reproductive behaviour: Experience from developing countries. Oxford: Clarendon Press.
Jones, G.W. and Gubhaju, B. (2009). Factors influencing changes in mean age at first marriage and proportions never marrying in the low-fertility countries of East and Southeast Asia. Asian Population Studies 5(3): 237-265. doi:10.1080/17441730903351487.
Knodel, J., Gray, R.S., Sriwatcharin, P., and Peracca, S. (1999). Religion and reproduction: Muslims in Buddhist Thailand. Population Studies 53(2): 149-164. doi:10.1080/00324720308083.
Lal,B.V. (1988). Power & Prejudice, The Making of the Fiji Crisis. Wellington: New Zealand Institute of International Affairs.
Laquian, A. and Naroba, V. (1990). Family planning in Fiji. In: Chandra, R. and Bryant, J. (eds.). Population of Fiji. Nouméa: South Pacific Commission: 111-119. Lateef, S. (1990). Purdah in the Pacific: Subordination of Indian Women in Suva. [PhD
thesis]. Melbourne: Monash University.
Lesthaeghe, R., Kaufmann, G., and Meekers, D. (1989). The nuptiality regimes in sub-Saharan Africa. In: Lesthaeghe, R. (ed.). Reproduction and Social Organization in Sub-Saharan Africa. Berkeley: University of California Press: 238-337.
Lukere, V. (1997). Mothers of the Taukei: Fijian women and the ‘decrease of the race’. [Unpublished PhD thesis]. Australian National University.
Marini, M.M. (1981). Measuring the effects of the timing of marriage and first birth.
Journal of Marriage and the Family 43(1): 19-26.doi:10.2307/351414.
Mayer, A.C. (1973). Peasants in the Pacific: A Study of Fiji Indian Rural Society. Berkeley and Los Angeles: University of California Press (2nd edition).
McArthur, N. (1971). Fertility and marriage in Fiji. Human Biology in Oceania 1(1): 10-22.
McDonald, P. (1981). Social change and age at marriage. International Population Conference, Manila 1981 Volume 1. Liège: International Union for the Scientific Study of Population: 413-431.
Mensch, B.S., Singh, S., and Casterline, J.B. (2006). Trends in the timing of first marriage among men and women in the developing world. In: Lloyd, C.B., Behrman, J.R., Stromquist, N.P., and Cohen, B. (eds.). The Changing Transitions to Adulthood in Developing Countries: Selected Studies.
Washington, D.C.: The National Academies Press: 118-171.
Naroba, V.L. (1990). Fertility trends and differentials in Fiji. In: Chandra, R. and Bryant, J. (eds.). Population of Fiji. Nouméa: South Pacific Commission: 92-110. Nayacakalou, R.R. (1955). The Fijian system of kinship and marriage. Journal of the
Polynesian Society 64(1): 44-45.
Nayacakalou, R.R. (1978). Tradition and Change in the Fijian Village. Suva: South Pacific Social Sciences Association.
Pulea, M. (1986). The family, law and population in the Pacific Islands. Suva: University of the South Pacific.
Quisumbing, A.R. and Hallman, K. (2006). Marriage in Transition: Evidence on Age, Education, and Assets from Six Developing Countries. In: Lloyd, C.B., Behrman, J.R., Stromquist, N.P., and Cohen, B. (eds.). The Changing Transitions to Adulthood in Developing Countries: Selected Studies.
Washington, D.C.: The National Academies Press: 200-269.
Ravuvu, A. (1983). The Fijian Way of Life. Suva: University of the South Pacific. Reproductive and Family Health Association. (1996). Annual Report. Suva.
Roizen, J., Gyaneshwar, R., and Roizen Z. (1992). Where is the planning in family planning? Fiji after three decades of family planning programmes.