ISSN: 2278-7461, www.ijeijournal.com
Volume 1, Issue 3 (September 2012) PP: 06-11
Bit Error Rate of Mobile Wimax (Phy) Under Different
Communication Channels and Modulation Technique
T.Manochandar
1, R.Krithika
21
Department of Electronics and Communication Engineering, VRS College of engineering and technology, Villupuram- 607 107.TamilNadu
2Department of Electronics and Communication Engineering, E.S College of engineering and technology, Villupuram-605 602.TamilNadu
Abstract––Mobile Wimax is a broadband wireless solution that enables the convergence of mobile and fixed broadband network, through a common wide area broadband radio access technology and flexible network architecture. The Performance of mobile Wimax under varying channel is one of the interesting research interests. Most of the most existing systems, based on performance and evaluation under channel condition are limited to AWGN, ITU etc in mobile Wimax. In this paper the performance of mobile Wimax (PHY layer) under SUI channel models in addition to different data rates and modulation techniques were analyzed. The simulation covers important performance parameters like Bit Error Rate and Signal to Noise Ratio.
Keywords––Wimax, BER, SNR, BPSK, OFDMA
I.
INTRODUCTION
IEEE802.16e is a global broadband wireless access standard capable of delivering high data rates to fixed users as well as portable and mobile ones over long distance [1].In mobile Wimax air interface adopts orthogonal frequency division multiple access (OFDMA) for improved multi-path performance in non-line-of sight (NLOS) environment.Mobile Wimax extends the OFDM PHY layer to support terminal mobility and multiple–access. The resulting technology is Scalable OFDMA. Data streams to and from individual users are multiplexed to groups of sub channel on the downlink anduplink. By adoptingScalable PHY architecture, mobileWimax is able to support a wide range of bandwidths.
The performance of theWiMAX (Worldwide Interoperability for Microwave Access) can be evaluated by using the Stanford University Interim (SUI) channel models which has a set of six channels for terrain types [3].With different data rates, coding schemes and modulation techniques.
The mobile WiMAX standard builds on the principles of OFDM by adopting a Scalable OFDMA-based PHY layer (SOFDMA) [4]. SOFDMA supports a wide range of operating bandwidths to flexibly address the need for various spectrum allocation and application requirements.
The simulation done in the paper covers important performance such as Bit Error Rate and Signal to Noise Ratio.
II.
WIMAX PHYSICAL LAYER
This project deals with the performances of Bit Error Rate and Signal to Noise Ratio in mobile WiMAX physical layer. The block diagram of the physical layer of mobile WiMAX diagram is given in Figure 1. The transferring of data or receiving the data is done through the physical layer of WiMAX. So the uplink and the downlink of the message were done on the physical layer of WiMAX. There are three levels in the physical layer of mobile WiMAX physical layer are
Bit level processing
OFDM symbol level processing
Digital IF processing
.
Figure: 1. Block Diagram of Wimax Physical Layer
Table.1 Parameter of mobile wimax physical layer
Parameter Value
FFT size 128 512 1024 2048
Channel
Bandwidth(MHz)
1.25 5 10 20
Subcarrier Frequency spacing
(KHz)
10.94
Useful Symbol Period 91.4
Guard Time 1/32,1/8,1/6,1/4
III.
CHANNEL
Where,
Y (f) ->output signal H (f) ->channel response X (f) ->input signal
A. Stanford University Interim (SUI) Channel Models:
It is a set of six channel models representing three terrain types and a variety of Doppler spreads, delay spread and mainly the line-of-sight/non-line-of-site conditions that are typical of the continental. The terrain type A, B, C is same as those defined in Erceg model [10]. The multipath fading is modeled as a tapped delay line with 3 taps with non-uniform delays. The gain associated with each tap is characterized by a Rician Distribution and the maximum Doppler frequency.
In a multipath environment, the received power r has a Rician distribution, whose Pdf is given by:
A is zero if there is no LOS component and the pdf of the power becomes
This is also known as Raleigh distribution.
The ratio K=A2/ (2σ2) in the Rician case represents the ratio of LOS component to NLOS component and is called the "K-Factor" or "Rician Factor."
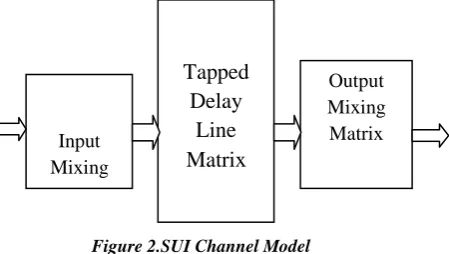
The general structure for the SUI channel model is as shown below in figure. This structure is for Multiple Input Multiple Output (MIMO) channels and includes other configurations like Single Input Single Output (SISO) and Single Input Multiple Output (SIMO) as subsets.
Figure 2.SUI Channel Model
Power Distribution For each tap a set of complex zero-mean Gaussian distributed numbers is generated with a variance of 0.5 for the real and imaginary part, so that the total average power of this distribution is 1. This yields a normalized Rayleigh distribution (equivalent to Rice with K=0) for the magnitude of the complex coefficients. If a Rician distribution (K>0 implied) is needed, a constant path component m is added to the Rayleigh set of coefficients. The ratio of powers between this constant part and the Rayleigh (variable) part is specified by the K-factor. For this general case, we show how to distribute the power correctly by first stating the total power P of each tap:
P=|m2|+σ2
Where mis the complex constant and σ2 the variance of the complex Gaussian set. Second, the ratio of powers is K=m2/|σ2|.
Table 2: Terrain type and Doppler spread for SUI channel model
Channel Terrain Type
Doppler spread
Spread LOS
SUI-1 C Low Low High SUI-2 C Low Low High
SUI-3 B Low Low Low
SUI-4 B High Moderate Low
SUI-5 A Low High Low SUI-6 A High High High
Pdf(r)=r/σ2
e(-r2/2σ2) 0 ≤ r ≤ ∞
Pdf(r)=r/σ2
e[-frac2+A2σ2]Io(rA/σ2) 0 ≤ r ≤ ∞
In the SUI channel model, parameter for the SUI 1 and SUI 2 channel model has been tabulated in 3 and 4 respectively for the reference. BER performance is evaluated in this channel models. Depending on the performance parameter for the SUI channel, the performances of wimax physical layer are evaluated through the performance graph.
.
For a 300 antenna beam width, 2.3 times smaller RMS delay spread is used when compared to an omnidirectional antenna RMS delay spread. Consequently, the 2nd tap power is attenuated additional 6 dB and the 3rd tap power is attenuated additional 12 dB (effect of antenna pattern, delays remain the same). The simulation results for all the six channels are evaluated. The above experiments are done using the simulation in Matlab communication tool box.
IV.
SIMULATION RESULTS
Figure3.BER curve for BPSK modulation
The output for the performance of mobile WiMAX was estimated by the Bit Error Rate and the Signal to Noise Ratio plot using the MATLAB coding with Quadrature Phase Shift Keying modulation technique is given below in figure 4.
Figure 4. BER curve for QPSK modulation
The output for the performance of mobile WiMAX was estimated by the BER and the SNR plot using the MATLAB coding with 16QAM modulation. It is illustrated in the figure5.
The output for the performance of mobile Wimax was estimated by the BER and the SNR plot using the MATLAB coding with 64QAM modulation and graphical illustration done as in figure 6.
Figure6. BER curve for 64QAM modulation
V.
CONCLUSION
In this paper, the performance of mobile WIMAX physical layer for OFDMA on different channel condition assisted by Mobile IP(Internet protocol) for mobility management was analyzed. The analysis demonstrated that the modulation and coding rate had a greater impact on the relative performance between the different SUI channel conditions. The performance was analyzed under SUI channel models with different modulation techniques for mobility management. It is found from the performance graphs that SUI channel 5 and 6 performs better than the conventional ones.
REFERENCES
1. IEEE 2010 Omar Arafat,K.Dimyati, a study of physical layer of Mobile WiMax under different communication channels & modulation technique.
2. [2]IEEE std 802.16 Etm-2004”Part 16:Air Interface for fixed and mobile broadband wireless Access system,”Feb 2004.
3. Md.ZahidHasan,Md.AshrafulIslam, Comparative Study of Different Guard Time Intervals to Improve the BER Performance of WiMAX Systems to Minimize the Effects of ISI and ICI under Adaptive Modulation Techniques over SUI-1 and AWGN Communication Channels, (IJCSIS) International Journal of Computer Science and Information Security,Vol. 6, No.2, 2009.
4. IEEE 802.16 Broadband Wireless Access Working Group Simulating the SUI Channel Models Li-Chun Wang Department of Communications Engineering National Chiao Tung University Hsinchu,Taiwan.
5. Mai Tran, G Zaggaoulos and A .Nix” Mobile WiMAX MIMO performance Analysis: Downlink and Uplink”, PIMRC 2008.
6. J.G.Andews, A.Ghoshand R.Muhamed,” Fundamentals of WiMAX Understanding broadband Wireless Networks, “Prentice Hall, Feb 2007.
7. RajJain,@aum.org,”ChannelModelaTutorial”, feb21,2007 submitted to wimax forum at aum.
8. M.S. Smith and C. Tappenden, “Additional enhancements to interim channel models for G2 MMDS fixed wireless applications,” IEEE 802.16.3c-00/53
9. M.S.Smith, J.E.J. Dalley, “A new methodology for deriving path loss models from cellular drive test data”, Proc.AP2000 Conference, Davos, Switzerland, April 2000.
10. V. Erceget.al, “A model for the multipath delay profile of fixed wireless channels,” IEEE JSAC, vol. 17, no.3, March 1999, pp. 399-410.
11. L.J.Greenstein, V. Erceg, Y.S. Yeh, and M.V. Clark, “A new path-gain/delay-spread propagation model for digital cellular channels,” IEEE Trans. Veh. Technol., vol. 46, no. 2, May 1997.
12. J.W. Porter and J.A. Thweatt, “Microwave propagation characteristics in the MMDS frequency band,” ICC’2000 Conference Proceedings, pp. 1578-1582.