Abstract— Arthritis is a form of joint disorder that involves inflammation of one or more joints. Rheumatoid arthritis (RA) and osteoarthritis (OA) are well-known examples of rheumatic diseases that can cause pain and severe damage to joints in the entire body. Often the first signs of these diseases are noted in the joints of the hands and feet. Besides pain and swelling noted by the patient, there are effects that can be better seen on a radiograph. Osteoarthritis (OA) detection particularly by hand radiograph is difficult in assessing, since the change in cartilage volume in finger joint are minute and an expertise assessment is required to obtain accuracy in detection of abnormalities. Present hand radiograph analysis technique is tedious and prolonged besides being unreliable. By using digitized radiographs it is possible to make complex measurements and to automate time-consuming tasks. Inspite of distinct attempts are being pursued, these techniques are not yet a common practice in rheumatology. In this paper we present how image processing techniques can be applied to assess bone damage. We have explicitly concentrated our efforts on hand radiograph for finger joint space width measurement(JSW).This method gives automatic detection and measurement of joint space width with help of improved algorithm, also it is easy accurate and highly reliable to notice very small changes that may occur to the effected person. Index Terms— Arthritis, image processing,joint space width measurement , Osteoarthritis, Radiograph, Rheumatoid.
I. INTRODUCTION
Rheumatoid arthritis (RA) is a chronic systemic inflammatory autoimmune disease that causes pain swelling and stiffness in synovial joints . Multiple joints are usually affected in a symmetric pattern on both sides of the body. The estimated prevalence rate is approximately 1% worldwide, with women more than twice as likely to develop the disease as men . RA can occur at all ages, but often the most probable ages is from 30 to 50. The reason by which RA is
caused is still unknown, but it is suspected that genetic, environmental, hormonal and infectious factors play a major role . There are activity changes noticed in these diseases over time, for a period of time the rate of tissue inflammation decreasing and symptoms disappearing. Radiographs of hands and feet are often used to monitor the progression of joint damage caused by RA .Various methods have been proposed to analyze joint damage using these radiographs . Some make use of classification scores for joint erosions and deformations. Other methods are based on relative or absolute measurements, for example by determining the carpal/metacarpal ratio, the JSW and erosion volume. In general these methods are time-consuming and depend on subjective visual readings . In an
early stage of RA it is important that the applied scoring method is sensitive to small changes over time, so the effects of medication can be monitored closely and treatments altered if necessary.
To eliminate observer dependency and to make the assessment procedure faster, more accurate and affordable, computer-assisted analysis may contribute to better disease treatment. Several people have been inspired by these possibilities in field of rheumatology. Use of image processing techniques to analyze radiological joint damage is carried out.
To enable automated assessment of joint damage in
radiographs, one has to go through several image processing steps.
1. A pre-processing step is often required to prepare the image for further analysis; for example contrast improvement, noise reduction, scaling and the removal of artifacts.
2. The regions of interest is detected. For hand radiographs. It is a crucial task when severe joint damage is present.
3.
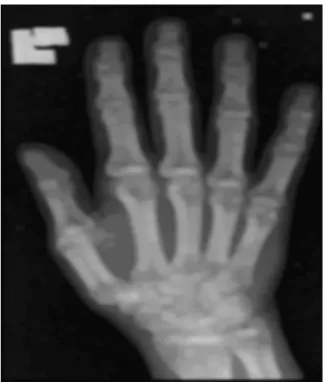
Various image segmentation and edge detection methods can be used to determine the representation of the pixels. After the objects within the image have been determined, measurements can be done .Fig-1: Hand Anatomy
Automatic finger bone joint space width
measurement and analysis
II. PREPROCESSING Gaussian Filtering
Gaussian filtering is used to remove noise. It also blurs the image along
In one dimension, the Gaussian function is: g x = 1
2π σ . e −x 2
2σ2…..(1)
σ : standard deviation of the given distribution. The distribution is assumed to have a mean of 0.
Shown graphically, we see the familiar bell shaped Gaussian distribution.
Fig -2: Shape of the impulse response of a typical Gaussian filter
Fig -3 : Input imageprocessed by a Gaussan filter. III. BINARIZATION USING OTSU METHOD
Otsu’s method automatically perform image thresholding based on clustering or it reduces a grey level image to a binary image. It is assumed that the image consist two classes of pixels following bi-modal histogram, then calculation of the optimum threshold separating the two classes is done, so that their combined spread is minimal. In
Otsu's method threshold that minimizes the intra-class variance is searched extensive, weighted sum of variances of the two classes is defined as a:
σ ω2(t)=ω1(t)σ12(t)+ω2(t)σ22(t) ...(2)
Weights ωi gives probabilities of the two classes separated
by a threshold t and σi2 variances of these classes.
Minimizing the intra-class variance is equivalent to maximizing inter-class variance
σb2(t)=σ2-σω2(t)=ω1(t)*ω2(t)[μ1(t)-μ2(t)]2 …..(3)
It can be expressed in terms of class probabilities ωi and
class means μi.
ω1(t) is the class probability obtained from the histogram
as t:
ω1(t)=Σ0t p(i) …..(4)
whereas the class mean μ1(t) is:
μ1(t)= [Σ0t p(i) χ(i)] / ω1 …..(5)
where χ(i) is the value at the center of the ίth histogram bin. Similarly, you can compute ω2(t) and μ2(t) on the right-hand
side of the histogram for bins greater than t.
The class probabilities and class means can be obtained iteratively.
Algorithm:
1. Compute histogram and probabilities of each intensity level
2. Set up initial ωi(0) and μi(0)
3. Step through all possible thresholds t=1…. maximum intensity
1. Update ωi and μi
2. Compute σb2(t)
4. Desired threshold corresponds to the maximum σb2(t)
5. You can compute two maxima (and two corresponding thresholds). σb12(t) is the greater
max and σb22(t) is the greater or equal maximum
6. Desired threshold = (threshold1+threshold2)/2
IV. THINNING
Thinning algorithm is a Morphological operation that is used to remove selected foreground pixels from binary images. It maintains the extent and connectivity of the original region. Figure 4 shows the result of a thinning operation on a simple binary image.
(a) Original Image (b) Thinned Image
Fig - 4: Thinning process Here Stentiford Thinning algorithm is used
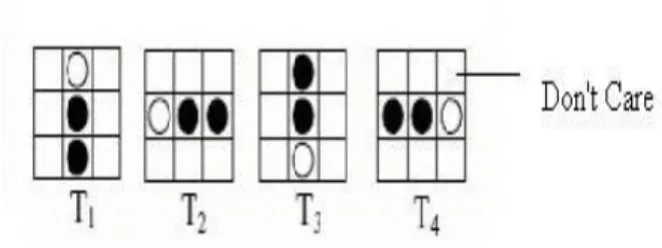
It uses a set of four 3 x 3 templates to scan the image. Figure 5 shows these four templates.
Fig - 5: Stentiford templates Stentiford Algorithm is given as:
a)First the pixel location whose pixels matches that of template T1 is located(i, j).With template T1 all pixels along the top of the image are removed moving from left to right and from top to bottom.
b) If the central pixel is not an endpoint, and has connectivity number = 1, then mark this pixel for deletion. c) Repeat steps 1 and 2 for all pixel locations matching T1. d) Repeat steps 1-3 for the rest of the templates: T2, T3, and T4.
Pixels on the left side of the object are first matched by T2, tracing from bottom to top and from left to right.
Pixels along the bottom of the image are selected by T3 and move from right to left and from bottom to top.
pixels tracing from left to right and from top to bottom on the right side of the object is done by T4 template [17]. e) Set to white the pixels marked for deletion.
Figure 6 shows some examples of the thinning process using the Stentiford Algorithm.
Fig - 6: Examples of the Stentiford thinning process
V. BRANCHES ANALYSIS
In Branch analysis, appropriate branches are obtained from all of branches. Initially, however, branches have to
be obtained from the skeleton, which can be in done in two steps:
(a) all of the end pixels in the skeleton are identified (b) from each constitute branch a path is created from end pixel to first cross pixel.
Doing this appropriate branches are obtained and pseudo branches are eliminated. The proposed algorithm is presented in the pseudo-Branch-Elimination procedure (procedure 1).
1. candidate list is added with all the branches and one of them is considered as the root branch explicitly.
2. Then, every branch length is verified,
and it is compared with quarter of the image height depending upon this decision is taken whether the branch is pseudo branch and required to be deleted. 3. If the finishing pixels of any two branches meet
each other, one of them is deleted from the candidates list.
4. Following steps are performed on the remaining branch:
(a) a pixel which was earlier determined as end pixel now becomes a middle pixel, (b) hence there is no end pixel, in order to
become a end pixel,
the first following cross pixel is searched from the image
5. The procedure works as long as the remain mark is true—unwanted branches are eliminated in the previous loop . Thinning results are applied to the image to which Gaussian filter is applied. After applying pseudo -Branch-Elimination the procedure ends and returns five proper branches as those shown in Figure 7 and one root branch, which is then deleted from the candidates list .
Fig -7: Five proper branches obtained from pseudo- Branch-Elimination procedure applied to the input image
VI. JOINT SPACES LOCATION
From the above step, every finger acquire its own start pixel and a one pixel thick branch passing through it
Five appropriate branches are selected from previous stage. Branch that runs along the finger and is in a remarkable position compared with any other branch locate in that finger is the desired branch . Since each of the five proper branches traverse through the middle of a corresponding finger, every start pixel and a proper branch are now used to compute the joint locations[16]. Every proper branch traverse through both interphalangeal joint spaces – naturally only through one in the case of the thumb.
Due to this regularity, it is possible to create a profile plot utilizing the values of the pixels underneath the proper branch and use it to work out the precise location of the joint space.
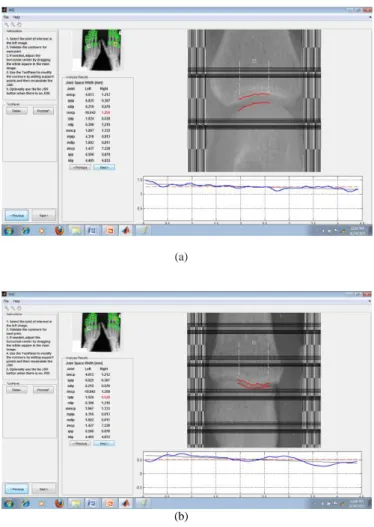
To obtain minimal joint space width, the area of analysis of each joint is narrowed to the region of interest. Then traversing through these branches is done and the intensity variation along with it is noted. If there is a drastic change in the intensity then it is marked as a border of the joint. This process is carried out throughout the branch and every branch that exist. Measurement of width with help of upper and lower margin marked by above step.
Fig -8: Detection of phalangeal joints.
(a)
(b)
Fig -9: (a) & (b) shows marking of upper and lower margin
of phalangeal joints along with JSW measurement
REFERENCES
[1] Andrzej Bieleckia,, Mariusz Korkoszb, Bartosz Zielin,“ Hand radiographs preprocessing, image representation in the finger
regions and joint spacewidth measurements for image
interpretation”, vol. 65, no. 6, pp. 3786 -- 3798, 2008.
[2] Joost A. Kauffman Prof.dr.ir. A.J. Mouthaan Universiteit Twente promotor: Prof.dr.ir. C.H. Slump Universiteit Twente assistent promotor: Dr. H.J. Bernelot Moens Ziekenhuisgroep Twente leden, ―Automated
radiographic assessment of hands in rheumatoid arthritis‖ vol. 15 pp. 261– 265 November 2004.
[3] Georg Langs*, Philipp Peloschek, Horst Bischof*, and Franz Kainberger, ―Automatic Quantification of Joint Space Narrowing‖ IEEE TRANSACTIONS ON MEDICAL IMAGING, VOL. 28, NO. 1, JANUARY 2009 151
[4] Sashidharan Komandur, Peter W. Johnson, Richard L. Storch, and Michael G. Yost,―Relation between Index Finger Width and Hand Width Anthropometric Measures‖
31st Annual International Conference of the IEEE EMBS Minneapolis, Minnesota, USA, September 2-6, 2009
[5] San Francisco, CA, USA, April 7-11, 2013 Yinghe Huo⋆† Koen L. Vincken⋆ Max A. Viergever⋆ Floris P. Lafeber†, ― Automatic joint detection in rheumatoid arthritis hand radiographs‖ 2013 IEEE 10th International Symposium on Biomedical Imaging: From Nano to Macro [6] Bivind Due Trier and Ani1 K. Jain, ―Goal-Directed Evaluation of Binarization Methods.‖ IEEE transactions on pattern analysis and machine intelligence, vol 17, no 12, December 1995
[7] YiWan, Jiangchang Wang, Xingbo Sun, Ming Hao,‖ A Modified Otsu Image Segment method .Based on the Rayleigh Distribution‖. 2010 IEEE
[8] N. Ostu,‖ A threshold selection method from gray-level Histograms‖ ,IEEE Transactions on Systems, Man, Cy- bernetics, SMC- Vol 9, 1979, pp.62-66.”.
[9] Automatic quantification of osteoarthritis in hand radiographs validation of a new method to measure joint space width, Osteoarthritis and Cartilage 16 (1) (2008) 18–25. R. Klooster, E.A. Hendrics, I. Watt, M. Kloppenburg, J.H.C. Reiber, B.C.Stoel
[10] M. Liang, J. Esdaile, J. Klippel, P. Dieppe, Impact and Cost Effectiveness of Rheumatologic Care in Rheumatology, Mosby International, London, 1998
[11] M.S. Atkins, B.T. Mackiewich, Fully automatic segmentation of the brain in MRI, IEEE Trans. Med. Imaging 17 (1) (1998) 98–107.
[12] R. Klooster, E.A. Hendrics, I. Watt, M. Kloppenburg, J.H.C. Reiber, B.C. Stoel, Automatic quantification of osteoarthritis in hand radiographs: validation of a new method to measure joint space width, Osteoarthritis and Cartilage 16 (1)
(2008) 18–25
[13] T. T.Withaar, J. A. Kauffman, and H. J. B.Moens, ―Analyzing the precision of JSW measurements using 3D scans and statistical models,‖ in Proceeding of SPS-DARTS 2006, the second annual IEEE Benelux/DSP Valley Signal Processing Symposium (W. Philips, ed.), (Antwerp, Belgium), pp. 123–126 IEEE Benelux EMBS, March 2006.
[14]
W.Shiel,―Rheumatoidarthritis.‖Website,2007.http://www.medicinenet.com/ rheumatoid_arthritis/article.htm.
[15] Andr_es Barre, ―Local Fuzzy c-Means Clustering for Medical Spectroscopy Images‖ applied Mathematical Sciences, Vol. 5, 2011, no. 30, 1449 – 1458
[16] R. Khurana, S.M. Berney, ―Clinical aspects of rheumatoid arthritis, Pathophy- siology
―VOL.12 (2005) 153–165
[17] Morphological-Thinning :
http://homepages.inf.ed.ac.uk/rbf/HIPR2/thin.htm
[18] ―Digital Image Processing‖ by Rafael C. Gonzalez and Richard E. Woods 3rd Edition
BIOGRAPHIES
Mrs Swati Bhisikar is an assistant professor at JSPM’s Rajarshi Shahu College of Engineering. Has very good knowledge and is interest in image processing . Has published her papers in various domain .
Ms Priyanka Bagule is a undergraduate student at JSPM’s Rajarshi Shahu College of Engineering. Has also worked on other projects in image processing such as face detection and feature extraction.
Ms Geetanjali Bhoir is a undergraduate student at JSPM’s Rajarshi Shahu College of Engineering. Has keen interest in image processing and has good knowledge in biomedical Ms Priyanka Fernando is a undergraduate student at JSPM’s Rajarshi Shahu College of Engineering. Interested in Application of image processing for biomedical