Downloaded from:
http://e-space.mmu.ac.uk/624309/
Publisher:
Elsevier BV
DOI:
https://doi.org/10.1016/j.chb.2019.106189
Please cite the published version
Hajra Waheed, Saeed-Ul Hassan, Naif Radi Aljohani, Julie Hardman, Raheel Nawaz
PII: S0747-5632(19)30401-7
DOI: https://doi.org/10.1016/j.chb.2019.106189
Reference: CHB 106189
To appear in: Computers in Human Behavior Received Date: 26 November 2018
Accepted Date: 03 November 2019
Please cite this article as: Hajra Waheed, Saeed-Ul Hassan, Naif Radi Aljohani, Julie Hardman, Raheel Nawaz, Predicting Academic Performance of Students from VLE Big Data using Deep Learning Models, Computers in Human Behavior (2019), https://doi.org/10.1016/j.chb.2019.106189
This is a PDF file of an article that has undergone enhancements after acceptance, such as the addition of a cover page and metadata, and formatting for readability, but it is not yet the definitive version of record. This version will undergo additional copyediting, typesetting and review before it is published in its final form, but we are providing this version to give early visibility of the article. Please note that, during the production process, errors may be discovered which could affect the content, and all legal disclaimers that apply to the journal pertain.
Predicting Academic Performance of Students from VLE Big Data using Deep
Learning Models
Hajra Waheed a, Saeed-Ul Hassana, Naif Radi Aljohanib, Julie Hardmanc, Raheel Nawazc a Information Technology University, 346-B, Ferozepur Road, Lahore, Pakistan
E-mail address: [email protected]; [email protected], Tel: + 92-322-228-9756
b Faculty of Computing and Information Technology, King Abdulaziz University, Jeddah, Kingdom of
Saudi Arabia
E-mail address: [email protected]
c Department of Operations, Technology, Events and Hospitality Management, Manchester Metropolitan
University, UK
E-mail address: [email protected]; [email protected]
Abstract:The abundance of accessible educational data, supported by the technology-enhanced learning platforms, provides opportunities to mine learning behavior of students, addressing their issues, optimizing the educational environment, and enabling data-driven decision making. Virtual learning environments complement the learning analytics paradigm by effectively providing datasets for analysing and reporting the learning process of students and its reflection and contribution in their respective performances. This study deploys a deep artificial neural network on a set of unique handcrafted features, extracted from the virtual learning environments clickstream data, to predict at-risk students providing measures for early intervention of such cases. The results show the proposed model to achieve a classification accuracy of 84%-93%. We show that a deep artificial neural network outperforms the baseline logistic regression and support vector machine models. While logistic regression achieves an accuracy of 79.82% - 85.60%, the support vector machine achieves 79.95% - 89.14%. Aligned with the existing studies - our findings demonstrate the inclusion of legacy data and assessment-related data to impact the model significantly. Students interested in accessing the content of the previous lectures are observed to demonstrate better performance. The study intends to assist institutes in formulating a necessary framework for pedagogical support, facilitating higher education decision-making process towards sustainable education.
Keywords: Learning Analytics; Predicting Success; Educational Data; Machine Learning; Deep Learning; Virtual Learning Environments (VLE).
Predicting Academic Performance of Students from VLE Big Data using Deep
Learning Models
Abstract:The abundance of accessible educational data, supported by the technology-enhanced learning platforms, provides opportunities to mine learning behavior of students, addressing their issues, optimizing the educational environment, and enabling data-driven decision making. Virtual learning environments complement the learning analytics paradigm by effectively providing datasets for analysing and reporting the learning process of students and its reflection and contribution in their respective performances. This study deploys a deep artificial neural network on a set of unique handcrafted features, extracted from the virtual learning environments clickstream data, to predict at-risk students providing measures for early intervention of such cases. The results show the proposed model to achieve a classification accuracy of 84%-93%. We show that a deep artificial neural network outperforms the baseline logistic regression and support vector machine models. While logistic regression achieves an accuracy of 79.82% - 85.60%, the support vector machine achieves 79.95% - 89.14%. Aligned with the existing studies - our findings demonstrate the inclusion of legacy data and assessment-related data to impact the model significantly. Students interested in accessing the content of the previous lectures are observed to demonstrate better performance. The study intends to assist institutes in formulating a necessary framework for pedagogical support, facilitating higher education decision-making process towards sustainable education.
Keywords: Learning Analytics; Predicting Success; Educational Data; Machine Learning; Deep Learning; Virtual Learning Environments (VLE).
1 Introduction
Rapid advancements in Technology-Enhanced Learning platforms have shown a tremendous increase in online educational data to yield ample educational repositories (Treasure-Jones et al., 2019) - demonstrating significant impact on Higher Educational Institutions. This rapid increase in educational data is also providing opportunities to optimize users’ engagement with technological platforms to enhance the learning experience (Shorfuzzaman et al., 2019). The progression of the accumulated educational data has stimulated the emergence of several research communities, such as learning analytics to predict learners’ behavior and providing indicators for optimized policy formulations (Azcona & Smeaton, 2017; Viberg et al., 2018; Capuano & Toti 2019). Educational data, a by-product of the interaction between learners and instructors, has been substantiated as a multidisciplinary field of study, involving researchers from various research disciplines (Xu et al., 2019). This has generated the inclusion of numerous terms associated with the exploration of educational data, such as academic analytics, predictive
analytics, and learning analytics. A more recent term formulated is ‘educational data science,’ which cohesively combines various researchers from different disciplines and backgrounds, bringing them together to work collaboratively on research interests related to educational data (Piety et al., 2014).
1.1 Deep Learning for Educational Data Science
The Artificial Neural Networks (ANNs) are the most prominent practice utilized in the Educational Data Mining (EDM) domain (Coelho & Silveira, 2017). Although there have been issues associated with ANNs, especially when extracting human-interpretable patterns from the predicted results, most of these concerns were resolved in the last decade, with the emergence of Deep ANNs (Coelho & Silveira, 2017; LeCun et al., 2015). Deep learning, evolved from machine learning, and characterized by numerous computational layers, enable the model to learn from examples, patterns (Wang et al., 2011; Nawaz et al., 2012) or events (Ananiadou et al., 2013; Nawaz et al., 2012), superseding the traditional techniques of hand-engineering the features (Poplin et al., 2018).
Contrary to the increasing rise in deep learning techniques, sufficient evidence of Deep ANNs in EDM and learning analytics literature is not available. Coelho & Silveira (2017) conducted a systematic literature review to investigate the evidence found in learning analytics and deep learning studies. They identified student performance (Guo et al., 2015; Okubo et al., 2017; Wang et al., 2017), student assessment (Li et al., 2016) and hand writing recognition (Gross et al., 2015), as being some of the areas where deep learning was deployed, proving better than the baseline models. Numerous models have been explored in the learning analytics research paradigm, however identifying the significance of deep learning in the learning analytics domain is still in its infancy, with studies on the adoption of this technique emerging in the last few years.
Learning analytics comprises of several facets with the inclusion of gathering, assembling, examining and analysing students’ information to enhance understanding of the learning environment, resulting in optimized learners’ and instructors’ performance (Siemens, 2010; Siemens & Long, 2011). It is also interpreted as emphasizing on individually assessing the learners’ performance and its corresponding impact on the institutions performance (Baker &
Inventado, 2014; Daniel, 2017; Romero & Ventura, 2010). Additionally, it deals with formulating policies and developing strategies in order to elevate the ability of institutions at an academician level, stimulating effective decision-making (Elias, 2011; Leitner et al., 2017). It aids in inferring patterns from the educational data to not only optimize students’ performance, but also to provide supplementary support in teaching mechanisms by tailoring teaching methods, holistically improving the learning environment (Khalil & Ebner, 2015).
Objectives
Learner’s Intuition
Student Progress
Improving Learner’s Experience
Improve Collaboration
Tools & Techniques
Statistical Analysis Machine Learning Classification (Pass-Fail) Regression (Scores) Deep Learning Deep ANN LSTM Educational Analytics Objectives Longitudinal Interventions Student Success Academic Difficulty Customizing Courses
Tailoring Teaching Methods
Student Retention
Tools & Techniques
Machine Learning Classification Tasks Regression Academic Analytics Objectives Academic Engagement Administration Level - Policies - Guidelines Student Affordability Student Access Resource Allocation
Tools & Techniques
Machine Learning - Classification tasks (SVM, Naïve Bayes,
Decision Tree) - Regression
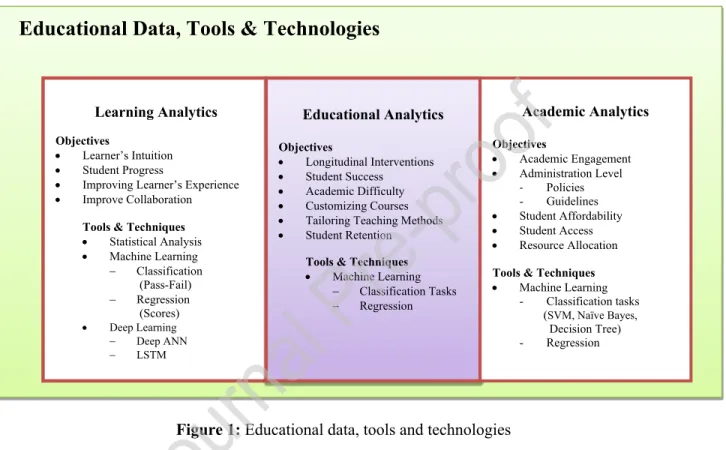
Educational Data, Tools & Technologies
Learning Analytics
Figure 1: Educational data, tools and technologies
In higher education, learning analytics is defined consistently with notions of academic analytics, aiding institutions in their financial strength by reducing attrition rates, improving learning outcomes by considering learner’s behavior, recommending corrective policies for instructors that eventually yield in establishing a stable institute and exercising a suitable resource allocation method. Student retention has become a standard strategic imperative for institutions, and the learning analytics phenomena cumulatively aids in retaining students, consequently resulting in accumulated graduation rates (Palmer, 2013). Academic and learning analytics consistently overlap in formulating the ‘Educational Analytics’ paradigm - learning analytics is associated with the learner’s experience and academic analytics implicitly incorporates the overall institute
and its performance (Waheed et al., 2018). Moreover, a semantic mapping of deep learning with educational data science is presented in Fig. 1, constituting of the objectives related to educational data science and the tools/techniques associated with machine learning that are deployed in the existing literature. The paradigm of educational data science encompasses the various overlapping educational analytics terms such as Learning analytics, Educational analytics and Academic analytics, as depicted in Fig. 1. Deploying deep learning techniques enables to capture the students’ learning perception in a more rigorous manner, facilitating longitudinal interventions by the academia, and tailoring teaching methods to improve learner’s experience.
Multiple facets of learning analytics, encompassing learning excellence and monitoring operational services, enable the integration of educational repositories, affording higher education to achieve effective decision making, eventually aiding an institute in maintaining a stable performance (Van Barneveld et al., 2012). Another dimension of this domain is the prediction of student performance, monitoring their actions to gain insight into their patterns of accessing the system and identifying potentially weak students or those at risk of failing. Aljohani et al., (2018) discussed the need of learning analytics applications, tailored for each course, in order to have a better understanding of a learners cognition, pedagogy intention and online behavior. Learning analytics in mobile learning is a relatively new emergent area, formulating policies for assessing the behavior of mobile learners (Aljohani et al., 2012). Aljohani & Davis (2013) developed an app to record feedback from mobile learners after each lecture, which consequently assisted in examining the learner’s behavior.
With the growth of internet, online education has become one of the rising key phenomena providing sufficient repositories for student and learner information. This allows analysis for predicting patterns in an educational setting, defining association between the stakeholders involved and optimizing the learning environment. Online systems included, but not limited to, Learning Management Systems (LMS), Course Management Systems (CMS), Massive Open Online Courses (MOOCS), Virtual Learning Environments (VLE), Intelligent Tutoring systems (ITS) and other web-based educational systems contribute in generating digital footprints that can be examined to assess the prospective behavior of learners, analysing activities of successful and at-risk students, providing corrective strategies based on learner’s performances,
consequently assisting instructors in improving the pedagogical methods (Casquero et al., 2016; Fidalgo-Blanco et al., 2015).
Learning analytics assists in providing automated, real time opinions and recommendations for constructive pedagogical strategies through multiple learning analytics platforms (such as learning analytics dashboard, LMS visualization systems). These feedback systems aid in constructing a more robust platform to measure, examine and predict student involvement, contributing self-regulated learning and driving motivational factors to regulate successful goal achievement (Corrin & de Barba, 2014; Mah, 2016; Siemens et al., 2011; Siemens & Long, 2011). Corrin & de Barba (2014) initiated a study to interpret the influence that feedback provided via learning analytics dashboards had on students’ performance, motivational drive and strategy development for course work. These applications induce a positive drive in students learning, consequently impacting performance (Arnold & Pistilli, 2012).
1.2 Contributions
The overall research agenda for this study is to measure the effectiveness of VLEs in predicting students’ performance, for timely intervention by the instructors, providing suitable pedagogical support. Moreover, determining learners’ behavior and various patterns associated with them, the performance of the students can be assessed by the extent of their interaction with the virtual environment. More specifically, students’ interactions with the deployed learning management tools generate an abundance of clickstream data, consequently reflecting their participation with the learning environment. The current students’ performance is indicative of their legacy data, such as their past performance in assessments and quizzes. The objectives to be addressed in this study are as follows:
Determining the effectiveness of deep learning models in predicting students’ academic performance for the following categories: ‘withdrawn-pass’, ‘pass-fail’, ‘distinction-pass’ and ‘distinction-fail’ using VLE dataset.
Exploiting clickstream data generated through students interaction with the virtual learning management system to assess their performance.
Ascertaining the effectiveness of deep learning models for the early prediction of students’ performance.
The proposed contribution of this study, as derived from the above research objectives, is essential in identifying the effectiveness of the learner’s digital footprints in the VLE, including their legacy data and ascertaining interaction patterns of students’ at-risk of failure or withdrawal. In this study, we explored a well-known freely available dataset, called Open University Learning Analytics (OULA) provided by Open University, to analyse student behavior and the impact of students’ interaction with the VLE on their performance. The rest of the paper is organized as follows. Section 2 briefly describes existing educational data science literature in predicting students’ performance in an online environment. Section 3 describes the dataset and discusses the methodology. Section 4 presents the experimental results and discussion. Finally, section 5 summarizes the paper by providing concluding remarks and proposing future directions.
2 Literature Review
The research area related to students’ performance prediction is multidimensional and can be explored and analysed via multiple perspectives, including early prediction of dropouts and withdrawals in an on-going course, analysing the intrinsic factors impacting their performance and deploying statistical techniques to measure the performance of students. Various data mining techniques are deployed on educational datasets to predict students’ performance, assessing slow learners and dropouts (Abu-Oda & El-Halees, 2015; Kaur, 2015; Hardman et al., 2013; Yadav, 2012). The techniques employed on these learning analytics datasets aid in data-driven decision making (Waheed et al., 2018). Early prediction is a new phenomenon in this domain, encompassing methods to timely assess the students in order to retain them, by suggesting suitable corrective strategies and policies, subsequently managing and reducing attrition rates. In the literature, there has been substantial debate on the subject of student retention in MOOCs. Numerous studies have emphasized the identification of the factors contributing to students’ dropout rates (Aulck et al., 2016; Fei & Yeung, 2015; Tan & Shao, 2015; Xing, 2016). Various factors, such as the attribute of time, motivational factors, non-existent interactivity between students-instructors, lack of knowledge of the course pre-requisites and effectiveness of the course content, are associated with the early withdrawal of students in MOOCs (Hone & Said, 2016; Khalil & Ebner, 2014). Jaggers & Xu (2016) conducted a study identifying the major
factors influencing student performance in an online environment and concluded student-instructor interaction to be the foremost attribute positively impacting one’s performance.
Different attributes are associated with the prediction of students’ performance. Shahiri & Husain (2015) conducted a systematic literature review to observe the characteristics substantially contributing to the prediction of class-room performances. Cumulative grade point (CGPA) and assessments (such as assignments and quiz marks) were considered to be the two primary attributes to assess students’ performance (Elakia & Aarthi, 2014; Mayilvaganan & Kalpanadevi, 2014; Papamitsiou et al., 2014; Tucker et al., 2014). Another perspective encompasses factors of students’ legacy data (such as past performances in previous assessments/entry test etc.) and demographics in being significant contributors to assessing performances (Leitner et al., 2017). Furthermore, another study employed family characteristics, such as family expenditure, income and students personal information, to assess the impact on their performance (Daud et al., 2017). They concluded that excessive rental expenditures and health expenses impacted the overall environment ultimately influencing student’s performance. Emotional stability, a student’s inherent attribute, was considered to be an important predictor of their performance.
Several studies deploy machine learning techniques to analyse student behavior and predict students at-risk of a failure (Costa et al., 2017; Hassan et al., 2019; Wasif et al., 2019). In the existing literature, another array of studies follow a sequential approach to convert the course duration into a week-wise format and assess student performance according to their interaction with the learning environment. Marbouti & Diefes-Dux (2015) utilised machine learning techniques to predict students at-risk of a failure in the 2nd, 4th and 9th week of their first year of
engineering. Their dataset comprised of attendances, quizzes and assignments, with the inclusion of an additional attribute of mid-term exams in the 9th week. Deploying a logistic regression
model, they achieved an accuracy of 98% by the 9th week. Additionally, in a study, at-risk
students were predicted by deploying various data mining techniques, including Support Vector Machines (SVM), Naïve Bayes Classifier, Decision Tree, K-Nearest Neighbor and Multi-Layer Perceptron, to identify the best prediction modeling method. Logistic Regression was employed as the baseline model (Chui et al., 2018; Marbouti et al., 2016). Assessment engagement pattern is considered to be another parameter that effectively captures the behavior of students and induces a positive impact on their performance (Hussain et al., 2018; Jung & Lee, 2018). In
contrast to the clickstream behavior that only captures 10% variance of student learning dynamics, assessment related activities enable to tap a much broader variation of student behavior (Tempelaar et al., 2015). Similarly, the involvement in the discussion forums was found to be positively associated with student success (Bonafini et al., 2017).
Deploying deep learning techniques on learning analytics to predict successful and at-risk students is rather a new area of research. Deep learning employs techniques that encompass constructing a model comprising of multiple layers to learn representations from raw data. This representation learning consists of multiple layers, where each layer transforms the representation to a more abstract form for the next layer (LeCun et al., 2015). Corrigan & Smeaton (2017) predicted student success via a VLE by including the number of times a student interacts with the environment. They deployed Recurrent Neural Network’s (RNN) variation Long Short Term Memory (LSTM), to predict the success of students based on their interaction with the Moodle based learning environment. The results were evaluated using Random Forests, and LSTM outperformed it by 13.3% of the variance of the model, as opposed to 8.1%.
Okubo et al. (2017) predicted student success by utilizing various features extracted from Kyushu University’s learning system named M2B. They collected 108 student learning logs for an ‘Information Science’ course. The learning logs comprised of a feature set of weekly quiz, attendance, notes on the lectures delivered, sides view and book markers. They deployed the RNN model with hidden layers of LSTM to predict students grades based on their interactions and defined features. The results were compared with multiple regression analysis and the proposed model surpassed the regression models through early prediction of the grades. Fei & Yeung (2015) employed different machine learning techniques to predict student dropout rates in two courses from Massive Open Online Courses (MOOCS). Since the data is time dependent, they viewed it as a sequence classification problem. MOOCS are subjected to high attrition rates; hence apart from baseline models such as SVM and Logistic regression, they implemented Input Output Hidden Markov Model (IOHMM), RNN and LSTM to identify the best technique among these.The feature set incorporated lecture view, lectures downloaded, quiz attempts, numbers of access, forum activities, forum views and number of times students commented on forums. After deploying the above mentioned techniques, they found that a combination of RNN and LSTM had the highest accuracy.
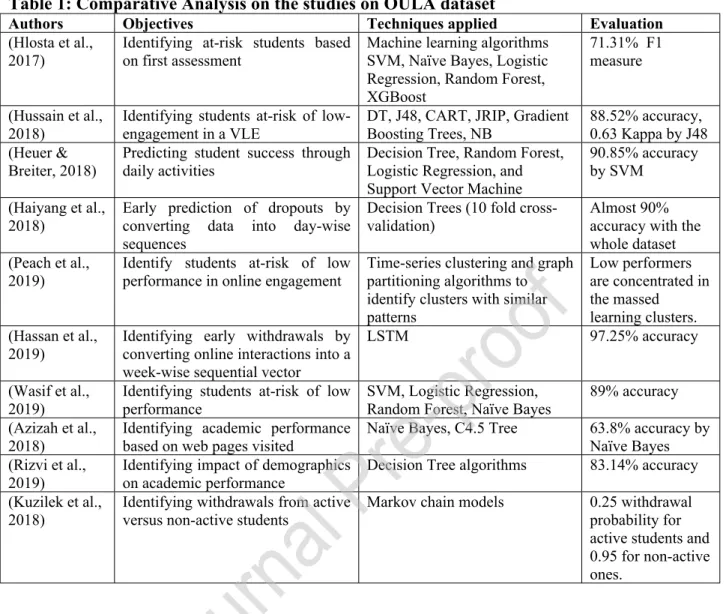
Table 1: Comparative Analysis on the studies on OULA dataset
Authors Objectives Techniques applied Evaluation
(Hlosta et al., 2017)
Identifying at-risk students based on first assessment
Machine learning algorithms SVM, Naïve Bayes, Logistic Regression, Random Forest, XGBoost
71.31% F1 measure (Hussain et al.,
2018)
Identifying students at-risk of low-engagement in a VLE
DT, J48, CART, JRIP, Gradient Boosting Trees, NB
88.52% accuracy, 0.63 Kappa by J48 (Heuer &
Breiter, 2018)
Predicting student success through daily activities
Decision Tree, Random Forest, Logistic Regression, and Support Vector Machine
90.85% accuracy by SVM
(Haiyang et al., 2018)
Early prediction of dropouts by converting data into day-wise sequences
Decision Trees (10 fold cross-validation)
Almost 90% accuracy with the whole dataset (Peach et al.,
2019)
Identify students at-risk of low performance in online engagement
Time-series clustering and graph partitioning algorithms to identify clusters with similar patterns Low performers are concentrated in the massed learning clusters. (Hassan et al., 2019)
Identifying early withdrawals by converting online interactions into a week-wise sequential vector
LSTM 97.25% accuracy
(Wasif et al., 2019)
Identifying students at-risk of low performance
SVM, Logistic Regression, Random Forest, Naïve Bayes
89% accuracy (Azizah et al.,
2018)
Identifying academic performance based on web pages visited
Naïve Bayes, C4.5 Tree 63.8% accuracy by Naïve Bayes (Rizvi et al.,
2019)
Identifying impact of demographics on academic performance
Decision Tree algorithms 83.14% accuracy (Kuzilek et al.,
2018)
Identifying withdrawals from active versus non-active students
Markov chain models 0.25 withdrawal probability for active students and 0.95 for non-active ones.
Recently, in the existing literature many studies have explored the OULA dataset to leverage the power of machine learning in analysing and predicting student performance. Table 1 presents a conclusive comparison of the studies using OULA dataset in performance and courses evaluation. Overall, in the existing literature several studies leverage the ability of machine learning techniques to predict student performance through various parameters of student engagement. However, such studies either emphasize on predicting at-risk students or analyse the dropouts. In this study, we intend to analyse student performance through the initiation of different performance-related categories. The investigation of such categories will assist in identifying behavioral patterns of various performance categories, providing opportunities for educational stakeholders to support students in need.
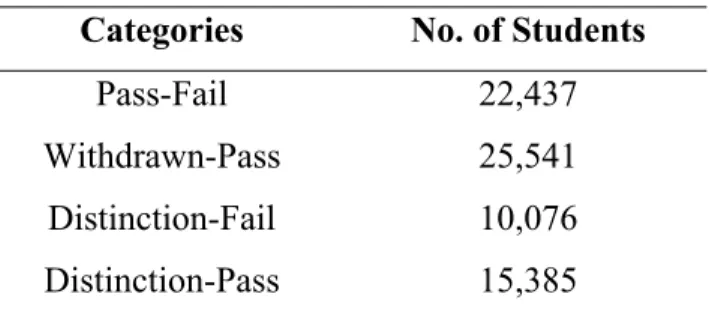
Table 2: Class Label Categories
Categories No. of Students
Pass-Fail 22,437
Withdrawn-Pass 25,541
Distinction-Fail 10,076
Distinction-Pass 15,385
3 Data and Methodology
This section presents an overview of dataset, pre-processing techniques and details of deep learning model employed.
3.1 Dataset
The dataset is retrieved from the openly accessible OULA which provides demographic, clickstream behavior and assessment performance of 32,593 students over a course period of 9 months, from 2014-2015 (Kuzilek et al., 2017). It is comprised of 7 courses, referred to as modules, each presented at least twice and at different times in a year. The resultant marks of students are classified into four classes; distinction (3,024), pass (12,361), fail (7,052) and withdrawn (10,156). The dataset consists of several files, consisting of students’ demographics, VLE data, interaction with the VLE represented by clickstream data, assessment marks and modules information. The VLE data is comprised of 20 activities, where each activity type represents an important element of the VLE, and students interact with the VLE to access course material and participate in discussion events, through these activities (See Table A-1 in Appendix A).
In this study, to analyse student performance prediction, the provided student performances are devised into four categories, with each category being a binary classification. To devise these categories, class labels pass and distinction are merged into one label ‘pass’, owing to the class imbalance problem. To predict students’ at-risk of failure, class labels ‘pass’ merged with ‘distinction’, and ‘fail’ are deployed on the model. The problem, hence, becomes a binary classification problem with 22,437 unique students and ‘pass’ , ‘fail’ as class labels, where class 0 depicts pass and 1 represents fail. The withdrawal cases tend to have a distinct attitude where a student might withdraw in the first few weeks. Therefore, it is considered another category and
withdrawals are predicted with the ‘pass merged with distinction’ cases. Again the problem is converted to a binary classification with 25,541 unique students and ‘withdrawn’, ‘pass’ as class labels (see Table 2). Similarly, to predict students with distinctions, they are employed on the model with ‘pass’ and ‘fail’. Overall four categories of the dataset are computed with respect to the class labels. Each category represents a binary classification system, to address the objectives of the study.
An array of analytical techniques are employed on this dataset to predict students’ performance by identifying students at-risk of a course failure, early prediction of at-risk and withdrawal students and identifying patterns of students passing with distinction. A two-fold approach is utilized to represent the OULA dataset to encompass the objectives of our study. Firstly, demographics, assignments and total clicks of each student are computed to address the objectives of this study. Secondly, each module is divided into quartiles, to provide early intervention of the students at-risk of failure or withdrawal. A detailed description of all the features employed in the two approaches is described below in the preprocessing section.
3.2 Methods
The study follows a two-fold analysis: a) mining student activity with the VLE portal and static demographics data; b) mining quarterly clickstream data for each student in each new course. In order to evaluate students’ performance, the OULA dataset is analysed as follows to obtain the objectives of this study.
3.2.1 Mining Demographics and VLE Portal
The first approach mines the data that includes the students’ demographics and VLE portal information, such as the number of clicks for each activity type provided in the dataset. Moreover, students are able to access the VLE a few weeks before the start of the module; hence the number of clicks for each activity type, before the module started, is considered another range of features. Similarly, the data relevant to the assessments and number of late assignments submitted are also included in the dataset. A list of these 54 features is provided in Table A-1, Appendix A.
The dataset, comprising students’ demographics and VLE portal information, is sparse with 54 features and one binary class label for each category. Sparse feature reduction technique is employed to find the optimal features impacting student’s performance. To cater the data sparsity on this feature set, sparse feature reduction technique using truncated Singular Value Decomposition (SVD) is deployed, to identify the top 30 significant attributes. This technique performs linear dimensionality reduction by means of truncated SVD. SVD corresponds to dimensionality reduction by means of a low rank approximation, assuming there is a matrix ‘X’ and it is to be estimated to a rank ‘r’ matrix ‘ ’, where 𝑋^ r < rank(X). The estimated inaccuracy is computed by the Frobenius norm, which corresponds to the square root of the squared error. It reduces the ‘squared distance’ between each data point. The problem then becomes: min such that, rank ( ) = r. The rank ‘r’ denotes the dimension of the linear
𝑋^ |𝑋 ― 𝑋
^|
𝐹 𝑋^
sub-space of the data points. is the computed low rank estimation of the data matrix implying 𝑋^ that the data points in ‘X’ matrix are compressed into a r-dimensional sub-space. In terms of centered data SVD corresponds to Principle Component Analysis (PCA), which can be defined as reducing the estimation error (Jolliffe & Cadima, 2016). However, in terms of non-centered data, such as in this case where the data is sparse, SVD instead of the covariance matrix, is expressed as the Eigen-decomposition of the matrix XTX.
A list of the 30 features (F1-F30) selected by the sparse reduction technique (SVD) is provided in Table A-1 in Appendix A, where each feature is listed with respect to its significance on the student’s performance. The demographics data is available in the OULA dataset. However, the VLE portal information, constituting of the overall total clicks on each activity, is computed through the available raw OULA dataset.
3.2.2 Mining Quarterly VLE Clickstream Events
The second approach in this study is the early intervention for all the categories (as provided in Table 2). To address early intervention, modules are divided into quarters. The duration of a module is nine months, so each module is divided into 4 quartiles and for each quartile the clickstream data of each activity is computed. Clickstream data refers to the interaction behavior of the students with the online learning platform. For each quarter temporal features are computed, that are updated with respect to each quarter. This forms another array of derived
features, in order to assess the most significant time in a module affecting a student’s performance, which can further be utilized for early intervention by the academia.
Each module quarter contains the computed clickstream data of the temporal longitudinal activities, which vary with respect to each quarter. Each new quarter is computed by adding clickstream data of its previous quarters, such that Q2 will contain the clickstream activities of Q1 and Q2 cumulatively. Similarly, Q3 and Q4 are computed, with each of them including the clickstream information of their previous quarters. The activities in OULA VLE have been discussed previously in the dataset section. The number of features in each quarter corresponds to the number of activities in the VLE; however, the clickstream information of each quarter varies.
3.2.3 Artificial Neural Network
Finally, the Deep Artificial Neural Network or Deep ANN classification model is employed to learn the predictive function of predicting students’ at-risk of failure, those likely to withdraw from their courses, early prediction of withdrawal students, and determining the students who outperform others with distinction.
Deep learning methods are referred to as representation-learning methods constituting several layers of non-linear modules. This enables the system to be proficient enough to learn complex functions, making it robust enough to be sensitive to intricate and minute specificities. In contrast to the statistical methods, Deep ANNs facilitate generalization, which enables them to correctly infer hidden patterns from the data, assisting in making data driven assumptions (Montavon, Samek, & Müller, 2018). The network learns from the examples in the training data, thus increasing the training split leads to a more robust accuracy (Nielsen, 2015). The stack of non-linear layers between the input and output layers are referred to as hidden layers, weights are adjusted in the layers through stochastic gradient, to calculate the error computed in classifying and predicting correct answers. An ANN with multiple non-linear layers, also referred to as a Multiple Layered Perceptron, is capable of implementing complicated input functions (LeCun et al., 2015).
An ANN is composed of inter-connected objects referred to as processing units. Each unit takes the weighted sum of inputs and produces an output. An ANN has a layered architecture where neurons are assembled in consecutive layers and output of each layer is fed to its successive
layer. A combination of non-linear functions is deployed on the input, hidden and output layers. In binary classification the output layer is activated with ‘sigmoid’ function, because sigmoid squashes the values into 0 or 1. For a supervised learning problem, the weight vector ‘w’ for the ‘nth’ unit at time instant ‘t’ is defined as shown in Eq. 1.
(t+1) = (t) + (1)
𝑤𝑖 𝑤𝑖 ∆𝑤𝑖𝑡
where ∆𝑤𝑖𝑡 denotes the change in the weight vector. For each instance the weight vector is changed with respect to the difference in the actual and desired output,
(2) ∆𝑤𝑖=𝜂 ∗(𝐷 ∗ 𝑌).𝐼𝑖
where is the learning rate of the model, 𝜂 D and Y are the desired and actual outputs, respectively and denotes the i𝐼 th input instance. The model is trained to find appropriate weight vector values
𝑖
that correspond to a robust prediction (Da Silva et al., 2017).
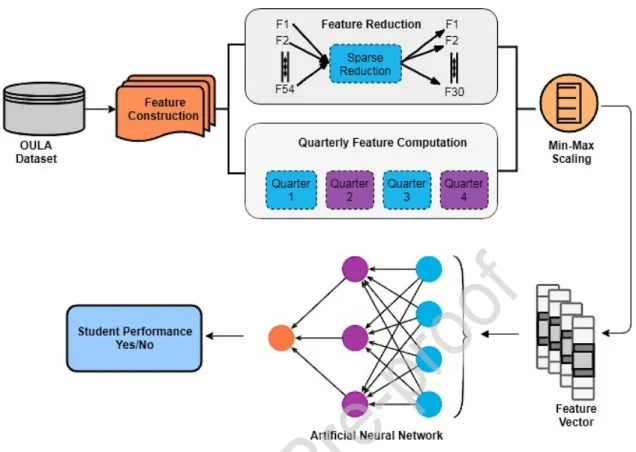
In this study, Deep ANN is employed to predict the students’ performance, in terms of identifying students’ at-risk of failure in their modules. After feature selection, min / max scaling is employed to normalize the data. The data is split into train test and is fed to the neural network in the form of a feature vector. A train-test split of 70% is performed with 30% reserved for the validation of the model. Fig. 2 illustrates the proposed architecture level system of the ANN. For each of the four categories defined in Table 2, extensive experimentations were conducted to select the appropriate parameters providing optimal results. After rigorous experiments ANN with three hidden layers is implemented with each hidden layer constituting of 50, 20 and 10 neurons respectively. Moreover, each hidden layer is activated with either ‘relu’ or ‘tanh’ function and the output layer with ‘sigmoid’ function. Further, the experimentation details are provided in the next section.
4 Experiments and Results
The study follows a two-fold analysis: a) over-all data including student activity with the VLE portal and demographics data; b) quarterly clickstream data for each student in each new course. For each of these cases different experiments were performed with different parameters, however optimized results were obtained by deploying the deep ANN model with three hidden layers of different neurons, a batch size ranging from 32 to 64 and either ‘adam’ or ‘rmsprop’ as optimizers.
Figure 2: Proposed Architecture of Artificial Neural Network
4.1 Analyses of demographics and VLE portal events
To predict students’ performance, considering their demographics and overall portal VLE information, 30 features, through sparse reduction technique were selected from a total of 54 features, provided in Appendix A. From these 54 features F1-F30 were selected through sparse reduction technique. Table 3 represents the evaluation results of our Deep ANN with the baseline models Support Vector Machine (SVM) and Logistic Regression (LR) where cross validation was performed on the data. Each method was executed multiple times with a random train-test split; these results were then averaged and reported in Table 3. Due to the consistency in the existing literature, SVM and LR were selected as baseline models.
4.1.1 Predicting at-risk students
The problem of predicting at-risk students was converted to a binary classification problem by defining two classes ‘pass’ and ‘fail’. SVM with a rbf kernel and deep ANN with three hidden layers of 50, 30 and 15 neurons and a batch size of 64 produced optimal results. It can be observed that Deep ANN yields a better accuracy in predicting students’ at-risk of failure.
Table 3: Cross validation results for Students demographics & VLE portal data
Categories Techniques Accuracy% Loss Precision Recall
ANN 84.48 0.385 0.86 0.617 SVM 66.94 0.340 0.44 0.69 Pass/ Fail LR 81.95 0.182 0.80 0.81 ANN 86.40 0.295 0.78 0.76 SVM 72.43 0.291 0.76 0.79 Distinction/ Fail LR 80.15 0.197 0.79 0.80 ANN 80.54 0.495 0.69 0.82 SVM 78.93 0.253 0.66 0.79 Distinction/ Pass LR 79.81 0.219 0.76 0.78 ANN 94.70 0.136 0.94 0.91 SVM 88.31 0.125 0.87 0.88 Withdrawn/ Pass LR 88.34 0.135 0.88 0.89
Therefore, according to the features provided in Table A-1 in Appendix A, Deep ANN produces better predictions by yielding an accuracy of 84% (see Table 3).The significant features associated with the desired student performance are illustrated in the heat-map (part (a) of Fig. 3). It can be observed that demographic features, previous education history, legacy data of students including assessments submission and the overall activity of a student in a module are significantly impacting student’s performance.
4.1.2 Predicting students with distinction
To predict students with distinction, the problem was considered a binary classification problem by defining two sets of categories, a) ‘distinction’ and ‘pass’ b) ‘distinction’ and ‘fail’. For ‘distinction-pass’, a deep ANN with hidden layers of 50, 25, 10 neurons, batch size of 32 and tanh as activation function provided optimal results. As depicted in Table 3, ANNs accuracy in ‘distinction-pass’ category does not have a significant difference from other baseline models. This may be attributed to the class imbalance problem; also another justification can be that both classes do not have significant differences in their patterns. In the ‘distinction-fail’ category deep ANN yields more accurate results than other baseline models, as shown in Table 3. Parameters were tuned by setting hidden layers of 50, 40 and 20 neurons and 32 as batch size. The significant features associated with the desired student performance are illustrated in the heat-map (parts (b) and (c) of Fig. 3). To predict ‘distinction’ instances from failures, students’ portal information is observed to be positively associated with the performance, whereas demographic features including geographical region and education history are seen to be negatively associated with performance.
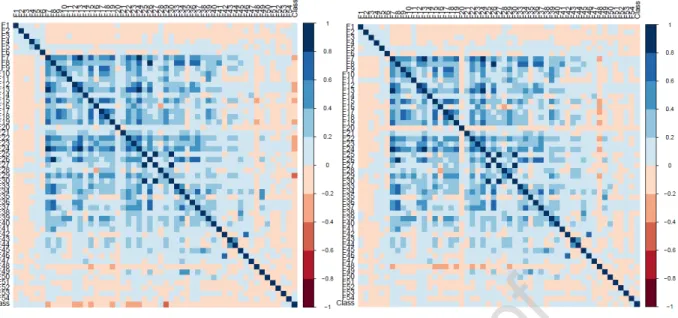
a) Pass-Fail correlation heat-map b) Distinction-Pass correlation heat-map
c) Distinction-Fail correlation heat-map d) Withdrawn-Pass correlation heat-map
Figure 3: Correlation Heat-maps among features and class categories
It can be observed that demographic features, previous education history, legacy data of students including assessments submission and the overall activity of a student in a module, are significantly impacting the student’s performance.
4.1.3 Predicting withdrawal cases
To predict ‘withdrawal’ instances, ‘withdrawals’ and ‘pass’ are the two classes that were defined. The pattern of withdrawals will distinguish from ‘pass’ instances, since withdrawals
tend to leave/drop out of their modules. Parameters for deep ANN were tuned with 50, 50 and 20 neurons in the three hidden layers, 64 batch size and relu as activation function. The evaluation results show an accuracy of 94% in predicting the two aforementioned class labels, provided in Table 3. Comparing the deep ANN results with SVM and LR, deep ANN tends to give a higher accuracy in predicting withdrawals. The significant features associated with the desired student performance are depicted in the heat-map (part (d) of Fig. 3). In case of withdrawals, the activities before the initiation of the module are observed to be significantly impacting the performance. Students interested in registering in a particular module are more likely to be active on the portal before the module starts. It can be observed that demographic features, previous education history, legacy data of students including assessments submission and the overall activity of a student in a module, are significantly impacting the performance of students.
4.2 Analyses of Quarterly VLE Clickstream Events
For each quarter, the four categories corresponding to at-risk students, distinction students and withdrawals were predicted through the deep ANN classifier. The detailed analysis for each of these quarters is discussed below and provided in the Table 4.
4.2.1 Early Prediction of at-risk students
The problem of predicting at-risk students was converted to a binary classification problem by defining two classes ‘pass’ and ‘fail’.
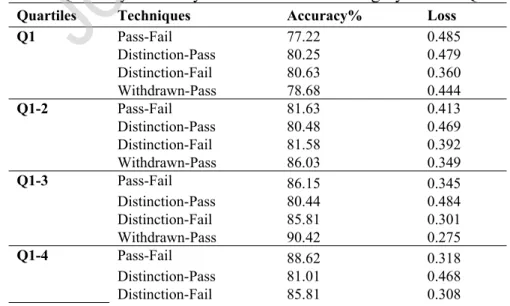
Table 4: Quarterly Accuracy and Loss for each Category in each Quartile
Quartiles Techniques Accuracy% Loss
Pass-Fail 77.22 0.485 Distinction-Pass 80.25 0.479 Distinction-Fail 80.63 0.360 Q1 Withdrawn-Pass 78.68 0.444 Pass-Fail 81.63 0.413 Distinction-Pass 80.48 0.469 Distinction-Fail 81.58 0.392 Q1-2 Withdrawn-Pass 86.03 0.349 Pass-Fail 86.15 0.345 Distinction-Pass 80.44 0.484 Distinction-Fail 85.81 0.301 Q1-3 Withdrawn-Pass 90.42 0.275 Pass-Fail 88.62 0.318 Distinction-Pass 81.01 0.468 Q1-4 Distinction-Fail 85.81 0.308
Withdrawn-Pass 93.23 0.223
For each quarter, at-risk students were predicted, in order to analyse the improvement in our model, insinuating early prediction of students’ at risk of failure.
Fig. 4 illustrates the accuracy for each of the quarters. It can be observed that the best accuracy is achieved in the last quarter that cumulatively integrates the overall clicks for each activity.
However, 2nd and 3rd quarters also do not perform poorly; they too reach an accuracy of above
80%. Therefore, our classifier gives an accuracy of 81-86% for early prediction of at-risk students from the initial quarter to the final one, respectively.
Figure 4: Quarterly accuracy for each category
4.2.2 Early Prediction of students with distinction
To predict the students outperforming others with distinction, the problem was again converted to a binary classification by defining two sets of this problem; a) ‘distinction-pass’ b) ‘distinction-fail’. We show that for the category ‘distinction-pass’, a major change or rise in the accuracy for all the quarters is not observed (see Fig. 4). The accuracy throughout the quarters rather remains stagnant, with a little difference in the last quarter (Q1-4), implying that a distinct decision boundary in the case of ‘distinction’ and ‘pass’ is not available. This may be attributed to the class imbalance problem, because the ‘distinction’ instances are quite scarce as compared to ‘pass’ instances. If ‘distinction’ instances are increased, then a distinct pattern between such students may be visualized.
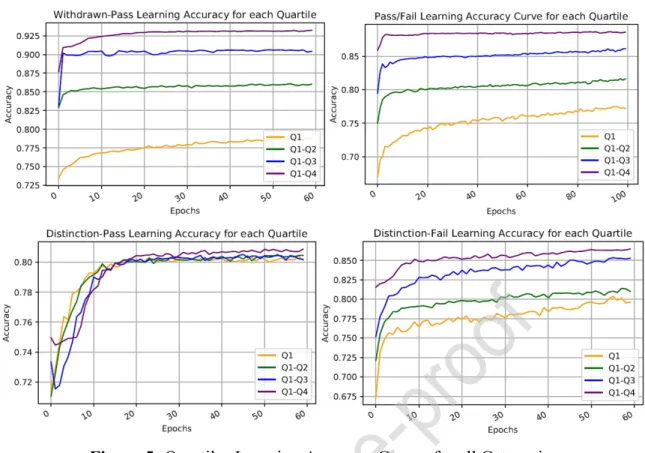
Figure 5: Quartiles Learning Accuracy Curves for all Categories
Similarly, to evaluate the ‘distinction-fail’ instances, these two were defined as class labels. Deep ANN was implemented on this set of instances, for all the quarters. Due to the class imbalance problem, a distinguishing pattern is not observed, as depicted in Fig. 4. It can be visualized that the last two quarters have a stagnant accuracy, however better than the previous quarters, nevertheless due to the low number of ‘distinction’ instances, a demarcating accuracy rise between quarters, cannot be observed for this category.
4.2.3 Early Prediction of withdrawal cases
For early intervention in predicting withdrawals, the problem was considered a binary classification by deploying ‘withdrawals’ and ‘pass’ as two defined class labels. A distinct rise in accuracy, with respect to each of the quarters, is observed, with the last quarter reaching an overall accuracy of 93%. Fig. 4 demarcates a discrete pattern in the prediction of ‘withdrawal’ instances from ‘pass’ instances. It can be inferred that the model constantly learns the patterns of withdrawals for each new quarter, with accuracy ranging from 78% to 93%.
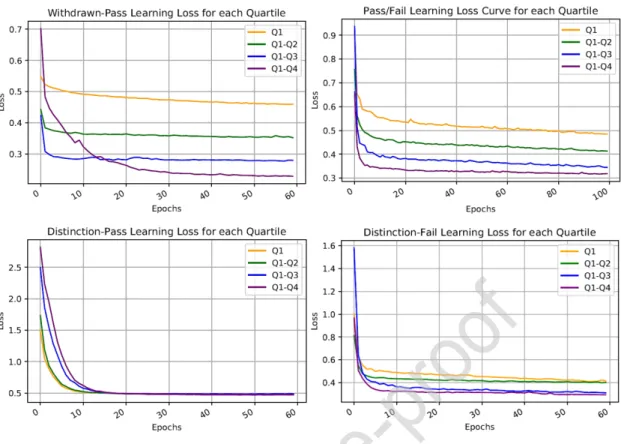
Figure 6: Quartiles Learning Loss Curves for all Categories
Fig. 5 depicts the quarterly learning accuracy curves for all the four categories specified in this study. We show that for the three categories; ‘withdrawn-pass’, ‘pass-fail’ and ‘distinction-fail’, a clear demarcation can be observed with respect to the quarterly data. Learning accuracy improves with the increased clickstream quarterly data, implying the possibility of early prediction of students’ at-risk of failure, detecting early withdrawals and distinguishing students with distinction from failure instances.
Table 5: ANN’s evaluation with the baseline for Q1-Q4
Techniques Category Accuracy% Loss Precision Recall
Pass-Fail 88.62 0.318 0.93 0.69 Distinction-Pass 81.01 0.468 0.37 0.08 Distinction-Fail 85.81 0.308 0.74 0.81 ANN Withdrawn-Pass 93.23 0.223 0.96 0.86 Pass-Fail 85.65 0.157 0.84 0.84 Distinction-Pass 79.95 0.202 0.64 0.80 Distinction-Fail 78.08 0.219 0.79 0.78 SVM Withdrawn-Pass 89.14 0.108 0.89 0.89 Pass-Fail 84.23 0.157 0.84 0.84 Distinction-Pass 79.82 0.202 0.75 0.80 Distinction-Fail 81.69 0.183 0.81 0.82 LR Withdrawn-Pass 85.60 0.144 0.86 0.86
Owing to the class imbalance problem, the ‘distinction-pass’ category does not yield substantial results and a clear demarcation line, in terms of improved accuracy between quartiles, is thus missing for this case.
Fig. 6 illustrates the quarterly learning loss curves for all the four categories mentioned. Similar to the learning accuracy, the loss too depicts a clear demarcation for each quartile. As accuracy increases the corresponding loss for each quartile decreases. Similar to the accuracy of the ‘distinction-pass’ category, the learning loss also does not yield a distinct decrease.
Figure 7: ANN’s evaluation with the baseline for Q1-Q4
In order to evaluate the quarterly results, the last quartile encompassing data from Q1-4 was compared with SVM and ANN, details provided in Table 5. As illustrated in Fig. 7, the proposed model yields better accuracy compared to baseline models.
4.3 Discussion on Results and Policy Implications
This research contributes in predicting students’ performance through a deep ANN, by ascertaining significant features impacting a student’s academic performance. The student performance for four classes ‘pass’, ‘fail’, ‘distinction’ and ‘withdrawn’ is analyzed by devising each problem into binary classification and converting them to four categories; ‘pass-fail’, ‘distinction-pass’, ‘distinction-fail’ and ‘withdrawn-pass’. The study follows a twofold analysis for each of these categories, where firstly the students’ demographics and overall VLE portal information is gathered and feature construction is performed. Significant features for each of
these categories, having an impact on the student performance, are examined. For students outperforming others with distinction, their age, region and disability are observed to be negatively associated with their performance, implying that students living in the rural areas may have hindrances or connectivity issues in accessing the VLE and hence the negative association with their performance. Personal characteristics impact a student’s performance, consequently yielding to significant decisions regarding one’s education (Daud et al., 2017). For students at-risk of failure and withdrawal, their overall studied credits, highest education achieved till date and region were found to be significantly impacting their performance. The factor of age is also an important determinant for withdrawals, with an increase in age demonstrating a positive association with their performance, insinuating stability in the mindset of mature students as compared to youngsters. Moreover, for each of these categories the portal information collected after the module initiation was found to be significantly associated with an individual’s performance, implying that active participation during a module is positively associated with performance, in contrast to the activities prior the module which are found to be insignificant determinants of performance. Moreover, for both pass-fail and withdrawan-pass categories students actively clicking on the previous week’s content, to access previous lectures and material, were found to demonstrate a positive influence on performance. This factor highlights the crucial significance of the learning pattern behavior of students. The model predicts the students at-risk of failure by an accuracy of 88%, proving slightly better than other baseline models. The deep learning model correctly classifies at risk students with an accuracy of 88-89%. Similarly, ‘withdrawn’ instances are classified accurately with an accuracy of 94-95%. Also students with ‘distinction’ are predicted by the model with an accuracy of 86%, proving slightly better than other baseline models.
In the second analysis, quarterly clickstream data for each student is computed for early intervention by the university. In this analysis, temporal features are computed to timely predict the students’ at-risk of failure, those that are likely to withdraw and students achieving a distinction who outperform others in achievement. For early prediction of students’ at-risk of failure, quarterly data shows an accuracy of 77% after the first quartile which gradually rises to 88% with additional quarterly clickstream information. Similarly, in case of ‘withdrawn’ instances, a rise in accuracy from 78% to 93% is observed, suggesting the effectiveness of the deep learning model for early interventions in order to resolve student issues and motivating
them to continue their studies. In case of analysing distinction students, a distinct boundary is not observed that discretely demarcates between distinction and other instances. This can be attributed to the class imbalance problem, since ‘distinction’ instances are few in number compared to others which hinders the performance of the model. However, in the case of the ‘distinction-fail’ category, the model’s accuracy slightly increases with the data of the first two quarters and an increase is observed in the third quarter that relatively stagnates in the last quarter, suggesting the effectiveness of the model in the third quarter.
The results achieved by the study can be utilized for constructive and formative pedagogical guidelines. The early prediction of student performance will enable administrative and decision committees to adopt a pragmatic approach for timely interventions with students and influencing them in a positive manner by providing appropriate recommendations and counseling. Such an early prediction, during the academic year, will help identify weak students, offering them additional support in the learning tasks. This study provides emphasis on the efficacy of ANN for devising data-driven decision making policies, addressing issues experienced by students and consequently assisting an institution in maintaining their academic career.
5 Concluding Remarks
This study presents a contribution to knowledge in early prediction of students at-risk of low performance, determining students likely to withdraw from modules and ascertaining significant features that enable a student to outperform others. Results reveal demographic characteristics and student’s clickstream activity, after the module initiation, as having a significant impact on student performance. The participation of students with the learning environment before the modules begin has no association with their performance. This study also determines the effectiveness of the deep learning model in the early prediction of student performance, enabling timely intervention by the university to implement corrective strategies for students support and counselling. Such studies will facilitate institutes in formulating student support committees for their provision and benefits, thus helping an institute in maintaining its decorum and productivity. Due to the class imbalance problem in ‘distinction’ instances, a discrete pattern for such students was not observed, a limitation of our study. However, demographic and geographic characteristics tend to significantly impact performance. The performance evaluation model shows a sensitivity of 69%, a precision of 93% and overall accuracy of 88% in predicting at-risk
students; a sensitivity of 86%, a precision of 96% and overall accuracy 93% in predicting early withdrawals. Similarly, while ascertaining ‘distinction’ students from ‘fail’, a sensitivity of 74%, and precision of 81% and overall accuracy of 85% is achieved.
Overall, the results demonstrate the effectiveness of the deployed techniques in evaluating the early prediction of students. Such data-driven studies are required to assist higher education in the formulation of a learning analytics framework, contributing in their decision-making process. An in-depth study is required to evaluate the significance and impact of all the activities provided in the OULA dataset. In the future we intend to investigate activity-wise importance and determine activities having an influential impact on the performance by mining textual data (Thompson et al, 2017; Shardlow et al., 2018) pertaining to students’ feedback by employing natural language processing (Batista-Navarro et al., 2013) and advance deep learning models (Jahangir et al., 2017). This will enable to formulate a discrete pattern of students belonging to a certain performance category, which in the future can facilitate educational stakeholders to develop requisite pedagogical policies and guidelines. Similarly, a more detailed analysis of the day-to-day activities, for each student, will enable a more intensive exploration of such behaviors. Such data-driven studies are required for the formulation of appropriate pedagogic instructional committees to provide support to students, facilitating the higher education in their decision-making process and devising corrective policies for students’ retention.
References
Abu-Oda, G. S., & El-Halees, A. M. (2015). Data mining in higher education: University student dropout case study. International Journal of Data Mining & Knowledge Management Process, 5(1), 15.
Aljohani, Naif R., & Davis, H. C. (2013). Learning analytics and formative assessment to provide immediate detailed feedback using a student centered mobile dashboard.In 2013 Seventh International Conference on Next Generation Mobile Apps, Services and Technologies (pp. 262-267). IEEE.
Aljohani, Naif Radi, Daud, A., Abbasi, R. A., Alowibdi, J. S., Basheri, M., & Aslam, M. A. (2018). An integrated framework for course adapted student learning analytics dashboard.
Computers in Human Behavior, 92, 679-690.
Aljohani, Naif Radi, & Davis, H. C. (2012). Significance of learning analytics in enhancing the mobile and pervasive learning environments. Next Generation Mobile Applications, Services and Technologies (NGMAST), 2012 6th International Conference On, 70–74. IEEE.
Ananiadou, S., Thompson, P., & Nawaz, R. (2013, March). Enhancing search: Events and their discourse context. In International Conference on Intelligent Text Processing and Computational Linguistics (pp. 318-334). Springer, Berlin, Heidelberg.
Arnold, K. E., & Pistilli, M. D. (2012). Course signals at Purdue: Using learning analytics to increase student success. Proceedings of the 2nd International Conference on Learning Analytics and Knowledge, 267–270.New York: ACM.
Aulck, L., Velagapudi, N., Blumenstock, J., & West, J. (2016). Predicting student dropout in higher education. In 2016 ICML Workshop on #Data4Good: Machine Learning in Social Good Applications. 16–20. arXiv:1606.06364 http://arxiv.org/abs/1606.06364.
Azizah, E. N., Pujianto, U., & Nugraha, E. (2018). Comparative performance between C4. 5 and Naive Bayes classifiers in predicting student academic performance in a Virtual Learning Environment. 2018 4th International Conference on Education and Technology (ICET), 18–22. IEEE.
Azcona, D., & Smeaton, A. F. (2017). Targeting at-risk students using engagement and effort predictors in an introductory computer programming course. European Conference on Technology Enhanced Learning, 361–366. Springer, Cham.
Baker, R. S., & Inventado, P. S. (2014). Educational data mining and learning analytics. In Learning analytics (pp. 61–75). Springer, New York, NY.
Batista-Navarro, R. T., Kontonatsios, G., Mihăilă, C., Thompson, P., Rak, R., Nawaz, R. & Ananiadou, S. (2013, March). Facilitating the analysis of discourse phenomena in an interoperable NLP platform. In International Conference on Intelligent Text Processing and Computational Linguistics (pp. 559-571). Springer, Berlin, Heidelberg.
Bonafini, F., Chae, C., Park, E., & Jablokow, K. (2017). How Much Does Student Engagement with Videos and Forums in a MOOC Affect Their Achievement? Online Learning Journal, 21(4). 223–240. https://doi.org/10.24059/olj.v21i4.1270.
Capuano, N., & Toti, D. (2019). Experimentation of a smart learning system for law based on knowledge discovery and cognitive computing. Computers in Human Behavior, 92, 459-467. 10.1016/j.chb.2018.03.034.
Casquero, O., Ovelar, R., Romo, J., Benito, M., & Alberdi, M. (2016). Students’ personal networks in virtual and personal learning environments: A case study in higher education using learning analytics approach. Interactive Learning Environments, 24(1), 49–67. Chui, K. T., Fung, D. C. L., Lytras, M. D., & Lam, T. M. (2018). Predicting At-risk University
Students in a Virtual Learning Environment via a Machine Learning Algorithm.
Computers in Human Behavior. https://doi.org/10.1016/j.chb.2018.06.032.
Coelho, O. B., & Silveira, I. (2017). Deep Learning applied to Learning Analytics and Educational Data Mining: A Systematic Literature Review. In Brazilian Symposium on Computers in Education (Simpósio Brasileiro de Informática na Educação-SBIE) (Vol. 28, No. 1, p. 143).
Corrigan, O., & Smeaton, A. F. (2017). A Course Agnostic Approach to Predicting Student Success from VLE Log Data Using Recurrent Neural Networks. European Conference on Technology Enhanced Learning, 545–548. Springer.
Corrin, L., & de Barba, P. (2014). Exploring students’ interpretation of feedback delivered through learning analytics dashboards. Proceedings of the Ascilite 2014 Conference, 629–633. Dunedin, NZ.
Costa, E. B., Fonseca, B., Santana, M. A., de Araújo, F. F., & Rego, J. (2017). Evaluating the effectiveness of educational data mining techniques for early prediction of students’
academic failure in introductory programming courses. Computers in Human Behavior, 73, 247–256. https://doi.org/10.1016/j.chb.2017.01.047.
Da Silva, I. N., Spatti, D. H., Flauzino, R. A., Liboni, L. H. B., & dos Reis Alves, S. F. (2017). Artificial neural networks. Cham: Springer International Publishing.
Daniel, B. K. (2017). Big data in higher education: The big picture. In Big data and learning analytics in higher education (pp. 19–28). Cham, Switzerland: Springer.
Daud, A., Aljohani, N. R., Abbasi, R. A., Lytras, M. D., Abbas, F., & Alowibdi, J. S. (2017). Predicting student performance using advanced learning analytics. In Proceedings of the 26th International Conference on World Wide Web (WWW '17). International World Wide Web Conferences Steering Committee, Republic and Canton of Geneva, Switzerland, 415-421. DOI: doi: 10.1145/3041021.3054164.
Elakia, G., & Aarthi, N. J. (2014). Application of data mining in educational database for predicting behavioural patterns of the students. Elakia et al,/(IJCSIT) International Journal of Computer Science and Information Technologies, 5(3), 4649–4652.
Elias, T. (2011). Learning analytics. Learning, 1–22. . Available: http://
learninganalytics.net/LearningAnalyticsDefinitionsProcessesPotential.pdf.
Fei, M., & Yeung, D.-Y. (2015). Temporal models for predicting student dropout in massive open online courses. In 2015 IEEE International Conference on Data Mining Workshop (ICDMW). IEEE, 256–263. Atlantic City, NJ.
Fidalgo-Blanco, Á., Sein-Echaluce, M. L., García-Peñalvo, F. J., & Conde, M. Á. (2015). Using Learning Analytics to improve teamwork assessment. Computers in Human Behavior, 47, 149–156.
Gross, E., Wshah, S., Simmons, I., & Skinner, G. (2015). A handwriting recognition system for the classroom. Proceedings of the Fifth International Conference on Learning Analytics And Knowledge, 218–222. ACM.
Guo, B., Zhang, R., Xu, G., Shi, C., & Yang, L. (2015). Predicting students performance in educational data mining. In International Symposium on Educational Technology, ISET 2015 (pp. 125–128). Wuhan: Institute of Electrical and Electronics Engineers Inc. http://doi.org/10.1109/ISET.2015.33.
Haiyang, L., Wang, Z., Benachour, P., & Tubman, P. (2018). A Time Series Classification Method for Behaviour-Based Dropout Prediction. 2018 IEEE 18th International Conference on Advanced Learning Technologies (ICALT), 191–195. IEEE.
Hassan, S.-U., Waheed, H., Aljohani, N. R., Ali, M., Ventura, S., & Herrera, F. (2019). Virtual learning environment to predict withdrawal by leveraging deep learning. International Journal of Intelligent Systems, 34(8), 1935–1952.
Heuer, H., & Breiter, A. (2018). Student Success Prediction and the Trade-Off between Big Data and Data Minimization. DeLFI 2018-Die 16. E-Learning Fachtagung Informatik.
Hlosta, M., Zdrahal, Z., & Zendulka, J. (2017). Ouroboros: Early identification of at-risk students without models based on legacy data. In Proceedings of the Seventh International Learning Analytics & Knowledge Conference (pp. 6-15). ACM.
Hone, K. S., & El Said, G. R. (2016). Exploring the factors affecting MOOC retention: A survey study. Computers & Education, 98, 157–168.
Hussain, M., Zhu, W., Zhang, W., & Abidi, S. M. R. (2018). Student Engagement Predictions in an e-Learning System and Their Impact on Student Course Assessment Scores. Computational Intelligence and Neuroscience, 2018.