Clemson University Clemson University
TigerPrints
TigerPrints
All Dissertations Dissertations
December 2019
Midblock Crash Analysis Using Short Segments and Precisely
Midblock Crash Analysis Using Short Segments and Precisely
Geocoded Crashes
Geocoded Crashes
Adika IqbalClemson University, [email protected]
Follow this and additional works at: https://tigerprints.clemson.edu/all_dissertations
Recommended Citation Recommended Citation
Iqbal, Adika, "Midblock Crash Analysis Using Short Segments and Precisely Geocoded Crashes" (2019). All Dissertations. 2506.
https://tigerprints.clemson.edu/all_dissertations/2506
This Dissertation is brought to you for free and open access by the Dissertations at TigerPrints. It has been accepted for inclusion in All Dissertations by an authorized administrator of TigerPrints. For more information, please contact [email protected].
MIDBLOCK CRASH ANALYSIS USING SHORT SEGMENTS AND PRECISELY GEOCODED CRASHES
A Dissertation Presented to the Graduate School of
Clemson University
In Partial Fulfillment
of the Requirements for the Degree Doctor of Philosophy
Civil Engineering
by
Adika Mammadrahimli Iqbal December 2019
Accepted by:
Dr. Wayne Sarasua, Committee Chair Dr. Jennifer Ogle, Committee Co-Chair Dr. William J. Davis, Committee Member Dr. Christopher Post, Committee Member
ii ABSTRACT
This research focused on evaluating how crash geocoding has improved over the years and how this enhanced spatial accuracy of crashes can potentially lead to a new paradigm for midblock crash safety analysis. Robust midblock safety analysis exhibits special challenges because methods of locating crashes have historically not been very accurate. One objective of this research was to assess how the accuracy of crashes has improved over time and what the current state of the art is.
The second objective focused on using segment lengths less than the Highway Safety Manual (HSM) recommended minimum of 0.1 miles for statewide screening of midblock crash locations to identify site specific locations with high crash incidence through a peak search methodology. The research clearly indicates that the use of segments of 0.1 miles (or greater) in many instances’ “hides” the severity of a single location if the rest of the segment has few or no additional crashes. The research also evaluated a sliding window approach using short segments. Based on the analysis, the short segment peak search method is recommended for use by state agencies as a network screening approach because it is much less complex to implement than the sliding window approach, locations can be easily ranked, and direct comparisons can be made of segment crash incidence over multiple years.
The final objective of this research was to compare the short segment peak search approach to other HSM methods. The results of the comparison revealed similar results at the highest priority level and thus the former can be used as an alternative in case of insufficient data on driveway and roadway characteristics.
This research shows that improvements in crash geocoding makes short-segment peak search network screening viable for segment lengths less than 0.1 miles. By using short segment network screening, segments of high crash incidence can be displayed with overlayed crashes at their actual crash locations which can minimize the need for developing collision diagrams. Secondly, one of the hypotheses is that the current intersection to intersection process aggregates crashes to long segments which can mask the crash severity of point locations.
iv DEDICATION
This dissertation is dedicated to the memory of my beloved grandmother, Solmaz Rahimova, who passed away earlier this year. I am sure she is watching me and is very proud.
ACKNOWLEDGMENTS
First and foremost I want to thank my advisor Dr. Wayne Sarasua, for allowing me to be a part of the team for this project and giving me the opportunity to complete my PhD. Dr. Sarasua showed a tireless attitude towards guiding me through my program and sharing his knowledge. I am truly grateful for the support and dedication he has constantly provided for me during this research and throughout my stay at Clemson University.
I would also like to thank Dr. William J. Davis for his input in my research and writing of my dissertation.
I also would like to thank Dr. Jennifer Ogle and Dr. Christopher Post, for their technical guidance, encouragement and support during my research.
I would like to acknowledge my team of hard-working students that helped throughout the duration of this project. Completing this study would not have been possible without your hard work and diligence. Thank you Afshin Famili, for all of your help and hard work with data analysis. Additional thanks go out to Devesh Kumar, Saurbah Basnet and Emmanuel Adjei. Lastly, I want to give thanks to Dr. Kweku Brown from Citadel for his help and expertise during the analysis process. Once again, I want to thank you all for your dedication and hard work for this project was truly a team effort.
I would like to thank my husband Waqas Iqbal for his love and encouragement throughout my life’s journey up until now. I would also like to thank my parents, my sister, my nephew, my host parents and my husband’s parents for always encouraging me.
Lastly, I want to thank everyone at Clemson ITE Student Chapter who made my stay in Clemson very memorable.
vi TABLE OF CONTENTS ABSTRACT ... ii DEDICATION ... iv ACKNOWLEDGMENTS ... v TABLE OF CONTENTS ... vi LIST OF TABLES ... x LIST OF FIGURES ... xi CHAPTER ONE ... 1 INTRODUCTION ... 1 REFERENCES ... 37 CHAPTER TWO ... 7
Paper I: Assessment of Crash Location Accuracy in Electronic Crash Reporting Systems ... 7
ABSTRACT ... 7
INTRODUCTION ... 8
SURVEY OF STATES ... 13
SOUTH CAROLINA CRASH DATA EVALUATION AND GEOCODING .... 16
GIS ANALYSIS OF SOUTH CAROLINA CRASH DATA ... 19
Proximity Analysis... 21
Underlying Roadway Centerline Map Consistency ... 22
Travelway Analysis ... 24
Case Study: Analysis of Driveway Related Crash Data ... 25
Case Study: Analysis of Driveway Related Crash Data Within 150 feet of intersections ... 29
Case Study: Statewide Screening of Mid-block Crash Locations Using Short Segments ... 31
CONCLUSION ... 34
REFERENCES ... 37
CHAPTER THREE ... 41
Paper II: Short Segment Statewide Screening of Midblock Crashes in South Carolina ... 41
ABSTRACT ... 41
INTRODUCTION ... 42
LITERATURE REVIEW ... 46
Crash Screening using Segment Based Analysis Methods ... 46
viii
Literature Review Summary ... 50
METHODOLOGY ... 50
Segmentation (Peak Search) Approach using Polygon Buffers ... 50
Short Segment Buffers ... 51
Aggregating Crash Data to Segment Buffers ... 54
Network KDE ... 54
RESULTS AND DISCUSSION ... 59
NETWORK SCREENING USING 100 FOOT SEGMENTS STRATIFIED BY ROADWAY TYPE ... 64
CONCLUSIONS... 66
REFERENCES ... 67
CHAPTER FOUR ... 74
Paper III: Assessing the Predictability of Short Segment Crash Analysis in the State of South Carolina ... 74
ABSTRACT ... 74
INTRODUCTION ... 75
LITERATURE REVIEW ... 78
Evaluation of Network Segmentation with Other Safety Methods………... 78
The Impact of Segment Length in Peak Search Method... 79
Literature Review Summary ... 82
METHODOLOGY ... 82
Short Segment Network screening method ... 86
South Carolina Calibrated SPFs... 87
Predicted Crash for each driveway Based on segment AADT ... 88
Predicted Crash for each Driveway Based on Driveway Characteristics ... 89
RESULTS AND DISCUSSION ... 91
Validation of short segment method using South Carolina Calibrated SPFs 91 Validation of short segment method using Driveway SPF (considering only AADT) ... 93
Validation of short segment method using Driveway SPF (considering driveway characteristic) ... 94
CONCLUSIONS... 96
REFERENCES ... 96
CHAPTER FIVE ... 100
CONCLUSION ... 100
x LIST OF TABLES
Paper I: Assessment of Crash Location Accuracy in Electronic Crash Reporting Systems
Table Page
1: Percent of Crash Data by Geocoded Category and by Year ... 199
2: Average Distance of Crashes from Route Centerline by Year ... 21
3: Percent of Highway Patrol Crash Data Identified by Corridor by Year ... 255
4: Number of Driveway Crashes Occurring within Close Proximity to Intersections ... 30
Paper II: Short Segment Statewide Screening of Midblock Crashes in South Carolina Table Page 1: Common characteristics used to define reference populations ...43
2: Critical Crash Segments for various lengths of segments ...60
Paper III: Assessing the Predictability of Short Segment Crash Analysis in the State of South Carolina Table Page 1: Roadway types by definitions ...84
2: Shows the different coefficient values used for each roadway types ...88
3: Crash Modification Factors (14) ...90
4: Validation of Short Segment Method Using Roadway Predicted SPF ...93
LIST OF FIGURES
Paper I: Assessment of Crash Location Accuracy in Electronic Crash Reporting Systems
Figure Page
1: Proportions of paper based, electronic crash, and other report forms by state ... 155 2: Rear-end and angle crashes on US 25 in Greenville, SC for 2010 (left) and 2012 (right) (images from Bing Maps) ... 21 3: a) 2012 RIMS centerline map; b) Updated RIMS centerline map (image from Google Earth)... 233 4: Crashes over a three-year period on US highway 17 in Berkeley County, SC ... 26 5: Driveway Influence Buffers Overlayed with 2010 and 2012 Crashes (image from Google Maps) ... 288 6: Driveway related crashes on US Highway 176 in Richland County, South Carolina. (image from Bing Maps) ... 31 7: A length of Broad River Road in Columbia, SC showing 50 ft road segments with 4 or more crashes in 2012 . (image from Google Earth) ... 33 8: Dangerous horizontal curve on Reid School Rd, Taylor, SC . (image from Google Earth)... 34
Paper II: Short Segment Statewide Screening of Midblock Crashes in South Carolina
Figure Page
1: Rear-end and angle crashes on US 25 in Greenville, SC for 2010 (left) and 2012 (right) (images from Bing Maps) ...45 2: Geocoded Crashes in South Carolina: a) 2004 all; b) 2012 Highway Patrol ...51
xii List of Figures (Continued)
Figure Page
3: Roadway Buffer created using Roadway Width ...52
4: Continuous vs Critical Crash Segments (50 ft) in Anderson County, SC ...53
5: A length of Broad River Road in Columbia, SC showing 50 ft Road Segments with 4 or more Crashes in 2012 ...55
6: Dangerous horizontal curve at Reid school Rd towards Wade Hampton Blvd, Taylor 56 7: Partial clover interchange ramp using 2012 and 2016 data at Liberty Highway, Anderson ...56
8: Midblock driveway location with an unusually high incidence of crashes at Dick Pond Rd / Strand Market Dr. near Myrtle Beach ...57
9: Woodruff Road, Greenville ...60
10: Crashes concentrated at a single driveway (Woodruff Road, Greenville) ...61
11: NKDE method with bandwidth of a) 50 ft b) 100 ft ...62
12: (a) NKDE using 100 ft bandwidth (b) Peak Search using 100 ft window size ...63
13: Comparison of highest ranked segments using 100 ft segments stratified by roadway type. ...65
Paper III: Assessing the Predictability of Short Segment Crash Analysis in the State of South Carolina Figure Page 1: Flowchart of the study ...83
2: Comparison of 3 methods ...85
3: Top U5T Short Segments for 2017 ...92
4: Comparison of year 2018 highest ranked segments using 100’ segments stratified by roadway type with driveway SPF (Blue: percentages matched with driveway SPF) ...95
CHAPTER ONE INTRODUCTION
Over the last several years, traffic fatality rates in South Carolina have been consistently ranked amongst the highest in the country (1). Throughout the nation, a lot of emphasis has been put on intersection crashes over the years. Intersection crashes are typically geocoded more accurately than other crashes because they are explicitly associated with intersections as part of the crash attributes (2). Midblock crashes are segment oriented and studies have shown that for the most part most analysis is done on an intersection to intersection basis using very long segments. A review of literature indicates that there has not been a great deal of midblock safety analysis research using smaller segments. Midblock safety analysis exhibits special challenges because methods of locating crashes have historically not been very accurate. Recent developments in crash geocoding techniques have improved spatial accuracy. This research focuses on evaluating how crash geocoding has improved over the years and how this enhanced spatial accuracy of crashes can potentially lead to a new paradigm on midblock crash safety analysis. Several years of South Carolina crash data is used in this research. It is anticipated that the findings of this research are transferable to other states because of the sample size of the data used. In actuality, the research was conducted using all reported midblock crashes for all roadway classes over a multi-year period. The research has three primary objectives discussed in the following paragraphs.
2
The first objective of the research is to assess how the accuracy of crashes has improved over time and what the current state of the art is. Case studies are used in the assessment of the accuracy of South Carolina crash data and a survey of state highway agencies conducted as part of this research will be used to assess the current state of the art in crash geocoding across the US.
The AASHTO Highway Safety Manual (HSM) presents a variety of methods for quantitatively estimating crash frequency or severity at a variety of locations (3). The HSM predictive methods require the roadway network to be divided into homogeneous segments and intersections, or sites populated with a series of attributes. It recommends a minimum segment length of 0.1 miles. A review of literature indicates that segments lengths less than 0.1 miles are not advisable because findings are highly variable. These findings are based on crash data with questionable spatial accuracy. The second objective of this research focuses on segment lengths of less than 0.1 miles for statewide screening of midblock crash locations to identify site specific locations with high crash incidence. The hypothesis is that improved spatial accuracy of crashes can result in worthwhile analysis using segments less than 0.1 miles. Different analysis methods will be used to look at short segments.
The final objective of this research is to compare the new network screening identified upon completion of the second objective to other HSM methods.
It is anticipated that the findings of this research will show how improvements in crash geocoding can enhance safety analysis. This research could potentially lead to a
changing paradigm of how network screening of midblock crashes is done by state agencies.
This dissertation document consists of three research papers on transportation safety. These papers make use of South Carolina Crash Data over fourteen years (2004 – 2018). Each paper focuses on one objective of this research and accounts for one chapter of the dissertation. The objectives are restated below along with the titles of each paper and the tasks performed towards achieving the research objectives.
PAPER I: Assessment of Crash Location Accuracy in Electronic Crash Reporting Systems
Objective 1
Assess how the accuracy of crashes has improved over time and what the current state of the art is. Case studies are used in the assessment of the accuracy of South Carolina crash data and a survey of state highway agencies conducted as part of this research will be used to assess the current state of the art in crash geocoding across the US.
Tasks
Task 1: Deploy a survey and send to all state transportation agencies to better understand data collection and network screening methods.
Task 2: Acquire 2010 – 2018 South Carolina Crash Data and geocode on ArcMap.
Task 3: Use of different analysis methods to compare the accuracy of the different crash geocoding methods used in South Carolina throughout the years. Mi
4
PAPER II: Short Segment Statewide Screening of Midblock Crashes in South Carolina
Objective 2
Develop fixed-length segmentation network screening approach to identify the top midblock segments for each roadway type that has the highest crash incidence in the state.
Tasks
Task 1: Create a GIS layer representing the road surface variable buffer using the roadway width attribute in the SCDOT road characteristics database.
Task 2: Test different segment lengths and width and compare results.
Task 3: Segment the buffered layer using the different fixed segment length. Task 4: Aggregate crash data to segment buffers.
Task 5: Compare peak search method to NKDE (Network Kernel Density Estimation) method.
PAPER III: Assessing the Predictability of Short Segment Crash Analysis in the State of South Carolina
Objective 3
Compare fixed-length segment approach to other Highway Safety Manual (HSM) methods.
Tasks
Task 1: Create Midblock segmentation from Intersection to Intersection for the entire state.
Task 2: Obtain AADT data from Database (DOT).
Task 3: Calculate SPF’s for each segment and predict number of crashes Task 4: Find excess and rank the obtained segments and compare with short segments method.
Task 5: Obtain number of Buffers from Short Segment method that are also in the high ranked SPF’s segment.
Predicted SPF on Driveway using only AADT
Task 6: Segment Roadway based on Short Segments screening method and obtain buffers for the entire roadway.
Task 7: Calculate predicted SPF driveway value considering Task 8: Find excess and rank the buffers based on excess
Task 9: Obtain high ranked buffers from Short Segment method that match with the high ranked predicted SPF for driveway.
Predicted SPF for driveways adjusting with CMFs
Task 10: Segment Roadway based on short segment screening method and obtain buffers for the entire roadway.
Task 11: Calculate predicted SPF for each driveway adjusted based on driveway characteristics.
6
Task 13: Obtain high ranked buffers from short segment method that match with the high ranked CMF buffers,
***Two papers have been submitted to Transportation Research Board Journal (one being already published) and third paper is in the process of being submitted to scholarly journals.
The next three chapters (Chapter Two, Chapter Three and Chapter Four) contain the three research papers introduced in this chapter, followed by the dissertation conclusion in Chapter Five and then appendices.
REFERENCES
1. South Carolina Department of Public Safety (SCDPS). South Carolina Traffic Collision Fact Book 2013-17. http://www.scdps.gov/ohsjp/stat_services.asp , Accessed March 10, 2017.
2. AASHTO, 2010. Highway safety manual, 1st Edition. American Association of State Highway and Transportation Officials, Washington, D.C.
3. AASHTO, 2010. Highway safety manual, 1st Edition. American Association of State Highway and Transportation Officials, Washington, D.C.
CHAPTER TWO
Paper I: Assessment of Crash Location Accuracy in Electronic Crash Reporting Systems
Co-authors of the paper: Wayne A. Sarasua, Kweku Brown, Jennifer H. Ogle, Afshin Famili, William J. Davis, Saurabh B. Basnet, and Devesh Kumar.
Paper I got accepted by the Annual Meeting of the Transportation Research Board and publication decision is pending.
ABSTRACT
Over the past several years, traffic fatality rates in South Carolina have been consistently ranked amongst the highest in the country. Furthermore, South Carolina incurs an annual economic loss of over two billion dollars due to roadway traffic crashes. The South Carolina Department of Transportation (SCDOT), in collaboration with the South Carolina Department of Public Safety (SCDPS), has undertaken a series of initiatives to reduce the number of annual vehicle crashes, with a particular emphasis on injury and fatal crashes. One of these initiatives is the deployment of a map-based geocoded crash reporting system that has greatly improved the quality of crash location data. This paper provides an assessment of improvements in crash geocoding accuracy in South Carolina and how improved accuracy is beneficial to systematic statewide safety analysis. A case study approach is used to demonstrate practical applications and
8
analysis techniques based on spatially accurate crash data. A survey of state highway agencies indicates that there are disparate crash reporting systems used across the country with regard to crash geocoding procedures and accuracies. Survey results indicate that not only does geocoded accuracy of crash locations vary by state, accuracies often vary by jurisdiction within each state. Research results suggest that poorly geocoded crash data can bias certain types of safety analysis procedures and that many state safety initiatives, analysis methods, and outcomes can benefit from improving crash report geocoding procedures and accuracies.
INTRODUCTION
From 2014 through 2018 approximately 4,852 motor vehicle-related deaths occurred in South Carolina resulting in an average of 970 traffic fatalities per year over the five-year period. These rates are considerably higher than the national averages of 1.16 fatalities per 100 million VMT and 11.52 fatalities per 100,000 populations. In 2017 alone, there were 988 traffic fatalities in South Carolina resulting in rates of 1.78 fatalities per 100 million vehicle miles traveled (VMT) and 19.70 fatalities per 100,000 population (1). Further, South Carolina incurs an annual economic loss of over two billion dollars due to road traffic crashes (2).
Recent efforts by the South Carolina Department of Transportation (SCDOT) to reduce vehicle crashes, in particular injury and fatal crashes, within the state led to development of the 2015-2018 South Carolina’s Strategic Highway Safety Plan (SHSP):
Target Zero. Published in 2015, the SHSP was the result of concerted efforts by SCDOT, South Carolina Department of Public Safety (SCDPS), South Carolina Division Office of the Federal Highway Administration (FHWA) and other local, state, and federal road safety advocacy groups and agencies. The primary goal of SHSP is to eventually eliminate traffic fatalities and significantly reduce injuries in South Carolina. SHSP emphasizes data-driven, evidence-based recommendations for appropriate strategies and countermeasures to achieve its safety goals (2).
In the previous SHSP published in 2007, improved crash reporting was deemed as essential for safety analysis (4) which led to the development and deployment of an electronic crash reporting system. The 2015 SHSP has recommended continued enhancement of the system (3). This system, known as the South Carolina Collision and Ticket Tracking System (SCCATTS), has grown substantially in its development and implementation since 2007. Starting in 2010, the electronic collision report form component of SCCATTS was deployed to the South Carolina Highway Patrol (with 100% compliance by January 2012) and has since been adopted by local law enforcement agencies throughout the state. The main reason of using SCCATTS was to improve accuracy and timeliness from date of crash to date of data available in the collision master file (5). Recent estimates indicate more than 75% of collision report forms are being submitted to SCDPS electronically which has decreased the number of days for processing a collision report from 35 or more days in 2010 to 5 days or less currently. One of the biggest benefits envisioned for SCCATS implementation was use of mapping software integrated within the electronic reporting hardware that would allow for more accurate
10
reporting of collision locations. The 2015 SHSP specifically states “…proper identification of where a collision occurred is of utmost importance to SCDOT for planning purposes.” (3)
Research indicates that accurate crash location data improves reliability of safety analyses and evaluation of countermeasure effectiveness (6,7,8 and 9). Among multiple attributes in a crash data set, the location of a crash is of utmost importance because, crash records with inaccurate locations cannot be considered in the analysis. Excluding crash records can result in under-reporting crash rates, which creates bias in prediction models. This paper provides an assessment of improvements in crash geocoding accuracy in South Carolina and how this improved accuracy can benefit safety analysis. A case study approach is used to demonstrate practical applications and analysis techniques based on spatially accurate crash data. The emphasis of these case studies is predicated on analysis of midblock crashes because locations of midblock crashes are more prone to error compared to intersection crashes (16). Intersection crashes are point oriented and associated with the intersection of two cross-streets on a map; whereas, locating midblock crashes has historically been based on a police officers’ estimate of distance from the nearest intersection. In many cases, officers estimate this distance to the nearest ¼ mile. Surveys of state highway agencies are presented that provide the current state of practice in crash reporting and crash geocoding across the country. It is anticipated that many states can enhance safety analysis by improving their crash report geocoding methods. A discussion is also included on how South Carolina’s crash reporting system can potentially be further improved by taking advantage of some of the best practices found in other states.
LITERATURE REVIEW
Many states have replaced old methods of data collection with new technologies such as the use of laptops or other electronic devices to collect crash report data and the use of barcode scanners to record the licenses of drivers involved in crashes (11). From an infrastructure standpoint, systems developed to improve crash location characteristics are inherently important, because without a spatial context for the crash problem, it is much more difficult to identify potential contributing factors. Understanding the crash context is critical to identifying appropriate countermeasures, as well as where the improvements should be implemented to have the greatest potential impact.
For many decades, DOTs have defined crash location using route identifiers along with distances to reference points (e.g. route mile post system, route reference point system and link node system) (10). While these methods may appear appropriate, there are several problems associated with their use for crash locationing. For instance, there is not always a single universal route identifier used by all agencies within the state and often a route has multiple designations (e.g. the section of interstate going through downtown Atlanta, Georgia which is designated as both I-85 and I-75). Furthermore, some secondary routes have multiple names and numbers, and many change names over time. Distance measurements are similarly difficult. For example, some police officers may not have the proper equipment or time to measure the distance. They may estimate distances using a value such as ¼ mile which may result in a spatially inaccurate cluster of crashes exactly 1320 feet from an intersection. Additionally, when measurements are based on reference points or crossing streets, the notation becomes complex and the
12
location may be misconstrued. Lastly, these methods of identifying crash locations may not provide precise locations of crashes in the travelway (or adjacent to the travelway in many instances). Due to drawbacks associated with these methods, many states have added coordinate locations using GPS technology.
By the mid 2000’s, states such as Iowa, Illinois, Kentucky and Massachusetts developed and deployed electronic crash data collection systems for widescale use by law enforcement officers (11). Iowa’s Traffic and Criminal Software (TraCS) consists of bar code scanners, swipe-card readers, digital cameras, GPS technology, a GIS viewer and touch pads to aid digital data entry (11) As of 2007, TraCS had been adopted in 18 states and 2 Canadian provinces (12). More recently, Alabama combined an electronic citation (E-Citation) application with the state’s crash database analysis software into a system called Critical Analysis and Reporting Environment (CARE). The system includes a GIS platform where police officers map vehicle crash and traffic citation locations (11). Other states including Louisiana and Tennessee have also recently adopted similar systems and have achieved improvement in the quality of their crash data (13). Florida uses a web based geospatial crash analytical tool called Signal Four Analytics. It is designed to support the crash mapping and analytical needs of law enforcement, traffic engineering, transportation planning agencies, and research institution in the state of Florida.
The transition to the use of GPS technology in crash data collection in South Carolina began in 2004 when SCDOT purchased hand-held GPS units for law enforcement officers to collect coordinate (latitude, longitude) information for crash reports. The use of these hand-held GPS units was not automated, and officers had to
read coordinates from the GPS unit and manually record values on the crash report. Information from the paper report would later be keyed into a digital database. Although use of GPS units was advantageous over traditional location referencing methods, there were many issues associated with operation of GPS units, recording of location data on paper crash reports and processing of data. (14, 15).
The deployment of SCCATTS currently used by South Carolina highway patrol and nearly half of local jurisdictions has resulted in considerable improvement in crash data quality. The system enables law enforcement officers to spatially identify and locate crashes via a GIS-based GPS enabled mapping platform operational within police
vehicles. The GPS displays the vehicle’s location on the GIS map display and officers can pinpoint the actual location of the crash rather than where an officer’s vehicle is situated (e.g. on the side of the road or in a parking lot, etc.). Officers can key in all other information related to the crash, which is later uploaded to the SCDPS database and later transferred to SCDOT. Pinpointing crash locations not only lead to more accurate
coordinate data provided on crash reports, but also populates other location information data fields on the crash report automatically (5).
SURVEY OF STATES
The literature review indicated that numerous states have transitioned to computer-based crash reporting and geocoding methods, while many others are still using paper-based systems. In an attempt to better understand data collection and network screening methods, the research team developed and distributed a survey that was sent to all state
14
transportation agencies during the Spring, 2019. The survey included 36 questions and was subdivided into five sections: 1) contact information; 2) crash report collection methods; 3) crash data collection training; 4) crash geocoding; and 5) network screening (Appendix A). In total, 29 responses were received representing 24 different states. For states providing multiple responses, their data was combined into a single response to eliminate redundancy.
Of particular interest regarding basis of comparable crash data, was a survey question in Section 1 that asked, “What is the most recent full year of crash data that your state department of transportation is working with?” Of the 24 states responding, 10 (42%) indicated 2018, 12 (50%) indicated 2017, and two states indicated 2016 and 2015, respectively.
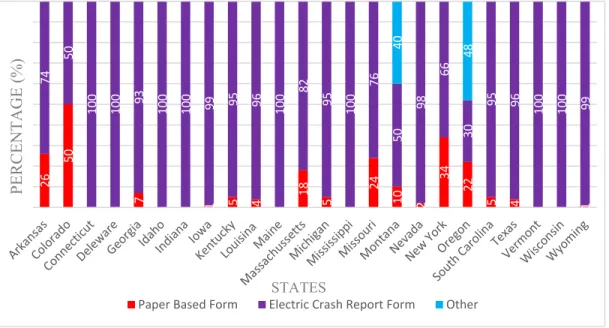
Crash Report Collection Method aaaaaaaaaaaaaaaaaaaaaaaaaaaaaaaaaaaaaa The survey included 13 questions related to crash report collection methods. It also indicated that all the states surveyed are using electronic crash report data collection methods to some extent with most having transitioned from fully paper-based reporting in the last 10 years. In a “check all that apply” question, the most common reasons for the transition were to minimize coding errors, enable consistency checks, and automate uploading. Improved geo-locating was also mentioned by some respondents, but to a lesser extent. Figure 1 shows the approximate proportion of crash reporting using paper or electronic reporting methods. The figure indicates that all responding states have at least 50% electronic reporting of crash reports with the majority (17 of 24) having 90% or more recorded electronically. Montana has multiple electronic crash reporting systems however
the system used by major cities cannot currently be directly uploaded into the state database. These reports are printed and input manually. Some states indicated other methods, such as Oregon which uses self-report for all property damage only crashes.
Figure 1: Proportions of paper based, electronic crash, and other report forms by state
In terms of the electronic crash reporting systems used by the state, most of the states use a system developed by a commercial vendor while some states use a system developed in-house. Five different commercial systems were identified: CAPS, CTA SmartCop, LexisNexis, ReportBeam, and TraCS. South Carolina’s SCCATTS uses the ReportBeam platform.
Crash Geocodingaaaaaaaaaaaaaaaaaaaaaaaaaaaaaaaaaaaaaaaaaaaaaaaaaaaaaaaaa When asked which methods (check all that apply) are used to capture the location of a crash in the field, 12 states use Mile Point Method, 18 use Primary/Secondary Street Name and
26 50 7 1 5 4 18 5 24 10 2 34 22 5 4 1 74 50 100 100 93 100 100 99 95 96 100 82 95 100 76 50 98 66 30 95 96 100 100 99 40 48
Paper Based Form Electric Crash Report Form Other
PER C EN TA G E ( % ) STATES
16
Distance from Intersection, 6 use Handheld GPS (coordinates entered or written on crash report manually), 18 said Map-based (with or without integrated GPS), and 6 answered other. Two of the “other” responses (Louisiana and Montana) had integrated GPS but not map-based fine tuning of the position. At least one state (Massachusetts), allows entry of nearest landmarks.
For map-based systems, states were asked what map background was used and 18 responded. The four answers given were Road Centerline Map [6], Street View Map [5], Aerial/Satellite Imagery such as Google Maps [5], and other [5]. Kentucky indicated that the officer can use a centerline map background with or without aerial imagery.
One question asked “For the most recent year, what percentage of crash locations are accurately geolocated on the total road network?” The response indicated that roughly 1/3 of the respondents believe that less than 80% of crashes in their state are correctly geocoded and nearly 1/2 of the respondents believe that greater than 90% of crashes in their state are correctly geocoded. Nearly all of the states indicated that they go through a process to validate the location accuracy of crashes and indicated that if a poorly geocoded crash location was identified a correction would be made. q
Survey Discussing ---The survey of state highway agencies indicates that there are disparate crash reporting systems used across the country from a crash geocoding standpoint. All of the states have implemented electronic crash reporting to some extent however, geocoding methods and accuracy varies by state and also may vary by jurisdiction within a state.
SOUTH CAROLINA CRASH DATA EVALUATION AND GEOCODING
Over the past decade, the major initiatives by SCDOT and SCDPS have proven to be effective in improving crash data. Crash location data accuracies are
compared and contrasted between data recorded using hand-held GPS units from 2004 to 2010 and GIS-based map location system data, beginning in 2011. Comparisons are based on geocoding 15 years (2004 – 2018) of South Carolina crash data including an analysis of over 1.4 million crashes contained in the statewide geocoding database.
2004 crash location dataset was first geocoded as a baseline to assess the quality of the crash data. Geocoding results indicated 28% of 2004 crash data was geocoded outside of the state boundary, which provide a finding of great concern. Crash location results did not improve considerably until after 2010. By 2018, nearly all crashes geocoded within the state bundary. A review of the data geocoded by handheld GPS for all 15 years resulted in the identification of several systematic errors and erroneous inputs that were consistent with findings from a previous study by Sarasua in 2008 (17).
Common and recurring problems in the crash database include:
1. Several crash records were in Decimal Degrees (DD), not
Degrees-Minutes-Decimal Seconds (DMS) as referenced in the crash data reporting manual.
2. Some crash records were in state plane coordinates, not latitude and longitude
3. Several crash records were missing either longitude or latitude or both 4. Some crash records had their longitude and latitude values swapped
18
5. Most of the latitude values did not include a negative sign
6. Several coordinates were recorded with insufficient precision by one or two decimal places
7. Some crash records had spaces and letters as part of the coordinate entry 8. Some coordinates included additional zeroes to make up for the
insufficient precision
9. Some crash records had erroneous coordinate values
Many crash records contained a combination of errors. For example, a crash record could have swapped latitude and longitude and at the same time have insufficient precision. The causes of errors include improper settings of the GPS equipment, errors by officers recording the coordinates, and errors by data entry personnel who transcribe information from the handwritten crash report into a digital database (17). A summary of the percentages of the geocoded data in each category by year is provided in Table 1. Trends in Table 1 indicate significant improvements in the consistency of geocoded crash data after 2010. The use of decimal degrees and state plane coordinates was virtually eliminated. While much of this improvement can be attributed to the use of SCCATTS, methods for using handheld GPS by local jurisdictions also improved. SCDOT indicated that this was possibly due to enhanced training. More recent improvements in consistency can be attributed in part to the increased proliferation of SCCATTS to local jurisdictions. It should be noted that nearly all highway patrol officers were using SCCATTS by the beginning of 2012.
Table 1: Percent of Crash Data by Geocoded Category and by Year
A separate analysis was conducted for geocoded crash data collected and recorded by highway patrol only. The consistency of highway patrol data is much better, even before the deployment of SCCATTS. Coordinates in DMS format was 88% and improved steadily to reach 96.6% in 2010. This is most likely due to the highway patrol receiving better training in proper use of handheld GPS than local jurisdictions. By 2013, after full deployment of SCCATTS within the highway patrol, virtually 100% of crash data was consistently geocoded in DMS format.
GIS ANALYSIS OF SOUTH CAROLINA CRASH DATA
Additional spatial analysis focused on the accuracy of geocoded crash data was conducted to further evaluate the improved spatial accuracy of geocoded crash data. ESRI’s ArcGIS was used in all GIS analysis discussed in the paper. Nine years of crash data (2010-2018), with systematic errors removed or corrected (e.g. swapped longitude and latitude), were used. The highest-ranking corridors from a crash standpoint were the focus of this study.
20
Highway patrol officers, using hand-held GPS units, collected the majority of 2010 crash data. While much of 2011 and nearly all the 2012 data and beyond were collected using SCCATTS. An indication of the difference in precision of the two methods can be seen in Figure 2. The US-25 corridor example in Figure 2 shows that while 2010 crashes are mostly located on the sides of the roadway, or in parking lots, most of the 2012 crashes are shown on the roadway and in the location most likely to be where the crash actually occurred. A probable explanation for why 2010 data were mostly off the roadway is that most police officers would park their vehicles on the side of the roadway, or in parking lots, when filling out parts of the crash report and would read and record GPS coordinates on the GPS unit wherever they were parked.
The 2011 and 2012 data collection using the GPS enabled GIS-based map provided the police officers the tools to identify the approximate crash location using GPS, and then accurately locate (or pin map) the crash at the precise location it occurred on the map, even when parked on the side of the road, or in a parking lot.
Figure 2: Rear-end and angle crashes on US 25 in Greenville, SC for 2010 (left) and 2012 (right) (images from Bing Maps)
Proximity Analysis
A proximity analysis was conducted to determine if there was a change in crash location relative to a roadway’s centerline before and after the implementation of the SCCATTS. The distance of each crash from its corridor centerline was calculated and averaged by corridor using spatial analysis tools in ArcGIS for the 3-years of comparable data. Table 2 shows the results of the proximity analysis for the top five selected corridors, based on average crash rank.
22
The table clearly shows considerable change in crash locations relative to roadway centerlines from 2010 crashes (predominantly recorded with a hand-held GPS unit) to 2011 (predominantly SCCATTS). A paired t-test was conducted to test the null hypothesis that the difference between the 2010 and 2011 means is zero. Results of the t-test indicated a p-value < 0.001 and thus the null hypothesis was rejected with 99% confidence level indicating that the means are different. A similar finding was found for the difference between the 2010 and 2012 means. However, the null hypothesis that the difference between the 2011 and 2012 means is zero had a p-value of 0.08 and thus cannot be rejected for 95% confidence level (indicating that the difference in the means can be explained by random error).
Underlying Roadway Centerline Map Consistency
SCCATTS uses a roadway centerline map as a background reference for officers to use to geocode crashes. The centerline map is the same one used for SCDOT’s Roadway Information Management System (RIMS). RIMS is a comprehensive geospatial-based database system that accounts for all data for SCDOT’s transportation roadway inventory. A closer look at the RIMS centerlines indicates some problematic issues at some locations. For example, in some instances the RIMS centerline is erroneously offset from its actual location. Police officers using an erroneous centerline as reference to geocode a crash will locate the crash offset from where it actually happened. SCDOT periodically corrects errors it identifies in the RIMS centerline map which are eventually uploaded to officer’s laptops however these uploads are currently done manually and very sporadically. Figure
3 shows a RIMS centerline map comparison between 2012 and 2018. An aerial map is shown in the background to provide reference. In Figure 3(a), the 2012 RIMS centerline is offset to one of the roadway directions near the major intersection. The 2018 crash data (shown as black squares) in the westbound direction overlaid on this RIMS centerline does not follow the 2012 centerline. The 2018 RIMS map shown in Figure 3(b) shows corrected centerlines and the 2018 crash data for the westbound direction does follow the new centerlines (as they should). Changes to the RIMS centerline map used by officers might be a problem when comparing crash data between different years that were geocoded using different RIMS centerline files. Inconsistency in using the RIMS data between different jurisdictions was also observed. For instance, the 2018 crashes described earlier for the westbound approach are pinpointed for both the directions and follows the 2018 RIMS centerline map. For the same year, the crashes in the northbound seem to be coded referencing the 2012 centerline map. Thus, police officers are not using consistent RIMS centerline data for the same years.
Figure 3: a) 2012 RIMS centerline map; b) Updated RIMS centerline map (image from Google Earth)
24
Travelway Analysis
While results from the proximity analysis indicate a distinct change occurred in average distance from centerline for crash data collected after 2010, an additional evaluation was conducted to identify the proportion of crashes that fell within the roadway corridor’s travelway before and after implementation of SCCATTS. The same five corridors were used in this analysis. Offset lines such as lane lines, edge of pavement, and travelway limits are not included as RIMS GIS data layers, however, travelway width is included as a RIMS attribute. The buffer by attribute capability was used in ArcGIS to synthetically generate edge of travelway polygons for all five corridors. Buffering using buffer by attribute creates a polygon based on an attribute of individual segments, which in this application, buffered the roadway centerline segments using the buffer distance as half of the RIMS travelway width attribute value.
Using GIS point-on-polygon spatial aggregation, the crash data was overlayed with the travelway buffer polygons to identify crashes that are geocoded within the travelway corridors. Table 3 shows the results of this analysis. It shows that only 35% of the 2010 crashes fall within the travelway even though it is likely that nearly all of the types of crashes used in this analysis occurred in the travelway. It should be noted that fixed object and run-off-the-road crashes were omitted from the analysis because of the likelihood that these crashes could occur outside the travelway. Further analysis of the sections of the routes listed in Table 3 reveals that 2010 crash percentages do not accurately represent the potential conflict points where crashes are expected to be most prevalent (in the travelway). Conversely, most of the 2011 and nearly all of 2012 crash data do fall within the travelway
in locations where potential conflicts are common. The improved performance between 2011 and 2012 is because SCCATTS was not fully deployed until the beginning of 2012. Table 3: Percent of Highway Patrol Crash Data Identified by Corridor by Year
Case Study: Analysis of Driveway Related Crash Data
A recent SCDOT research project focused on developing safety performance functions (SPFs) and crash modification factors (CMFs) for commercial driveways in South Carolina (16). Spatial analysis focusing on the accuracy of geocoded driveway crash data was performed as part of this research. Three years (2010-2012) of crash data was used for the geocoded accuracy analysis. Crashes that were potentially driveway related (i.e. coded with junction type –‘driveway’ or coded with a ‘manner of collision’ of ‘rear-end’ or ‘angle’ or ‘side-swipe’ or ‘head-on’) were extracted for use in this study. The improved spatial accuracy of crashes makes it possible to pinpoint the locations where clusters of crashes occur in relation to a driveway. This is evident at the location shown in Figure 4 on US 17 in Berkeley County, South Carolina. The image shows a number of driveway related crashes (junction type ‘driveway’ shown with stars) occurring when vehicles attempt to enter or exit from adjacent high turnover driveways across a left-turn
26
bay. The accuracy of crash data prior to 2010 (Blue Color) would not produce evidence of these clusters making it difficult to identify where crashes occur relative to driveways unless the sketches made by officers on the original crash reports are analyzed individually.
Figure 4 Crashes over a three-year period on US highway 17 in Berkeley County, SC *Coded driveway related crashes shown with stars. Note the proximity of the crashes relative to the left-turn bay. (Image from Google Earth)
To model the CMFs based on driveway characteristics it is necessary to associate driveway crashes with driveways. The junction type code included in the crash report includes driveway as one of the options. Unfortunately, a detailed analysis of the driveways along several selected corridors in South Carolina indicated that the driveway code was not used for more than 60% of crashes that were clearly driveway related based on crash type and proximity to driveways. Thus, a spatial analysis approach was developed to associate crashes with driveways. After querying possible crash types that could be associated with driveways (e.g. angle, rear-end, etc), the analysis assumption is that crashes
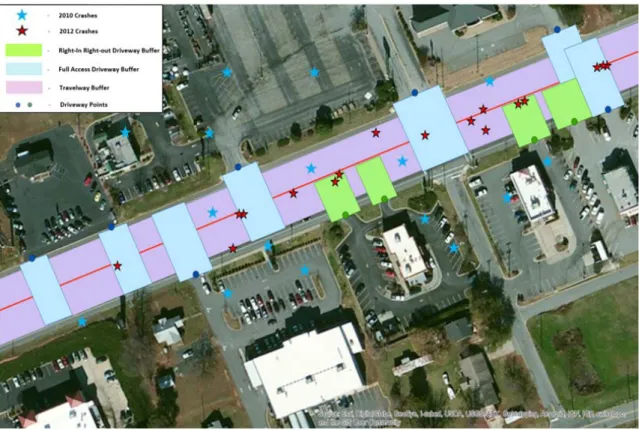
in an influence area of a driveway is a driveway related crash of that driveway. It is crucial that the driveway influence areas are as precise as possible in order to evaluate the driveways effectively. One approach is to use ArcGIS buffer techniques to buffer an area on the travelway adjacent to each driveway to delineate the influence area. Once these buffers are created, they can be overlaid with underlying crashes to do the association. One problem with this approach is that the resulting driveway buffers would be circles around the point that represents the location of the driveway. This would bias crashes that occur closer to the side of the road. Ideally, rectangular buffers would give a better indicator of a driveway’s influence area. Thus, the researchers developed a model that could make rectangular buffers that stretched across the roadway (16). Two models were created depending on driveway type: a model for full access driveways that creates buffers extending across all travel lanes; and a model for right-in right-out (RIRO) driveways that creates buffers that extend to the roadway centerline. Both models used the driveway width attribute from the driveway database to create the driveway buffer. The driveway buffer width is the driveway width plus thirty feet to accommodate about a car length on each side of the driveway. Figure 5 shows resulting driveway influence area buffers along with 2012 driveway related crash data that fall within the buffers. Note that none of the 2010 crashes shown in the figure fall within the driveway buffers.
28
Figure 5: Driveway Influence Buffers Overlayed with 2010 and 2012 Crashes (image from Google Maps)
The analysis revealed an average crash incidence of 0.46 crashes per driveway using 2012 data. The analysis showed a much lower crash incidence (less than 0.1) for the same corridors using 2010 data. The 2010 rates are biased because poor geocoding precision placed most of the driveway related crashes outside of the driveway buffers. The driveway research made it very apparent that accurate crash geocoding was necessary to provide valid statistical results.
Case Study: Analysis of Driveway Related Crash Data Within 150 feet of intersections
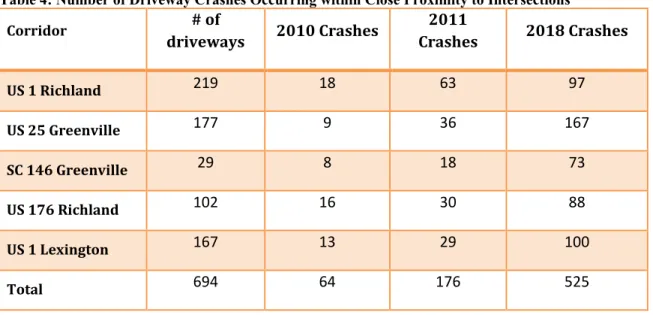
A similar illustration of how accurately coded crash data can benefit crash spatial analysis is a case study for identifying problem driveways within 150 feet of intersections in which the corner clearance of the driveway does not comply with published standards in the SCDOT Access Management Guidelines (4). A travelway polygon layer delineating edge of pavements for 5 major corridors were used for this study. Travelway polygons were overlayed with 50 foot buffer polygons of a selection set of driveways that fell within 150 feet of intersections. The resulting polygon layers were then overlayed with the driveway crash layer to determine the number of driveway related crashes within the hatched area shown in Figure 6. This analysis used only highway patrol data to ensure the before data (2010 driveway related crashes) was using predominantly GPS coordinates and the after data (2018 driveway related crashes) used SCCATTS. The number of crashes that fell within the driveway buffer and within the street travelway buffer for the 5 corridors totaled 64 crashes in 2010, and 525 crashes in 2018 (see Table 4). This represents a 700% increase in the quantity of driveway crashes that occurred in the travelway in close proximity to intersections. While some of this increase may be due to changes in landuse over this period the dramatic increase is undoubtedly due, in large part, to improved crash geocoding rather than a change in actual crash incidence. A closer look at these locations show that many of the 2010 crashes occur outside of the travelway and thus are ignored by the GIS operation.
30
While, the analysis shows how a GIS combined with precisely located crash data can be used to quickly identify potentially dangerous driveways with inadequate corner clearance, the omission of crashes due to poor geocoding will result in bias.
Table 4: Number of Driveway Crashes Occurring within Close Proximity to Intersections
Corridor # of
driveways 2010 Crashes Crashes2011 2018 Crashes
US 1 Richland 219 18 63 97 US 25 Greenville 177 9 36 167 SC 146 Greenville 29 8 18 73 US 176 Richland 102 16 30 88 US 1 Lexington 167 13 29 100 Total 694 64 176 525
Figure 6: Driveway related crashes on US Highway 176 in Richland County, South Carolina. (image from Bing Maps)
Case Study: Statewide Screening of Mid-block Crash Locations Using Short Segments
The AASHTO Highway Safety Manual (HSM) (18) presents a variety of methods for quantitatively estimating crash frequency or severity at a variety of locations. The HSM recommends a minimum segment length of 0.1 miles for developing predictive models. The research discussed in this case study focuses on segment lengths of less than 0.1 miles for statewide screening of midblock crashes to identify site specific locations with high crash incidence. Famili et al (17) makes an argument that many midblock crashes can be concentrated along a very short segment due to undesirable characteristics of a specific
32
site. The use of longer segments may “hide” the severity of a single location, if the remaining portion of the segment has few, or no, additional crashes. In this case study, South Carolina’s statewide road network is divided into short segments buffers, 50 to 100 feet in length. Intersection crashes were excluded from the analysis through the use of intersection buffers. Midblock crash data were aggregated along pre-designated short roadway network segments using the spatial overlay (spatial join) operation in ArcGIS (17). Figure 5 shows critical 50-foot segments identified along a section of Broad River Road in Columbia, South Carolina, with yellow and red polygon segments representing an occurrence of 4 or more cashes recorded during 2012. The red polygon segment has 7 or more crashes. The 4-crash threshold was chosen based on discussions with SCDOT. 2010 crashes are mostly located on the sides of the roadway, or in parking lots and were not captured by the short segments. Figure 6 shows a location associated with a dangerous horizontal curve where a 50-foot segment has 6 crashes in one year. One critical finding from the research described in this case study is short segment roadway network screening is viable as a safety analysis approach, only if accurately geocoded crash data is available
for use as the basis for this methodology (17). a
---Figure 7: A length of Broad River Road in Columbia, SC showing 50 ft road segments with 4 or more crashes in 2012 . (image from Google Earth)
34
Figure 8: Dangerous horizontal curve on Reid School Rd, Taylor, SC . (image from Google Earth) CONCLUSION
South Carolina has taken considerable strides towards improving crash data quality with the implementation of SCCATTS. Accurate crash data is an essential requirement for performing robust safety analysis and developing data-driven programs and policies. GIS spatial analyses methods and case study applications described in this paper would produce misleading and biased results if geocoded crash data used in the procedures contained systematic locational inaccuracies. Safety analysis along five major corridors using crash data geocoded with handheld GPS (2010 data) revealed that only 35% of the crash locations (not including run-off-the-road and fixed object crashes) were geocoded within the travelway, while SCCATTS geocoded crash data indicated that the proportion of
crashes occurring within the travelway was virtually 100% for the same corridors. In the case study analysis estimating driveway CMF, findings revealed dramatically different values before and after the implementation of SCCATTS, which upon adopting and using 2012 produced an average crash incidence of 0.46 crashes per driveway. For the case study of driveways within an 150-foot proximity to intersections, procedures to analyze geocoded data failed to identify a substantial number of driveway crash clusters using 2010 crash data, whereas analysis of 2018 data readily revealed identifiable patterns and driveway crash concerns for similar locations. In the case study of short roadway segments, systematic statewide screening of midblock crash locations provided an effective approach for identifying problematic locations experiencing 4 crashes on more in a 50-foot segment for further evaluation. Furthermore, use of this method as a viable safety analysis approach for effective network screening is largely dependent on availability of accurately geocoded systemwide crash data (17).
Availability of accurately geocoded systemwide crash data is emerging as one of the most consequentially important transformational and essential elements for advancing roadway safety analysis of crash data in the future. The case studies presented in this paper are unique in their methods to aggregate crashes to driveways and short roadway segments. These approaches are largely reliant upon availability of accurately geocoded statewide crash data. An important caveat should be noted for the short segment analysis in that the HSM does not recommend use of segments less than 0.1 miles, however, the case study approach demonstrated use of segment lengths less than 0.1 miles (50-feet) as a viable
36
means for effectively screening network midblock crashes, given accurately geocoded crashes. Specific benefits of enhanced systemwide crash geocoding include:
• Supports enhanced midblock crash cluster analysis and network screening; • Provides an ability to associate midblock crashes with systemwide planimetric
roadway features such as driveways, dangerous curves or roadside features; • Allows efficient network-based analysis for specific types of midblock crashes
and associated causation factors that would have previously required painstaking review of individual crash report illustrations;
• Promotes systematic network-based safety countermeasure analysis to pinpoint factors and locations where countermeasures can provide the greatest benefit.
Results from the survey of state highway agencies (n=24) indicates disparate crash reporting systems are used across the country with regard to crash geocoding data and procedures. All of the states responding to the survey have implemented electronic crash reporting to some extent; however, geocoding methods and accuracy varies from state to state, and also varies across jurisdictions within many states. Best practices for crash geocoding centers on providing reporting officers with an aerial image background and integrated GPS. The system should be deployed statewide and extend across all law enforcement jurisdictions. A few states responding to the survey indicated use of integrated GPS without a reference map, however, a major concern with this configuration is that patrol vehicles record their own location via GPS coordinates and fail to accurately geocode the crash location, which is a critical aspect for all GIS analysis methods.
While deployment of SCCATTS has led to substantial improvement in crash geocoding, there is potential for additional improvement. Based on assessment of SCCATTS crash accuracy and results from the survey of states, South Carolina SCCATTS system could be further improved by making an aerial background image available to reporting officers in the field. An aerial image background is an improvement over a centerline only background because the officers can use visible landmarks and lane geometry to more precisely locate crashes. For centerline only backgrounds, positional errors in the centerline will result in positional errors in crash locations and lead to limitations for use of the data in safety analysis.
Any safety analysis can only be as good as the data being used in the procedures. The ability to collect spatially accurate crash data constitutes an essential element in enhancing a state transportation agency’s ability to conduct reliable safety analysis, as well as foster other transportation related research, resulting in more effective safety programs and policies for the traveling public.
REFERENCES
1. Fatality Analysis Reporting System (FARS) - National Highway Traffic Safety Administration (NHSTA). Traffic Safety Facts South Carolina, 2013-2017. https://cdan.nhtsa.gov/SASStoredProcess/guest , Accessed July 9, 2019.
38
2. South Carolina Department of Public Safety (SCDPS). South Carolina Traffic Collision Fact Book 2013-17. http://www.scdps.gov/ohsjp/stat_services.asp , Accessed March 10, 2017.
3. South Carolina Department of Transportation (SCDOT). “Target Zero South Carolina’s Strategic Highway Safety Plan, South Carolina, 2015.
4. South Carolina Department of Transportation (SCDOT). A Strategic Highway Safety Plan: The Road Map to Safety. South Carolina Department of Transportation
(SCDOT), South Carolina, 2007.
5. Scopatz, R. A., & Brown, R. South Carolina Safety Data Improvements through
Electronic Crash System Deployment: Roadway Safety Data and Analysis Case Study, 2018 (No. FHWA-SA-16-109).
6. Abdel-Aty, M., Wang, X. “Crash estimation at signalized intersections along
corridors: analyzing spatial effect and identifying significant factors”, Transportation Research Record, 1953 (2006), pp. 98–111
7. El-Basyouny, K., Sayed, T. “Urban arterial accident prediction models with spatial effects”, Transportation Research Record, 2102 (2009), pp. 27–33
8. Kim, K.E., Yamashita, E.Y. “Using K-means clustering algorithm to examine patterns of pedestrian involved crashes in Honolulu, Hawaii” Journal of Advanced Transportation, 41 (1) (2007), pp. 681–689
9. Siddiquia, C., Abdel-Aty, M., Choi, K. “Macroscopic spatial analysis of pedestrian and bicycle crashes Accident Analysis and Prevention”, 45 (2012), pp. 382–391
10. Smith, R., Graettinger, A. J., Keith, K., Hudnall, M., and Parrish, A. “Using GIS for Law Enforcement”. Journal of Safety Research, Vol. 36, No. 5, 2005, pp. 477-479.
11. Cherry, E., R. Floyd, T. Graves, S. Martin, and D. Ward. “Crash Data Collection and Analysis System”. 537, Arizona Department of Transportation, 2006.
12. National Cooperative Highway Research Program. NCHRP Synthesis 367 -Technologies for Improving Safety Data. NCHRP Synthesis 367, Transportation Research Board, Washington, D.C., 2007.
13. Federal Highway Administration (FHWA) Office of Safety. Roadway Safety Professional Capacity Building (RSPCB) - Peer-to-Peer Program. FHWA, 2011.
14. Sarasua, W., J. Ogle, and K. Geoghegan. “Use of Global Positioning System to Identify Crash Locations in South Carolina”. Transportation Research Record:
40
Journal of the Transportation Research Board, Vol. 2064, No. -1, 2008, pp. 43-50.
15. Stantec, and CDM Smith. South Carolina Multimodal Transportation Plan: Safety and Security. South Carolina Department of Transportation, 2013.
16. Stokes, A., Sarasua, W. A., Huynh, N., Brown, K., Ogle, J. H., Mammadrahimli, A., ... & Chowdhury, M. (2016). Safety Analysis of Driveway Characteristics Along Major Urban Arterial Corridors in South Carolina (No. 16-6766).
17.Famili, A., Sarasua, W., Iqbal, A. M., Kumar, D., & Ogle, J. H. (2019). Short
Segment Statewide Screening of Midblock Crashes in South Carolina. Transportation Research Record. https://doi.org/10.1177/0361198119851068
18. AASHTO, 2010. Highway safety manual, 1st Edition. American Association of State Highway and Transportation Officials, Washington, D.C.
19. Lord, D. and Bonneson, J.A. Development of accident modification factors for rural frontage road segments in Texas. Transportation Research Record 2023,
Transportation Research Board of the National Academies, Washington, DC (2007); pp. 20–27.
CHAPTER THREE
Paper II: Short Segment Statewide Screening of Midblock Crashes in South Carolina
Co-authors of the paper: Afshin Famili, Wayne A. Sarasua, Devesh Kumar, Jennifer H. Ogle.
Paper II was published at the 2018 Annual Meeting of the Transportation Research Board.
ABSTRACT
The AASHTO Highway Safety Manual (HSM) presents a variety of methods for quantitatively estimating crash frequency or severity at a variety of locations. The HSM predictive methods require the roadway network to be divided into homogeneous segments and intersections, or sites populated with a series of attributes. It recommends a minimum segment length of 0.1 miles. This research focuses on segment lengths of less than 0.1 miles for statewide screening of midblock crash locations to identify site specific locations with high crash incidence. The paper makes an argument that many midblock crashes can be concentrated along a very short segment due to an undesirable characteristic of a specific site. The use of longer segments may “hide” the severity of a single location if the rest of the segment has few or no additional crashes. In actuality, this research does not divide sections of roads into short segments. Instead, a short window approach is used. The underlying road network is used to create a layer of segment polygons using GIS buffering.
42
Crash data are then overlaid and aggregated to the segment polygons for further analysis. The paper makes a case for the use of short fixed segments to do statewide screening and how accurately geocoded crash data is key to its use. A comparison is made with a sliding window approach (Network Kernel Density). The benefits of using fixed segments is that they are much less complex then using the sliding window approach. Because the segmentation can be the same from year to year, direct comparisons can be made over time while spatial integrity is maintained.
INTRODUCTION
In Part B of the AASHTO Highway Safety Manual (HSM), a variety of network screening methods are presented for identifying and prioritizing sites with potential for safety improvement. These range from simplistic approaches such as calculating crash rates or severity indices to determining the excess predicted average crash frequency using safety performance functions (SPFs). The latter is the approach taken by SafetyAnalyst – an AASHTOWare software tool developed to support the safety management process at a state agency. Using this method, a site’s observed average crash frequency is compared to a predicted average crash frequency found using an SPF. If the difference between the observed and predicted is greater than zero, the site experiences more crashes than predicted and might be considered as a candidate for further study. two represents the excess predicted crash frequency.