University of Kentucky
UKnowledge
Institute of Biomedical Informatics Faculty
Publications
Institute of Biomedical Informatics
2-17-2017
HyCLASSS: A Hybrid Classifier for Automatic
Sleep Stage Scoring
Xiaojin Li
University of Kentucky, [email protected]
Licong Cui
University of Kentucky, [email protected]
Shiqiang Tao
University of Kentucky, [email protected]
Jing Chen
Lanzhou University, China
Xiang Zhang
Pennsylvania State University
See next page for additional authors
Right click to open a feedback form in a new tab to let us know how this document benefits you.
Follow this and additional works at:
https://uknowledge.uky.edu/bmi_facpub
Part of the
Bioinformatics Commons
This Article is brought to you for free and open access by the Institute of Biomedical Informatics at UKnowledge. It has been accepted for inclusion in Institute of Biomedical Informatics Faculty Publications by an authorized administrator of UKnowledge. For more information, please contact
Repository Citation
Li, Xiaojin; Cui, Licong; Tao, Shiqiang; Chen, Jing; Zhang, Xiang; and Zhang, Guo-Qiang, "HyCLASSS: A Hybrid Classifier for Automatic Sleep Stage Scoring" (2017).Institute of Biomedical Informatics Faculty Publications. 6.
Xiaojin Li, Licong Cui, Shiqiang Tao, Jing Chen, Xiang Zhang, and Guo-Qiang Zhang
HyCLASSS: A Hybrid Classifier for Automatic Sleep Stage Scoring Notes/Citation Information
Published in
IEEE Journal of Biomedical and Health Informatics
, v. 22, no. 2, p. 375-385.
© 2017 IEEE
The copyright holder has granted the permission for posting the article here.
Digital Object Identifier (DOI)
https://doi.org/10.1109/JBHI.2017.2668993
IEEE JOURNAL OF BIOMEDICAL AND HEALTH INFORMATICS, VOL. 22, NO. 2, MARCH 2018 375
HyCLASSS: A Hybrid Classifier for Automatic
Sleep Stage Scoring
Xiaojin Li
, Licong Cui, Shiqiang Tao, Jing Chen, Xiang Zhang, and Guo-Qiang Zhang
Abstract—Automatic identification of sleep stage is an important step in a sleep study. In this paper, we propose a hybrid automatic sleep stage scoring approach, named Hy-CLASSS, based on single channel electroencephalogram (EEG). HyCLASSS, for the first time, leverages both signal and stage transition features of human sleep for automatic identification of sleep stages. HyCLASSS consists of two parts: A random forest classifier and correction rules. Ran-dom forest classifier is trained using 30 EEG signal features, including temporal, frequency, and nonlinear features. The correction rules are constructed based on stage transition feature, importing the continuity property of sleep, and char-acteristic of sleep stage transition. Compared with the gold standard of manual scoring using Rechtschaffen and Kales criterion, the overall accuracy and kappa coefficient applied on 198 subjects has reached 85.95% and 0.8046 in our ex-periment, respectively. The performance of HyCLASS com-pared favorably to previous work, and it could be integrated with sleep evaluation or sleep diagnosis system in the future.
Index Terms—Automatic sleep stage scoring, EEG, hy-brid classifier, PSG, sleep stage transition.
I. INTRODUCTION
S
LEEP is one of the most important circadian rhythms of human physiological activities [1]. It has a sequence of sleep stages related to autonomous nervous system functions [2]. The quality and quantity of sleep impacts the performance of many basic activities, such as learning, memorization, andManuscript received July 8, 2016; revised December 10, 2016 and January 31, 2017; accepted February 6, 2017. Date of publication Febru-ary 17, 2017; date of current version March 5, 2018. This work was supported in part by the University of Kentucky, in part by the Center for Clinical and Translational Science Award UL1TR001998, in part by the National Sleep Research Resource under Grant NHLBI R24 HL114473, and in part by the National Science Foundation under Grant 1626364.
(Corresponding author: Guo-Qiang Zhang.)
X. Li is with the Department of Electrical Engineering and Computer Science, Case Western Reserve University, Cleveland, OH 44106-7078 USA, and also with the Institute for Biomedical Informatics, University of Kentucky, Lexington, KY 40506 USA (e-mail: [email protected]).
L. Cui is with the Department of Computer Science, University of Kentucky, Lexington, KY 40506 USA (e-mail: [email protected]).
S. Tao and G.-Q. Zhang are with the Institute for Biomedical In-formatics, University of Kentucky, Lexington, KY 40506 USA (e-mail: [email protected]; [email protected]).
J. Chen is with the School of Information Science and Engineering, Lanzhou University, Lanzhou 730000, China (e-mail: chen.j15@uky. edu).
X. Zhang is with the College of Information Sciences and Technology, Pennsylvania State University, University Park, PA 16801 USA (e-mail: [email protected]).
Digital Object Identifier 10.1109/JBHI.2017.2668993
concentration [3]. Better understanding of some sleep disorders, such as insomnia and sleep apnea, relies on accurate detection of sleep stages and the sleep cycle. In sleep studies for clinical diagnosis and treatment of sleep disturbances, the first step is identification of an individual’s sleep stages [4].
Traditionally, domain experts visually analyze and manu-ally score the recorded over-night polysomnography (PSG) sig-nals, such as electroencephalogram (EEG), electrocardiogram (ECG), electromyography (EMG), electrooculogram (EOG), pulse oximetry, and respiration. Normal practice divides the entire sleep record into 30-second epochs and each epoch is assigned a certain sleep stage according to some standard cri-terions, such as Rechtschaffen and Kales (R&K) rules [5]. Such manual scoring method remains the standard practice [6]. Based on R&K rules, sleep stages can be categorized by wakefulness (Wake), rapid eye movement (REM), and non-rapid eye movement (NREM). NREM can be categorized into stages 1, 2, 3 and 4. Stages 3 and 4 are often com-bined together and referred to deep sleep, or slow wave sleep (SWS) [7].
However, manual stage scoring on PSG by domain experts is time-consuming and labor-intensive. Each hour of sleep re-quires the scoring of 120 epochs. The National Sleep Research Resource (NSRR) [8], [9], which is a large-scale integrated sleep data repository, consists of a collection of sleep research data across the United States, with thousands of hours of sleep-related data. Thus, developing a simple and reliable automatic sleep stage scoring system can reduce significant manual work in sleep studies. Several automatic sleep stage scoring approaches have been proposed, including
1) time domain analysis [10], [11];
2) frequency domain analysis [4], [7], [12]–[14];
3) time-frequency analysis including wavelet transform [15]–[18];
4) EEG non-linear analysis [7], [19], [20]; 5) decision tree (DT) [14], [21];
6) artificial neural network (ANN) [12], [18]; 7) fuzzy clustering [4];
8) k-nearest neighbor (KNN) [16], [22]; 9) support vector machine (SVM) [7]; 10) random forest [15];
11) hidden markov model (HMM) [23]–[25]; 12) deep belief network (DBN) [13].
These methods reported accuracies ranging from 67% to 86%, compared with experts’ score. However, most of the existing work involved a small number of sleep records in dataset (less 2168-2194 © 2017 IEEE. Translations and content mining are permitted for academic research only. Personal use is also permitted, but republication/redistribution
than 30 subjects), which may cause bias and low generaliz-ability. Moreover, the existing work only focused on analyzing signal features without considering the dynamic stage transition information. J¨a¨askinen et al. [6] performed a study on the dis-tribution of transitions from one stage to another using Markov model, and they discovered a distribution difference between normal and recovery sleep. Additionally, stage dynamic transi-tion informatransi-tion reveals significant characteristics of the degree of sleep continuity [26] and potentially provides valuable in-sights for better understanding of the mechanisms of sleep stage interactions [27]. The goal of this paper is to formulate and test this main hypothesis at a large scale: the properties of dynamic stage transition could improve the performance of sleep stage scoring.
We propose a hybrid classifier HyCLASSS, for the first time, leverages both signal and stage transition features of human sleep for automatic identification of sleep stages. HyCLASSS consists of two parts: random forest classifier and correction rules. We first train a random forest classifier using three types of features from EEG signal: time-domain features, frequency-domain features, and non-linear features. We then construct and apply the correction rules based on a proposed stage transition graph representing the dynamic characteristic of sleep stage transition. Combining both signal and stage transition features, HyCLASSS can overcome the limitations of the previous meth-ods and improve the performance. In this study, we divided sleep stages into five categories: wakefulness (Wake), rapid eye movement (REM), sleep stage 1 (S1), sleep stage 2 (S2), and slow wave sleep (SWS). The overall accuracy, kappa coeffi-cient [28], [29], precision, recall and F1-score [30], [31] are calculated to demonstrate the performance of HyCLASSS. The overall accuracy and kappa coefficient of our approach applied to 198 subjects (from two existing cohort studies) are 85.95% and 0.8046, respectively, which compared favorable with pervi-ous studies.
The rest of this paper is organized as follows. Section II describes the background of automatic sleep stage scoring. Section III describes the materials and methods. Section IV discusses the results. Section V provides a brief comparison with other related work and discusses future work.
II. BACKGROUND
Different types of approach exist for time series classifica-tion, such as raw data-based, model-based, and feature-based [32]. For automatic sleep stage scoring, feature-based method has been the most popular, involving two major steps: feature extraction and classifier construction [33].
A. Feature Extraction From EEG Signal
For EEG signal feature extraction, most of the reported fea-tures in previous studies are considered in this study. These features can be grouped into three categories: 1) time-domain features, 2) frequency-domain features, and 3) non-linear features.
1) Time-Domain Features: Time-domain features include
statistical measures and Hjorth parameters [34]. Statistical
measures include mean, kurtosis, and skewness evaluating sta-tistical characteristics [35]. The mean statistic measures the central tendency of a probability distribution. Kurtosis feature measures the tailedness of a probability distribution and de-scribes the shape of a probability distribution. Skewness mea-sures the asymmetry of a probability distribution. Hjorth pa-rameters are generally used in feature extraction for EEG signal analysis [36] including activity, mobility, and complexity [37]. The activity measures the variance of a time function. The mo-bility infers to the mean frequency or the proportion of standard deviation of the power spectrum. The complexity measures the change in frequency.
2) Frequency-Domain Features: EEG signals of each sleep
stage have various behaviors in different frequency bands, and the characteristics of different sleep stages in different frequency bands are reported in many previous work (see [33] for a sur-vey). Previous studies demonstrated that spectral power is an important feature for automatic sleep stage scoring [15]. For in-stance, the power of lower frequencies of EEG becomes stronger with the increasing depth of sleep [38], the EEG signal of stage 1 has higher amplitude between 2-7 Hz. Stage 2 can be char-acterized by the presence of sleep spindles band (12-14 Hz). SWS is scored when there is low frequency (less than 2 Hz) waves.
Additionally, the average signal amplitudes in specific fre-quency bands by applying band pass filter, for instance, the 0.5-1.0 Hz band, was recorded as a feature.
3) Non-Linear Features: All the features mentioned above
are linear features. Non-linear and dynamical properties are also important in representing the behaviors of EEG signal [19], such as Shannon entropy and sample entropy. Various researchers in the past [20], [39], [40] demonstrated their relevance for sleep stage scoring and EEG characterization.
B. Random Forest Classifier
Random forest classifier is an ensemble learning method for classification by constructing a group of decision trees. Its output is the mode of the classes of the individual trees, and it has been proposed for automatic sleep stage scoring [15]. The overall output is determined by applying the object to each tree and selecting the classification with the most weighted votes. The weight of each tree is adjusted using misclassification and out-of-bag measures.
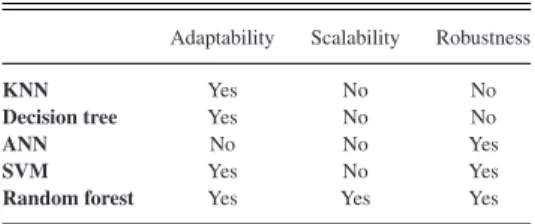
A random forest classifier has three main properties [41]: adaptability, scalability, and robustness. Other classifiers typi-cally do not have all the three properties (seeTable I).
Adaptability: A random forest classifier estimates the
impor-tance of variables and provides a way for tuning with additional training data by assigning different weights for each decision tree. In comparison, ANN is not as adaptable, since its param-eters are sensitive to the data, and it is difficult for ANN to be tuned to new datasets for constructing a well-learned neural network [42].
Scalability: A random forest classifier can handle thousands
of input variables and work efficiently on large datasets. In contrast, SVM has poor performance on large datasets since the
LI et al.: HYCLASSS: A HYBRID CLASSIfiER FOR AUTOMATIC SLEEP STAGE SCORING 377
TABLE I
PROPERTIES OFCLASSIFIERS
Adaptability Scalability Robustness
KNN Yes No No
Decision tree Yes No No
ANN No No Yes
SVM Yes No Yes
Random forest Yes Yes Yes
speed of convergence can be low [43]. Similarly, KNN and ANN have limited scalability and are not suitable for large datasets due to work involved in training and testing. Although training and testing for a single decision tree can be efficient, it comes with the drawback of overfitting.
Robustness: A random forest classifier can balance error in
datasets with unbalanced class population. A single decision tree classifier is sensitive to noise and outliers in the data as a slight change in training data can result in a different tree. Therefore, single decision tree’s performance with unbalanced training data is not optimal [44]. KNN also cannot handle unbalanced training dataset well since the classification result depends on the number and the class label of nearest neighbors. KNN typically cannot perform optimally for groups with less training data.
C. Sleep Stage Transition
Dynamic sleep stage transition describes the relationship be-tween one sleep stage and another. Most existing sleep stage classification studies only used polysomnography signals, such as EEG and EMG, for feature extraction and ignored the sleep stage transition features. In [26], the study proved that sleep stage transition, beyond conventional PSG measures of sleep, could be used to characterize sleep disruption. It also indicated that sleep stage transition rates provided additional valuable information of sleep continuity, and it was useful in predicting specific outcomes. Stage transition provides addi-tional useful information for classification and prediction; how-ever, one of the challenges is that it is difficult to learn from dataset.
In [14], the authors applied a smoothing process on clas-sified results to improve their classifier’s performance, which considers the continuity of a subject’s sleep. However, the smoothing process only consisted of several rules manu-ally extracted from dataset. In this paper, HyCLASSS solves this problem through extracting sleep stage transition fea-tures from sleep stage sequences automatically with a Markov model.
III. MATERIALS ANDMETHODS
HyCLASSS consists of several steps, and its workflow is shown inFig. 1. Pre-processing the EEG signal starts the pro-cess (Step 1), followed by feature extraction (Step 2). After feature extraction, a hybrid classifier is trained and tested us-ing extracted features (Step 3-4). All the steps are implemented using Matlab (Mathworks, Inc.-USA).
Fig. 1. HyCLASSS workflow.
A. Subjects
This study uses a dataset consists of subjects: 1) 116 sub-jects (57 males and 59 females) selected from the Cleveland Children’s Sleep and Health Study (CCSHS) [45], which was focused on teenagers with an age range of 16-19 years old, and 2) 82 subjects (35 males and 47 females) selected from the Cleveland Family Study (CFS) [46], which was focused on sub-jects with an age range of 6-88 years old. Actually, 84 subsub-jects were selected from CFS (totally 200 subjects); however, two of them were removed since they have data quality issues due to unlabeled parts of their signal. Both datasets are available at National Sleep Research Resource.
The signal recordings were done for an entire night of sleep (8-12 h). The EEG channel was recorded from the C4-A2 channel sampled at 128 Hz. The sleep stages were manually scored in epochs of 30s according to the Rechtschaffen and Kales (R&K) standard. The sleep stages are divided into five categories: Wake, REM, S1, S2, and SWS.
B. Pre-Processing
Muscle artifact, eye movements and eye blinking are the com-mon physiological artifacts present in the EEG recordings, and these artifacts make interpretations of the EEG signal difficult [7]. In order to minimize residual artifacts presence, the signals are filtered with a band pass filter with cutoff frequencies at 0.2 Hz and at 35 Hz.
C. Feature Extraction
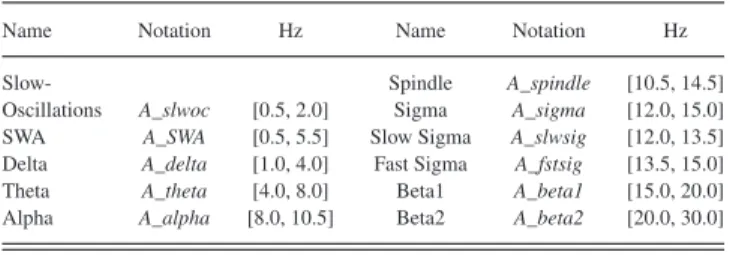
We extracted 33 features including time-domain, frequency-domain and non-linear features: 1) six time-frequency-domain features (mean, kurtosis, skewness, activity, mobility, and complex-ity), 2) spectral power and spectral amplitude of 11 frequency bands (total 22 features), and 3) five non-linear features. Then we removed three features: mean, mobility and complexity, since they had similar values for each stage and were not useful for classification; finally, 30 features were used in HyCLASSS.
The spectral power in several significant frequency bands is calculated by fast Fourier transforms (FFT) for each epoch, and the total spectral power for each band is used as a fre-quency feature. All frefre-quency bands with their extraction details are described inTable II. To represent non-linear characteris-tics of EEG, five non-linear dynamics features are extracted, namely, C0 Complexity [47], [48], Shannon Entropy [49], [50], the largest Lyapunov exponent [51], Spectral Entropy [52], [53], and Kolmogorov Entropy [54].
TABLE II
EXTRACTEDEEG FREQUENCYBANDS
Name Notation Hz Name Notation Hz
Slow- Spindle A_spindle [10.5, 14.5]
Oscillations A_slwoc [0.5, 2.0] Sigma A_sigma [12.0, 15.0] SWA A_SWA [0.5, 5.5] Slow Sigma A_slwsig [12.0, 13.5] Delta A_delta [1.0, 4.0] Fast Sigma A_fstsig [13.5, 15.0] Theta A_theta [4.0, 8.0] Beta1 A_beta1 [15.0, 20.0] Alpha A_alpha [8.0, 10.5] Beta2 A_beta2 [20.0, 30.0]
Fig. 2. An illustrative example of N-bin procedure (N=5).
After feature extraction, unit norm is applied to normalize features to 0-1 ranges to reduce the effects of individual vari-ability. Additionally, for a subject, each feature vector of all epochs is ranked by N-bin approach to reduce the complexity and running time of building trees in random forest. The proce-dure for N-bin approach is summarized in the following steps: 1) record the index of original feature vector, and then sort the fea-ture vector, 2) divide the feafea-ture vector into N bins of the same size, 3) the elements in the same bin have the same rank level, 4) using recorded index to obtain the final ranked feature.Fig. 2 shows an example of this procedure of 5-bin. The selection of N is described in Section IV-B.
D. Random Forest
As mentioned in Section II-B, a random forest classifier has many advantages, such as adaptable, scalability and robustness. We experimented with several machine learning classification, including KNN, C4.5 decision tree and random forest, found the random forest technique provided the best performance, therefore, we chose it for HyCLASSS.
We used four processes to build the random forest [41]. First, build each decision tree using method, such as classification and regression tree, random trees, and C4.5.
Second, in the construction of each decision tree, nodes and leaves are built by selecting a random number of features. This process will minimize the correlation among the features and decrease the sensitivity to noise; in this way, the accuracy of classification will be increased [15].
Third, apply the technique of bootstrap (sampling with re-placement) to sample the sub-training set for each tree from the whole training data set. In other words, each tree is con-structed using bootstrap sample technique, and the variance of the model can be reduced without increasing the bias. It is easy to obtain strongly correlated trees by training all trees with the same training set, and bootstrap sampling is a good way to de-correlate the trees. For a single decision tree, its prediction results may be highly sensitive to the noise in its particular train-ing set; however, in random forest, the average of all trees is less sensitive to noise since the trees are more de-correlated. Addi-tionally, during the training process of each tree, about two-third of the sub-training set is used in the construction of the tree; the remaining one-third part is used to test the classification per-formance of the tree, and this is called “the out-of-bag error estimate.” Therefore, it gets an unbiased estimate of the test set error internally in random forest, and there is no need to use further cross-validation [41].
Fourth, predict the classification for a new object O by weight-ing the predictions from all the individual trees on O.
In this study, we used a random forest with 400 trees in our classifier. Parameter selection is discussed in Section IV-B, which shows that classification results varied little with respect to parameters.
E. Construction of Correction Rules
As mentioned in Section II-C, sleep stage transition can pro-vide additional information for classification. Intuitively, chang-ing of sleep stages durchang-ing night sleep should not be random, and some transitions may not happen. For example, [REM, SWS, S2] rarely occurs in sleep stage transition. To verify this intu-ition, we designed a simple experiment to compare the sleep stage sequence with a random sequence using Kolmogorov complexity [55]–[57], which is a popular measurement to eval-uate the randomness of sequence. The results indicate that the stage sequence of whole night sleep is not a random sequence. Section V describes the details.
[14] applied a smoothing process on classified results to im-prove their classifier’s performance. It considered the temporal contextual information and improved the continuity of a sub-ject’s sleep stage scoring results. Some correction rules were constructed according to the relationship among current epoch, prior-epoch and posterior-epoch [14]. For example, three con-secutive epochs of [S1, REM, S2] were replaced with the se-quence [S1, S1, S2]. Similarly, consecutive epochs of [S1, S2, S1] were replaced with the sequence [S1, S1, S1] [14], [58]. However, their correction rules only contain a few manually defined rules and need more prior knowledge of the sleep study and characteristics of the sleep dataset.
This begs the question: can we automatically build the general correction rules based on the data itself with less prior knowl-edge? Therefore, we provide a novel method to automatically construct correction rules that only depend on the dataset using a Markov model. Then, apply those rules on the output of the random forest classifier. The Markov model was used to find out the transition distribution from one stage to another [6] and
LI et al.: HYCLASSS: A HYBRID CLASSIfiER FOR AUTOMATIC SLEEP STAGE SCORING 379
Algorithm 1: Automatic Correction Rules Construction. ProcedureCorrRes=AutoCorrRuleConstru(T, P,
P reP redict)
Input T: Transition Probability Matrix
P: Highest Probability Path
P reP redict: Pre-predicted sleep stage sequence of a subject
OutputCorrRes: Corrected predicted sleep stage sequence
1: Len=length(CorrRes); 2: whilei←1 toLen−2do
3: P reP redSubSeq3 ←CorrRes(i:i+ 2); 4: ifi+ 4<=Lenthen
5: P reP redSubSeq5 ←CorrRes(i:i+ 4); 6: ifP reP redSubSeq5satisfy the input format of
Stable Rule then
7: CorrRes(i:i+ 4)←SmoothRule (P reP redSubSeq5);
8: end if 9: end if
10: ifP reP redSubSeq3satisfy the input format of Stable Rule then
11: CorrRes(i:i+ 2)←SmoothRule (P reP redSubSeq3);
12: else ifP reP redSubSeq3satisfy the input format of Transition Probability Based Rule then 13: CorrRes(i:i+ 2)←TransProbRule
(P reP redSubSeq3); 14: end if
15: end while
provided a compact and interpretable representation of the sleep stages in a dynamic sleep process. The results are described in Section IV.
Our correction rules can be divided into two parts, namely,
Smoothing rule and Transition-probability-based rule. Each rule
represents different characteristics of sleep stage transition in whole night sleep. Smoothing rule shows the stable sleep du-ration and the property of sleep continuity; in other words, in a stable phase of sleep, it is unlikely that the stage suddenly changed. Transition-probability-based rule represents the most probable transition between different stages, which reflects the dynamic property of whole night sleep.
Algorithm 1 shows the pseudo-code of our automatic cor-rection rules construction algorithm, the T and P are com-puted by GetTransMatAndHighProbPath procedure (shown in Algorithm 2). The subsequences are extracted from pre-predicted stage sequence (i.e., the prediction from the random forest classifier) using a sliding window, where the window size is equal to three and five; i.e., each subsequence contains sleep stages for three and five consecutive epochs, such as [Wake, REM, S2] and [Wake, S3, S3, REM, S1]. In line 2-15, the correction rules are applied to extracted subsequences. All the correction rules are described as follows:
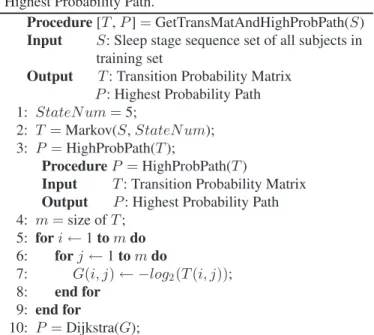
Algorithm 2: Calculating Transition Probability Matrix and Highest Probability Path.
Procedure [T,P]=GetTransMatAndHighProbPath(S) Input S: Sleep stage sequence set of all subjects in
training set
Output T: Transition Probability Matrix
P: Highest Probability Path 1: StateN um=5;
2: T=Markov(S,StateN um); 3: P=HighProbPath(T);
ProcedureP=HighProbPath(T)
Input T: Transition Probability Matrix Output P: Highest Probability Path 4: m=size ofT; 5: fori←1 tomdo 6: forj←1 tomdo 7: G(i, j)← −log2(T(i, j)); 8: end for 9: end for 10: P=Dijkstra(G);
1) Smoothing Rule (Line 7 and 11): Because sleep is a smooth,
stable and continuous process [26], it is reasonable to assume that the sleep stage should not change suddenly in 3-epoch sub-sequence since each epoch only includes 30s of EEG signal. This rule is used to correct the sudden stage change in pre-predicted result. For example, the subsequence [Wake, S3, Wake] is cor-rected to [Wake, Wake, Wake]. Additionally, according to our observation, this rule can also be extended to 4-epoch subse-quence and 5-epoch subsesubse-quence; for example, [Wake, S3, S3, Wake, Wake] is corrected to [Wake, Wake, Wake, Wake, Wake]. There is one notable thing that 4-epoch subsequence, such as [Wake, S3, Wake, Wake] or [Wake, Wake, S3, Wake], is already covered by 3-epoch subsequence. Therefore, the Smoothing rule and its input format is generally summarized as following: 1) [A, B, A] is corrected to [A, A, A], and 2) [A, B, B, A, A] is corrected to [A, A, A, A, A], where different symbols (like “A” or “B”) represent the different categories of sleep stage.
2) Transition-Probability-Based Rule (Line 13): It is
nec-essary to find a reasonable way to change improbable sub-sequences of pre-predicted sleep stages. For example, the pre-predicted stage subsequence is [Wake, REM, S2]; however, in real life, this sequence happens with quite low probability. In this way, we replace low probability transitions with high probability ones.
Algorithm 2 shows the pseudo-code of learning the stage tran-sition probability matrix and selecting the highest probability transition path between stages using the training set. The num-ber of states is set to be 5 (line 1). Then, in line 2, an asymmetric transition probability matrix T between sleep stages is computed using the Markov model. The element T(i, j) represents the tran-sition probability from stage i to stage j. In T, the self-trantran-sition probability is set to be a very small number (i.e., T(i, i)=) since the Smoothing rule solves the self-transition correction. Fig. 3shows the state-transition diagram of all five sleep stages.
Fig. 3. State-transition diagram of all sleep stages.
Based on the stage transition probability matrix, the highest probability path P among each stage is computed using
High-ProbPath procedure in line 3, which is shown at the bottom of
Algorithm 2. In HighProbPath procedure, the transition proba-bility matrix is transformed to a direct weighted graph G using logarithmic function (line 5-9); each node in G represents the sleep stage, and the edge between node i and node j means the cost of transition. It is easy to prove that the shortest path in G is equal to the highest transition probability path P in T. Therefore, in line 10, the Dijkstra algorithm [59] is applied to calculate the shortest path of graph G.
Suppose [A, B, C] represents a pre-predicted 3-epoch subse-quence as an input of Transition-probability-based rule, where A, B and C are sleep stages of epoch. The corrected sequence (CorrSeq) is generated using (1) shown at the bottom of this page, where Hpath(A,B) means the highest transition probabil-ity path between stage A and stage B, and prob([A,B]) means the transition probability of the path [A, B] according to the transition matrix. Three situations are defined:
1) if the highest transition probability path between stage A and stage C is [A, B, C], then no rules are applied;
2) if situation 1) is not satisfied and the highest transition probability path between stage A and stage B is [A, B], the find the stage X with highest transition probability from B to X, and the corrected sequence is [A, B, X];
3) if both situation 1) and 2) are not satisfied, two paths are computed: [A, B, X] and [A, X, C]; then choose the path with highest transition probability as the corrected sequence.
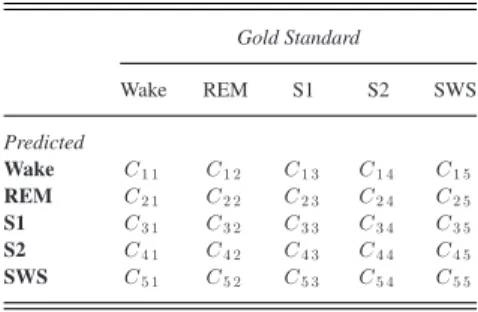
TABLE III CONFUSIONMATRIX Gold Standard Wake REM S1 S2 SWS Predicted Wake C1 1 C1 2 C1 3 C1 4 C1 5 REM C2 1 C2 2 C2 3 C2 4 C2 5 S1 C3 1 C3 2 C3 3 C3 4 C3 5 S2 C4 1 C4 2 C4 3 C4 4 C4 5 SWS C5 1 C5 2 C5 3 C5 4 C5 5
As mentioned before, the pre-predicted stage transition [Wake, REM, S2] is rare in night sleep;
Transition-probability-based rule generates the stage transition [Wake, S1, S2] with
high probability to correct the improbable pre-predicted result; it is more reasonable and consistence with reality [14].
F. Performance Evaluation
We evaluated the performance of the proposed approach using the recall R (also known as sensitivity), precision P (positive predictive value), F1-measure (F), and accuracy (AC) [30], [31]. For each stage category c, its precision (Pc), recall (Rc), and
F1-score (Fc) are defined as:
Pc= T Pc T Pc+F Pc , Rc= T Pc T Pc+F Nc , Fc= 2 Pc×Rc Pc+Rc (2) whereT Pcis the number of true positives,F Pcis the number
of false positives, andF Nc is the number of false negatives.
The accuracy (AC) is defined as:
AC=P redictResults∩GroundT ruth
length(GroundT ruth) (3)
Additionally, Cohen’s kappa coefficient [28], [29] is also an important measure to evaluate the performance of a classifier. It is a more robust measure compared with simple percent agree-ment calculation. Therefore, we also compute the Cohen’s kappa coefficient to evaluate the performance of our approach as de-scribed below.
The confusion matrix for classifying 5 sleep stages is shown inTable III, and each row of the matrix represents the instances in a predicted class while each column represents the instances in actual class. The elementCijmeans the number of
common instances between predicted class i and actual class j; for example,C12represents the number of instances predicted as Wake, but actually belongs to REM. The kappa coefficient is
CorrSeq= ⎧ ⎪ ⎪ ⎪ ⎪ ⎪ ⎨ ⎪ ⎪ ⎪ ⎪ ⎪ ⎩ [A, B, C] if hpath(A, C) = [A, B, C] [A, B, X]where max
X {sleep stag e}{prob([B, X])} elseif hpath(A, B) = [A, B]
max ⎧ ⎨ ⎩
prob([A, B]) + max
X {sleep stag e}{prob([B, X])}
max
X {sleep stag e}{prob([A, Z, X])}
⎫ ⎬
⎭, elseif hpath(A, B)= [A, B]
LI et al.: HYCLASSS: A HYBRID CLASSIfiER FOR AUTOMATIC SLEEP STAGE SCORING 381
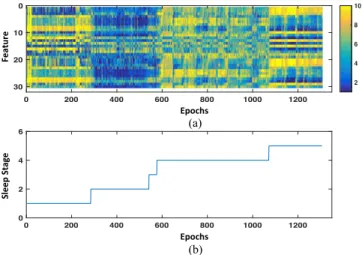
Fig. 4. Extracted features with corresponding sleep stages. (a) Thirty features of all epochs in a subject’s night sleep. The x-axis represents indices of epochs, and y-axis represents thirty features. Colors represent features’ value. (b) Corresponding sleep stages (1: Wake; 2: REM; 3: S1; 4: S2; 5: SWS).
TABLE IV-A
CONFUSIONMATRIX OFRANDOMFORESTCLASSIFIER
Wake REM S1 S2 SWS Wake 38505 2073 1257 2907 312 REM 1360 14587 1772 1977 1 S1 23 60 67 13 0 S2 1278 1654 779 41121 2701 SWS 54 12 2 2948 14583 defined as follows: Ka = Po−Pc 1−Pc , Po = 5 i=1Cii 5 i=1 5j=1Cij Pc = 5 i=1 5j=1Cij 5j=1Cj i 5 i=1 5j=1Cij 2 (4)
wherePois the proportion of the observed agreements, andPc
is the proportion of agreements expected by chance [15]. The interpretation of kappa coefficient has six levels of agreement: 1) poor (less than 0), 2) slight (0.00 to 0.20), 3) fair (0.21 to 0.40), 4) moderate (0.41 to 0.60), 5) substantial (0.61 to 0.80), and 6) excellent (>0.8) [14].
IV. EXPERIMENTS ANDRESULTS
A. Classification Results
We processed, filtered, and segmented the EEG signal into 30s epochs and extracted thirty-three features int time domain, fre-quency domain and non-linear fields. According to our analysis, the mean, mobility and complexity were not used for classifica-tion, since they had similar value for each stage.Fig. 4shows the extracted 30 features’ value with their corresponding sleep stage for one subject with 10-bins; different sleep stages have distinct feature patterns.
TABLE IV-B
PERFORMANCE OFRANDOMFORESTCLASSIFIER
Wake REM S1 S2 SWS Recall (%) 93.41 79.33 01.73 83.98 82.87 Precision (%) 85.46 74.05 41.10 86.51 82.86 F1-score (%) 89.26 76.60 03.31 85.22 82.86 Accuracy: 83.59% Kappa: 0.7715 TABLE V-A
CONFUSIONMATRIX OFHYCLASSS
Wake REM S1 S2 SWS Wake 38450 1226 1300 1875 153 REM 985 15751 1454 1627 0 S1 109 70 284 174 4 S2 1587 1337 839 42925 2901 SWS 89 2 0 2365 14539 TABLE V-B PERFORMANCE OFHYCLASSS Wake REM S1 S2 SWS Recall (%) 93.27 85.67 07.33 87.66 82.62 Precision (%) 89.41 79.48 44.31 86.56 85.55 F1-score (%) 91.30 82.46 12.57 87.11 84.60 Accuracy: 85.95% Kappa: 0.8046
We randomly assigned subjects in the CCSHS and CFS datasets to either a training set or a testing set. The resulting training set included 96 subjects; the testing set contained the remaining 102 subjects. We compared the output of the classi-fier with the gold standard to evaluate its performance. In the experiment, the number of N-bin and trees in random forest were set to 100 and 400, respectively; Section IV-B discusses the selection of these two parameters.
Table IV-A and IV-B show the evaluation results for random forest classifier without correction rules applied, including the confusion matrix, F1-score, recall and precision of each stage class, overall accuracy and kappa coefficient. The overall aver-age accuracy was 83.59% for each staver-age class of all subjects. Except for S1, the average recall was higher than 79%, the av-erage precision was higher than 74%, and the avav-erage F1-score was higher than 76%. It also indicated that the average kappa was in substantial agreement level (0.7715). In contrast, Ta-ble V-A and V-B show the evaluated results for random forest classifier with correction rules applied, i.e., the HyCLASSS. The overall accuracy increased to 85.95%; the average recall, average precision and average F1-score for each stage class im-proved significantly, especially for REM and S1. As mentioned before, the signal features of REM and S1 are similar; in addi-tion, the number of S1’s epochs was significantly smaller than other stages’ epochs in a subject’s night sleep. This makes it difficult to train a model with a high performance for S1 as S1 could be easily mistakenly classified as one of the other stages. After using correction rules, the F1-score results for REM and
Fig. 5. The sleep stage sequences of a subject in testing set: (a) the automatic scoring without correction rules, (b) the automatic scoring with HyCLASSS, and (c) gold standard. The x-axis represents the indices of epochs, and y-axis represents 5 sleep stages (1: Wake; 2: REM; 3: S1; 4: S2; 5: SWS).
S1 were both increased by 5.86% (from 76.60% to 82.46%) and 9.26% (from 3.31% to12.57%), respectively. Moreover, the average kappa was increased from 0.7715 to 0.8046, which was in excellent agreement level (>0.8).
Fig. 5shows the stage sequences of one subject (No. 15 in testing set) including the gold standard manually scored by the expert, the automatic stage scoring without correction rules ap-plied, and the automatic scoring with HyCLASSS. The resulting stage sequence scored with HyCLASSS was much closer to the gold standard after the rule correction.
B. Parameter Selection
Parameter selection is an important problem in classification as changing parameters may impact significantly the perfor-mance of the classifier. As mentioned before, there were two parameters in HyCLASSS: the number of N-bin for feature ranking and the number of trees in random forest. In order to verify the sensitivity, we tested the performance using various parameters ranges: 1) the number of trees was set to 400 and the number of N-bin ranged form 10 to 2000; 2) the number of N-bin was set to 100 and the number of trees ranged form 10 to 1000.Fig. 6shows the results of experiments. The average accuracy and kappa coefficient for different parameters only had slightly changes. It indicated that HyCLASSS is not sensitive to its parameters.
V. DISCUSSION
In this study, we proposed an automatic sleep stage classi-fication and prediction approach based on the hybrid classifier HyCLASSS. It combines a random forest classifier and correc-tion rules learned from Markov model. The main idea of Hy-CLASSS is to leverage both the advantages of signal features and the sleep stage dynamic transition feature.
Fig. 6. The average accuracy and kappa coefficient for different pa-rameters, (a) number of N-bin and (b) number of trees in random forest.
TABLE VI
THEAVERAGEKOLMOGOROVCOMPLEXITY OFSTAGESEQUENCES AND
RANDOMSEQUENCES(198 SUBJECTS)
Stage Sequences Random Sequences
0.4203 (±0.081) 2.1972 (±0.025)
In Section III-E, we designed an experiment to compare the sleep stage sequence with random sequence using Kolmogorov complexity. The process of this experiment is summarized as follows: for each subject, 1) calculate the Kolmogorov com-plexity of stage sequenceKs; 2) generate a random sequence
that has the same length with the stage sequence and calculate its Kolmogorov complexity valueKr. The results are shown
inTable VI. Higher value of Kolmogorov complexity indicates higher randomness. The results indicate that the stage sequence of whole night sleep is not a random sequence. Therefore, learn-ing stage transition rules can provide more information and knowledge about human sleep, and we showed that it improved the performance of classifiers.
In previous studies, several approaches have been applied to automated sleep stage scoring. Hae-Jeong et al. [12] used a rule-based and artificial neural networks approach based on 58 features, which they extracted from EEG, EOG and EMG sig-nals, to perform automatic sleep scoring. It had a performance of 85.9% for 4 subjects. Masaaki et al. [21] proposed a method using C4.5 decision tree and applied it to 6 features extracted from EEG, EOG and EMG signals. Their accuracy was 81.4% for 5 subjects. In 2009, a model based on Hilbert-Huang trans-form, proposed by Li et al. [16], showed an average accuracy of 81.70% in 16 sleep records from a single EEG channel. In the same year, Fraiwan et al. [17] proposed a classifier of regression trees based on 54 extracted wavelet features from EEG, and
re-LI et al.: HYCLASSS: A HYBRID CLASSIfiER FOR AUTOMATIC SLEEP STAGE SCORING 383
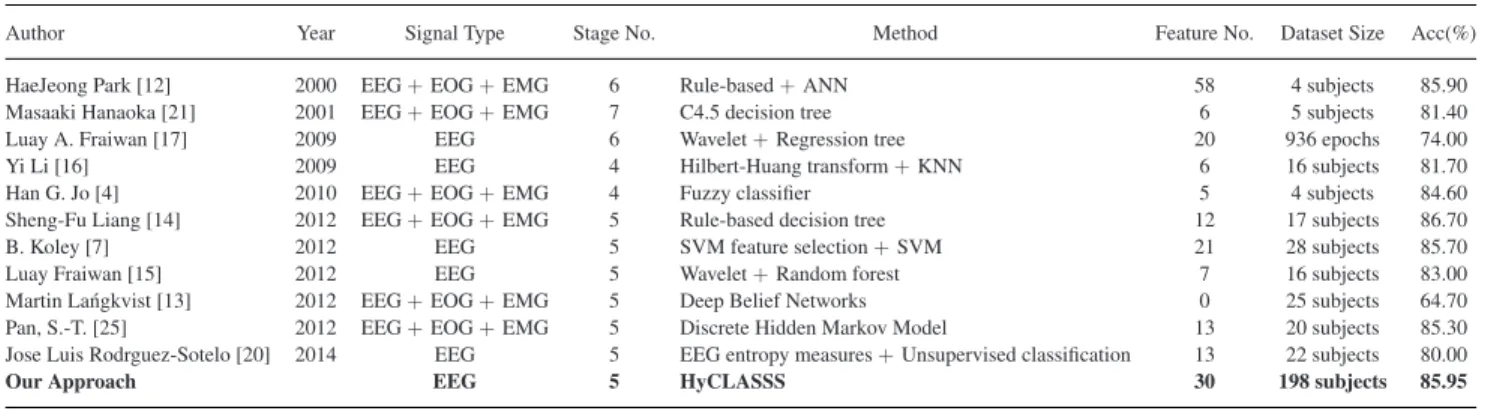
TABLE VII
COMPARISON WITHPREVIOUSWORK
Author Year Signal Type Stage No. Method Feature No. Dataset Size Acc(%)
HaeJeong Park [12] 2000 EEG+EOG+EMG 6 Rule-based+ANN 58 4 subjects 85.90 Masaaki Hanaoka [21] 2001 EEG+EOG+EMG 7 C4.5 decision tree 6 5 subjects 81.40
Luay A. Fraiwan [17] 2009 EEG 6 Wavelet+Regression tree 20 936 epochs 74.00
Yi Li [16] 2009 EEG 4 Hilbert-Huang transform+KNN 6 16 subjects 81.70
Han G. Jo [4] 2010 EEG+EOG+EMG 4 Fuzzy classifier 5 4 subjects 84.60
Sheng-Fu Liang [14] 2012 EEG+EOG+EMG 5 Rule-based decision tree 12 17 subjects 86.70
B. Koley [7] 2012 EEG 5 SVM feature selection+SVM 21 28 subjects 85.70
Luay Fraiwan [15] 2012 EEG 5 Wavelet+Random forest 7 16 subjects 83.00
Martin La´ngkvist [13] 2012 EEG+EOG+EMG 5 Deep Belief Networks 0 25 subjects 64.70 Pan, S.-T. [25] 2012 EEG+EOG+EMG 5 Discrete Hidden Markov Model 13 20 subjects 85.30 Jose Luis Rodrguez-Sotelo [20] 2014 EEG 5 EEG entropy measures+Unsupervised classification 13 22 subjects 80.00
Our Approach EEG 5 HyCLASSS 30 198 subjects 85.95
ported a 74% accuracy for all 936 epochs. Han G. Jo et al. [4] proposed a fuzzy classifier based on 5 features extracted from EEG, EOG and EMG signals that had an accuracy of 84.6% for 5 subjects. Sheng Fu et al. [14] proposed a rule-based decision tree approach in 2012 based on 12 EEG, EOG and EMG signal features which showed an accuracy of 86.7% with 17 subjects. In the same year, Koley et al. [7] built a model based on SVM feature selection and SVM classifier. 39 features were extracted from EEG signals, and the model was applied to classifying 28 subjects’ sleep records; their final accuracy was 85.7%. Frai-wan et al. [15] proposed a method using random forest based on 7 EEG signal wavelet features, and their average accuracy and kappa coefficient were 83% and 0.76 for 16 subjects. L¨angkvist
et al. [13] proposed a method with Deep Belief Network based
on original EEG signals (no extracted features), and their aver-age accuracy was 67.4% for 25 subjects. Pan et al. [25] proposed a method using Discrete Hidden Markov Model and applied to 13 features extracted from EEG, EOG and EMG signals; their accuracy was 85.3% for 20 subjects. Rodrguez-Sotelo et al. [20] built a model based on unsupervised feature classifica-tion algorithms with 13 EEG entropy measures, the model was applied to classify 22 subjects’ sleep records and had an accu-racy of 80%. All the studies mentioned above are summarized inTable VII.
In our experiment, the random forest classifier turned out to be a useful tool for classifying sleep stages with an accu-racy of 83.59%, and a kappa coefficient of 0.7715, which in-dicates a substantial agreement. A group of correction rules, learned from Markov model, was applied to the classification output of this random forest. This improved overall agreement of the HyCLASSS to 85.95%. Additionally, the average Co-hen’s kappa coefficient for 102 testing subjects was 0.8046 and represents an excellent agreement with the gold standard. Com-pared with previous works, HyCLASSS was applied to a much larger dataset, which included 198 subjects, and our results in-dicate that the performance of HyCLASS compared favorably to previous work for using a single EEG channel. Additionally, another advantage of HyCLASSS is that it is insensitive to the changing of parameters.
For computational complexity, the overall cost of feature ex-traction is O(n2), where n is the number of data points in
an EEG recording. This is because the non-linear dynamics features such as largest Lyapunov exponent and Kolmogorov entropy have complexity ofO(n2)[60], [61]. When using the random forest classifier method, building a single tree has time complexityO(mnlog(n)), where n is the number of instances and m is the number of attributes. The total time complex-ity for building a random forest is therefore O(pmnlog(n))
with p trees [62]. Our experiments were performed on a com-puter with Intel Core i7 (3.1 GHz) CPU and 16 GB mem-ory. For feature extraction, our average computational time was 4,374 seconds per subject. For classification, the training and testing time for all subjects were 779 and 795 seconds, respectively.
Another significance of our approach is that, to the best of our knowledge, this is the first time both signal and stage transi-tion features of sleep have been applied to automatic sleep stage scoring. HyCLASSS provides a new aspect on scoring sleep data. These two kinds of features reflect the different character-istics of sleep; one represents the signal changes of each stage, for example, SWS has more lower frequency components. The other stage transition features show the stage dynamic changes during the night sleep. For example, it is improbable to transi-tion from REM to SWS directly, and there has to be one or more transition stages between them, like S2. The major difference between whole night sleep stage scoring and the regular clas-sification problem is that the label sequence of sleep stages is another valuable source of information, since the stage sequence is not a random sequence, and there are underline relationships between stages. These relationships are useful for discovering new mechanisms of sleep regulation and its evolution, and it may provide help in predicting specific outcomes [27].
Our study has some limitations: 1) only signals from a single EEG channel were used in classification, 2) the correction rules may not be suitable for all situations, 3) we have not considered the effects of diseases, such as narcolepsy, insomnia and sleep disorder, on their influences on classification. In future work, we will focus on sleep stage scoring using multiple PSG signals, such as EOG and EMG, to improve the performance of our approach. Moreover, we will design more elegant algorithms for analyzing and classifying sleep data. Additionally, we will apply our approach to more datasets, especially to the datasets
of different sleep diseases studies, which can be obtained from the NSRR website [9].
VI. CONCLUSION
A hybrid classifier (HyCLASSS), combining the benefits of random forest classifier and correction rules has been proposed for automatic sleep stage scoring with single channel EEG recordings. Several features from temporal, frequency and non-linear analyses provided valuable information to characterize sleep stages. Random forest classifiers were shown to be a use-ful tool to obtain high accuracy sleep stage classification from EEG recordings. The automatically constructed correction rules, which were based on the dynamic stage transition feature, sig-nificantly improved the performance of the classifier. The results indicated an excellent agreement between automatic scoring and the gold standard.
REFERENCES
[1] S. Panda, J. B. Hogenesch, and S. A. Kay, “Circadian rhythms from flies to human,” Nature, vol. 417, no. 6886, pp. 329–335, 2002.
[2] M.-H. Chung, T. B. Kuo, N. Hsu, H. Chu, K.-R. Chou, and C. C. Yang, “Sleep and autonomic nervous system changes? Enhanced cardiac sympa-thetic modulations during sleep in permanent night shift nurses,” Scand. J.
Work, Environ. Health, vol. 35, pp. 180–187, 2009.
[3] J. M. Ellenbogen, J. D. Payne, and R. Stickgold, “The role of sleep in declarative memory consolidation: Passive, permissive, active or none?”
Current Opinion Neurobiol., vol. 16, no. 6, pp. 716–722, 2006.
[4] H. G. Jo, J. Y. Park, C. K. Lee, S. K. An, and S. K. Yoo, “Genetic fuzzy classifier for sleep stage identification,” Comput. Biol. Med., vol. 40, no. 7, pp. 629–634, 2010.
[5] E. A. Wolpert, “A manual of standardized terminology, techniques and scoring system for sleep stages of human subjects,” Arch. Gen. Psychiatry, vol. 20, no. 2, 1969, Art. no. 246.
[6] V. J¨a¨askinen, “Modelling sleep stages with Markov chains,” 2009. [7] B. Koley and D. Dey, “An ensemble system for automatic sleep stage
clas-sification using single channel EEG signal,” Comput. Biol. Med., vol. 42, no. 12, pp. 1186–1195, 2012.
[8] D. Dean et al., “Scaling up scientific discovery in sleep medicine: The national sleep research resource,” Sleep, vol. 39, no. 5, pp. 1151–64, 2016. [9] National sleep research resource website. [Online]. Available:
https://sleepdata.org/
[10] R. Maulsby, J. Frost, and M. Graham, “A simple electronic method for graphing EEG sleep patterns,” Electroencephalogr. Clin. Neurophysiol., vol. 21, no. 5, pp. 501–503, 1966.
[11] H. W. Agnew, J. C. Parker, W. B. Webb, and R. L. Williams, “Ampli-tude measurement of the sleep electroencephalogram,” Electroencephalogr.
Clin. Neurophysiol., vol. 22, no. 1, pp. 84–86, 1967.
[12] H. Park, K. Park, and D.-U. Jeong, “Hybrid neural-network and rule-based expert system for automatic sleep stage scoring,” in Proc. 22nd Annu. Int.
Conf. IEEE Eng. Med. Biol. Soc., 2000, vol. 2, pp. 1316–1319.
[13] M. L¨angkvist, L. Karlsson, and A. Loutfi, “Sleep stage classification using unsupervised feature learning,” Adv. Artif. Neural Syst., vol. 2012, 2012, Art. no. 5.
[14] S.-F. Liang, C.-E. Kuo, Y.-H. Hu, and Y.-S. Cheng, “A rule-based auto-matic sleep staging method,” J. Neurosci. Methods, vol. 205, no. 1, pp. 169– 176, 2012.
[15] L. Fraiwan, K. Lweesy, N. Khasawneh, H. Wenz, and H. Dickhaus, “Au-tomated sleep stage identification system based on time–frequency analysis of a single EEG channel and random forest classifier,” Comput. Methods
Programs Biomed., vol. 108, no. 1, pp. 10–19, 2012.
[16] Y. Li, F. Yingle, L. Gu, and T. Qinye, “Sleep stage classification based on EEG hilbert-huang transform,” in Proc. 4th IEEE Conf. Ind. Electron.
Appli., 2009, pp. 3676–3681.
[17] L. Fraiwan, N. Khaswaneh, and K. Lweesy, “Automatic sleep stage scor-ing with wavelet packets based on sscor-ingle EEG recordscor-ing,” in Proc. World
Acad. Sci., Eng. Technol, Paris, France, 2009, vol. 54, pp. 385–488.
[18] F. Ebrahimi, M. Mikaeili, E. Estrada, and H. Nazeran, “Automatic sleep stage classification based on EEG signals by using neural networks and
wavelet packet coefficients,” in Proc. 30th Annu. Int. Conf. IEEE Eng.
Med. Biol. Soc., 2008, pp. 1151–1154.
[19] C.-F. V. Latchoumane and J. Jeong, “Quantification of brain macrostates using dynamical nonstationarity of physiological time series,” IEEE Trans.
Biomed. Eng., vol. 58, no. 4, pp. 1084–1093, Apr. 2011.
[20] J. L. Rodr´ıguez-Sotelo, A. Osorio-Forero, A. Jim´enez-Rodr´ıguez, D. Cuesta-Frau, E. Cirugeda-Rold´an, and D. Peluffo, “Automatic sleep stages classification using eeg entropy features and unsupervised pattern analysis techniques,” Entropy, vol. 16, no. 12, pp. 6573–6589, 2014. [21] M. Hanaoka, M. K. Ashi, and H. Yamazaki, “Automated sleep stage
scoring by decision tree learning,” in Proc. 23rd Annu. Int. Conf. IEEE
Eng. Med. Biol. Soc., 2001, vol. 2, pp. 1751–1754.
[22] S. G¨unes¸, K. Polat, and S¸. Yosunkaya, “Efficient sleep stage recogni-tion system based on EEG signal using k-means clustering based feature weighting,” Expert Syst. Appl., vol. 37, no. 12, pp. 7922–7928, 2010. [23] D. Nov´ak, Y. Al-Ani, and L. Lhotska, “Electroencephalogram
process-ing usprocess-ing hidden Markov models,” in Proc. 5th EUROSIM Congr. Model.
Simul., 2004.
[24] L. Doroshenkov and V. Konyshev, “Usage of hidden Markov models for automatic sleep stages classification,” in Proc. Russ.-Bavarian Conf.
Biomed. Eng., 2007, Paper 19.
[25] S.-T. Pan, C.-E. Kuo, J.-H. Zeng and, S.-F. Liang, “A transition-constrained discrete hidden Markov model for automatic sleep staging,”
Biomed. Eng. Online, vol. 11, 2012, Art no. 52.
[26] A. Laffan, B. Caffo, B. J. Swihart, and N. M. Punjabi, “Utility of sleep stage transitions in assessing sleep continuity,” Sleep, vol. 33, no. 12, 2010, Art no. 1681.
[27] A. Kishi, Z. R. Struzik, B. H. Natelson, F. Togo, and Y. Yamamoto, “Dynamics of sleep stage transitions in healthy humans and patients with chronic fatigue syndrome,” Amer. J. Physiol-Regulatory, Integrative
Com-parative Physiol., vol. 294, no. 6, pp. R1980–R1987, 2008.
[28] J. R. Landis and G. G. Koch, “The measurement of observer agreement for categorical data,” Biometrics, vol. 33, no. 1, pp. 159–174, 1977. [29] J. Sim and C. C. Wright, “The kappa statistic in reliability studies: Use,
interpretation, and sample size requirements,” Phys. Therapy, vol. 85, no. 3, pp. 257–268, 2005.
[30] C. J. van Rijsbergen, Information Retrieval. London, U.K.: Butterworth, 1979.
[31] D. M. W. Powers, “Evaluation: From precision, recall and f-measure to ROC, informedness, markedness and correlation,” J. Mach. Learn. Technol., vol. 2, no. 1, pp. 37–63, 2011.
[32] T.-C. Fu, “A review on time series data mining,” Eng. Appl. Artif. Intell., vol. 24, no. 1, pp. 164–181, 2011.
[33] N. V. Thakor and S. Tong, “Advances in quantitative electroencephalo-gram analysis methods,” Annu. Rev. Biomed. Eng., vol. 6, pp. 453–495, 2004.
[34] B. Hjorth, “EEG analysis based on time domain properties,”
Electroen-cephalogr. Clin. Neurophysiol., vol. 29, no. 3, pp. 306–310, 1970.
[35] J. Jobson, Applied Multivariate Data Analysis: Volume II: Categorical
and Multivariate Methods. Berlin, Germany: Springer, 2012.
[36] S. Charbonnier, L. Zoubek, S. Lesecq, and F. Chapotot, “Self-evaluated automatic classifier as a decision-support tool for sleep/wake staging,”
Com-put. Biol. Med., vol. 41, no. 6, pp. 380–389, 2011.
[37] S. J. Redmond and C. Heneghan, “Cardiorespiratory-based sleep staging in subjects with obstructive sleep apnea,” IEEE Trans. Biomed. Eng., vol. 53, no. 3, pp. 485–496, Mar. 2006.
[38] D. Hord, L. Johnson, A. Lubin, and M. Austin, “Resolution and stability in the autospectra of EEG,” Electroencephalogr. Clin. Neurophysiol., vol. 19, no. 3, pp. 305–308, 1965.
[39] J. Fell, J. R¨oschke, K. Mann, and C. Sch¨affner, “Discrimination of sleep stages: A comparison between spectral and nonlinear EEG measures,”
Elec-troencephalogr. Clin. Neurophysiol., vol. 98, no. 5, pp. 401–410, 1996.
[40] R. Acharya, O. Faust, N. Kannathal, T. Chua, and S. Laxminarayan, “Non-linear analysis of EEG signals at various sleep stages,” Comput. Methods
Programs Biomed., vol. 80, no. 1, pp. 37–45, 2005.
[41] L. Breiman, “Random forests,” Mach. Learn., vol. 45, no. 1, pp. 5–32, 2001.
[42] Y. H. Hu and J.-N. Hwang, Handbook of Neural Network Signal
Process-ing. Boca Raton, FL, USA: CRC Press, 2001.
[43] T. Joachims, “Making large scale SVM learning practical,” in Advances in
Kernel Methods–Support Vector Learning, B. Sch¨olkopf, C. J. C. Burges,
and A. J. Smola, Eds. Cambridge, MA: MIT Press, 1998.
[44] S. R. Safavian and D. Landgrebe, “A survey of decision tree clas-sifier methodology,” IEEE Trans. Syst. Man, Cybern., vol. 21, no. 3, pp. 660–674, May/Jun. 1991.
LI et al.: HYCLASSS: A HYBRID CLASSIfiER FOR AUTOMATIC SLEEP STAGE SCORING 385
[45] Cleveland children’s sleep and health study. National Sleep Research Resource, Boston, MA, USA. [Online]. Available: https://sleepdata. org/datasets/ccshs
[46] The cleveland family study. National Sleep Research Resource, Boston, MA, USA. [Online]. Available: https://sleepdata.org/datasets/cfs [47] N. Bian, Y. Cao, B. Wang, F. Gu, and L. Zhang, “Prediction of epileptic
seizures based on second-order c_ (0) complexity,” OALib Journal, 2007. [48] F. Chen, F. Gu, J. Xu, Z. Liu, and R. Liu, “A new measurement of
complex-ity for studying eeg mutual information,” Shengwu Wuli Xuebao, vol. 14, no. 3, pp. 508–512, 1997.
[49] J. Bruhn, L. E. Lehmann, H. R¨opcke, T. W. Bouillon, and A. Hoeft, “Shannon entropy applied to the measurement of the electroencephalo-graphic effects of desflurane,” J. Amer. Soc. Anesthesiologists, vol. 95, no. 1, pp. 30–35, 2001.
[50] C. E. Shannon, “A mathematical theory of communication,” ACM
SIG-MOBILE Mobile Comput. Commun. Rev., vol. 5, no. 1, pp. 3–55, 2001.
[51] J. Fell, J. R¨oschke, and P. Beckmann, “Deterministic chaos and the first positive lyapunov exponent: A nonlinear analysis of the human electroen-cephalogram during sleep,” Biol. Cybern., vol. 69, no. 2, pp. 139–146, 1993.
[52] I. Rezek and S. J. Roberts, “Stochastic complexity measures for phys-iological signal analysis,” IEEE Trans. Biomed. Eng., vol. 45, no. 9, pp. 1186–1191, Sep. 1998.
[53] T. Inouye et al., “Quantification of EEG irregularity by use of the entropy of the power spectrum,” Electroencephalogr. Clin. Neurophysiol., vol. 79, no. 3, pp. 204–210, 1991.
[54] H. Kantz and T. Schreiber, Nonlinear Time Series Analysis, vol. 7. Cambridge, U.K.: Cambridge Univ. Press, 2004.
[55] M. Li and P. Vit´anyi, An Introduction to Kolmogorov Complexity and Its
Applications. Berlin, Germany: Springer, 2013.
[56] P. Grunwald and P. Vit´anyi, “Shannon information and Kolmogorov com-plexity,” IEEE Trans. Information Theory, Sep. 2004.
[57] L. Fortnow, “Kolmogorov complexity,” in Aspects of Complexity, vol. 4. New Zealand: New Zealand Mathematical Research Insti-tute (Short Courses in Complexity from the New Zealand Mathe-matical Research Institute Summer 2000 Meeting, Kaikoura), 2001, pp. 73–86.
[58] R. B. Berry, R. Brooks, C. E. Gamaldo, S. Hardling, C. Marcus, and B. Vaughn, The AASM manual for the scoring of sleep and associated
events Rules, Terminology and Technical Specifications. Darien, IL, USA:
American Academy of Sleep Medicine, 2012.
[59] E. W. Dijkstra, “A note on two problems in connexion with graphs,”
Numer. Math., vol. 1, no. 1, pp. 269–271, 1959.
[60] M. T. Rosenstein, J. J. Collins, and C. J. De Luca , “A practical method for calculating largest Lyapunov exponents from small data sets,” Phys. D,
Nonlinear Phenom., vol. 65, no. 1/2, pp. 117–134, 1993.
[61] A. Teixeira, A. Matos, A. Souto, and L. Antunes, “Entropy measures vs. Kolmogorov complexity,” Entropy, vol. 13, no. 3, pp. 595–611, 2011.
[62] G. Biau, “Analysis of a random forests model,” J. Mach. Learn. Res., vol. 13, no. 1, pp. 1063–1095, 2012.