ISSN 1651-0852
FIEF Working Paper Series 2002
No. 182
Gender Differences in Rent Sharing and
Its Implications for the Gender Wage Gap*
by
Lena Nekby
†Abstract
Based on a large matched employer-employee data set for Sweden, this study analyses gender differences in rent sharing. Results indicate a general pattern of significantly smaller remuneration from firm profits for women. Gender differences in rent sharing, however, explain less than two percent of gender wage differentials. This is not unexpected, as gender differences are found not in the mean profit levels of employing firms, but in remuneration from firm profit.
Keywords: Wages; Profits; Rent sharing; Gender
JEL classification: D31; J31; J70
December 16, 2002
* I am grateful to Mahmood Arai, Karsten Albaek, Fredrik Heyman, Roger Vilhelmsson and
Johnny Zetterberg for helpful comments and advice on this and earlier drafts as well as to seminar participants at the Trade Union Institute for Economic Research (FIEF). I also wish to thank Per Weidenman, MM Partner AB, for providing the firm data.
† Trade Union Institute for Economic Research (FIEF) and Department of Economics,
Stockholm University. Corresponding address: FIEF, Wallingatan 38, S-111 24 Stockholm, Sweden. E-Mail: [email protected]
1. Introduction
This study, using a large matched employer-employee data set, analyses gender differences in rent sharing, and estimates if these differences provide a partial explanation to the gender wage gap. The effect of firm or industry profits on wages has been empirically documented in previous studies but few have analysed potential gender differences in rent sharing.1 Initial gender specific estimation in Sweden by Arai (1999) and Arai & Heyman (2001) indicate that the association between firm profits and wages significantly differs between women and men. Although both experience a positive effect of firm profit on wages, the magnitude of this effect is smaller for women.2
There are a number of potential theoretical explanations for gender differences in rent sharing, elaborated on in the next section. In short, gender differences in rent sharing may be due to gender differences in bargaining strength or in outside options affecting wage bargaining outcomes. A systematic sorting of women and men into firms with varying profitability or varying capital intensity may also provide a partial explanation. In addition, there may be a sorting by gender, within firms, into positions with varying possibilities of rent extraction. The purpose of this paper will be to analyse various explanations for gender differences in rent sharing and estimate the implications for the male-female wage differential. As such, it adds to the growing empirical literature turning to workplace characteristics, especially productivity related factors, in association with individual characteristics to explain the gender wage gap.
1 Initial studies in Sweden, Homlund & Zetterberg (1991) using aggregated industry
data and Forslund (1994) using manufacturing firm-level data, found no evidence for the existence of rent sharing. With the availability of micro data, Arai (1999) and Arai & Heyman (2001) with matched employer-employee data, were able to document a positive effect of firm profit on wages in Sweden. Other studies confirming rent sharing using longitudinal matched employer-employee data include Abowd et al., (1999) and Margolis & Salvanes (2001). See also Abowd & Lemiux (1993) and Cristofides & Oswald (1992) using Canadian contract data as well as Katz & Summer (1989) using U.S. employee data. For European studies see Blachflower et al., (1996), Hildreth & Oswald (1997), Nickell et al., (1994) and the references therein.
2 Arai (1999) using an employer-employee data set covering approximately 600 firms
and 800 employees finds an insignificant relationship between firm average profits and wages for women amounting to one-third of the corresponding significant male estimate. Arai & Heyman (2001) using a larger employer-employee data set (over 100,000 employees matched to over 6,000 firms) find a significant effect of firm profit on wages for both women and men, but smaller for women. The elasticity of wages with respect to profits is 0.017 for men and 0.010 for women, indicating significant differences in rents.
The results presented in this study indicate a pattern of significantly smaller remuneration from lagged firm profit on wages for female employees. Sorting into firms within different industries or with differing capital intensity partially explain these gender differences. The elasticity of wages with respect to firm profits is consistently 30 – 60 percent lower for women than comparable male estimates. Rent sharing is found to generally increase along the wage distribution but differences in remuneration between high wage female and male employees is also found to increase. OLS regressions, estimating the mean effect of various characteristics on wages, indicate that gender differences in rent sharing do little to explain the gender wage gap when including controls for human capital and industry affiliation. Firm profits explain no more than two percent of the gender wage differential in Sweden, as men and women, on average work within firms with similar mean profit levels.
The results presented here therefore differ from the only known, to the author, comparable empirical study, Rycx (2002). This study, analysing the Belgian labor market, finds that gender differences in rent sharing explain 14 percent of the gender wage gap due to a sorting, by gender, into firms with varying profitability.
The remainder of the paper is as follows. The next section gives a brief theoretical overview of why gender differences in rent sharing may arise. Section 3 describes the data and introduces the empirical set-up. Results are discussed in Section 4, followed by concluding remarks in Section 5.
2. Theoretical background
Simple models of bargaining, over wages and employment, theoretically illustrate a link between profits and wages.3 In a standard Nash-bargaining set up, firms maximize a profit function and negotiate with a union or group of workers maximizing a wage gain for its members. The equilibrium wage is a function of workers’ outside options,4 the quasi rents per worker, i.e., by firm profit evaluated at the opportunity cost of labor, and the relative bargaining power of the parties involved. Gender differences in bargaining outcomes, controlling for human capital differences, are then a result of gender differences in outside options,
3 See for example Blanchflower et al., (1996).
4 As determined by wages in other sectors of the economy, unemployment benefit levels
and unemployment rates.
systematic differences in the profit levels of firms men and women are sorted into or due to gender differences in bargaining strength.5
Sap (1993) introduces gender explicitly into a union bargaining framework by modelling a two-stage negotiation process where the first stage is characterized by internal negotiations within a union, or employee organisation, between men and women preceding second stage bargaining at the collective level between the union and the firm.6 Combining first order conditions from the first and second stage yields the standard solutions of the monopoly union model, i.e., that wage rates depend on the average levels of unemployment benefits and on the elasticity of demand for labor, but now with two additional determinants. Wage rates are found to also depend on the relative bargaining strength of female and male unionists and the threat points of each group, i.e., by female and male unemployment benefit levels.7
Some degree of rent sharing may also be bargained at the individual level. Wage drift from collective bargaining outcomes to the individual level has, in Sweden, been verified in previous studies.8 If women, on average, are less proficient at bargaining over wages, gender differences in rent sharing can arise. In addition, women may self-select out of or have limited access to positions where wage outcomes vary according to firm performance.
Gender differences in the capital-to-labor ratio of employing firms may also be a source for rent sharing differences between men and women. Katz and Summers (1989) argue that wages tend to be higher in capital-intensive industries as workers are assumed to have more leverage to extract rents during wage bargaining within these firms. If there are systematic differences in the capital-intensity of firms to which men and women are sorted into, this too may provide a partial explanation for gender differences in rent sharing.
5 At the collective level, gender differences in bargaining strength may for example, be
influenced by the gender composition of the workers union.
6 In the first stage, men and women maximise group specific gains, by gender, from
bargaining, i.e., maximise the total income of the female (male) labor force where the threat point is defined as the level of female (male) unemployment benefits.
7 See Sap (1993) pp. 27-34 for derivation of the model introducing gender differences in
the wage bargaining process. The relative bargaining strengths of female and male unionists are derived to be the bargaining power of each group divided by its share of the labor force.
8 See for example Holmlund & Skedinger (1990), Holden (1998) and the references
therein.
3. Data and
e
mpirical
s
et-up
The data stems from the 1991 Level of Living Survey (LNU), a 1/1000 random sample of the Swedish working-age population (18–65). All individuals in the 1991 LNU sample were matched to their employing organizations by means of unique organization numbers. These establish-ments, identified from the LNU individuals, form the basis of the Swedish Establishment Survey (APU), a survey collecting administrative data for all
employees in the above-identified establishments during 1987, 1991 and 1995. Data on wages and individual characteristics are matched to the above individual data. Information on wages comes from the Swedish Trade Union Confederation (LO) and the Swedish Employers’ Confede-ration (SAF) wage data as well as from the Income and Asset Register of Statistics Sweden (SCB). Individual employment records covering the years 1992 - 1995 come from the National Labor Market Board’s (AMS) Event Database. Official balance-sheet data for the employing firms are matched to the individual data by means of the Swedish system of corporate registration numbers. The final data set contains 172,294 individuals matched to 6,783 firms in 1991 and 175,049 individuals matched to 5,331 firms in 1995.9
Wages are computed as full time equivalent pre-tax monthly salaries, not including overtime compensation. Use of full time equivalent wages allows for a gender wage comparison disregarding differences in working time, but including controls for experience and seniority.
Data on profits from official balance-sheet reports are available from 1987 - 1995. Profits, defined as annual profits after capital depreciation per employee, are calculated as four-year averages preceding the two years, 1991 and 1995, for which wage estimations are calculated. Using four-year averages is motivated by the large variation in annual profits as well as by minimisation of potential measurement error.
There are two potential complications in testing for the existence of rent sharing. One concerns the potential simultaneity bias between wages and profits. A positive correlation between wages and profit is consistent with efficiency wage arguments of non-competitive models with barriers to entry.10 As the aim of this study is to estimate the impact of profits on wages and not vice versa, lagged averages for firm profit are used in estimation. In addition, the accounting relationship between wages and
9 See Appendix for definition of variables used in estimation.
10 Efficiency wage models predict higher profits for firms that pay higher wages due to
increased motivation, lower turnover costs, less shirking or via improved employer/employee relations.
profits implies that high wages may lead to low profits. Use of lagged profits solves these complications, as firm profits are then pre-determined in wage estimation.11
Initially cross section estimates of the association between lagged average profits and wages are calculated for 1991 and 1995, based on a full interaction specification of the following basic model:12
ijt ijt ijt ijt ijt X IND E W α β + ′ β + β +ε Π + = 1 2 3 ln (1)
Wijt denotes the wages of individual i in firm j at time t, Π/E denotes
average lagged profit (Π) per employee (E). This average is based on data from 1987-1990 for estimation on 1991 data and from 1991-1994 for estimation on 1995 data. X is a vector of human capital characteristics including education, experience and seniority. IND denotes industry affiliation at the two digit SIC level. The robustness of estimation results to the addition of individual unemployment history (1995) will be examined as well as to other firm and establishment variables such as the capital-to-labor ratio and gender composition. In order to quantify estimation results, the elasticity of wages with respect to profits is reported as well as wage gap estimates based on the so-called Pooled Decomposition of Oaxaca (1973) and Oaxaca and Ransom (1994).
Means tests indicate that the mean profit level of employing firms differs significantly between men and women, but that the magnitude of this difference is small.13 Gender differences in the mean profit level of employing firms however, increase dramatically when looking at sub samples of individuals in leadership positions and even more so for a sample of executive directors.14 In terms of industry differences, the 1991
11 Various instruments for profits have also been tested in the literature, Arai & Heyman
(2001), for example, in estimation on a similar data set, use demand elasticity in the product market and degree of competition as instruments for profits yielding results indicating that the positive association between firm profits and wages are robust to estimation using instruments.
12 A full interaction model implies that each explanatory variable is interacted with a
female dummy variable, allowing for full heterogeneity, in human capital and firm effects on wages, between men and women. The full interaction model yields point estimates for each explanatory variable (for females calculated by adding the interaction term to the explanatory variable in question) equal to estimates generated by regressing the wage equation separately by gender.
13 See sample means in Appendix.
14 Data on occupational position is available for white-collar workers in the 1995 data.
Estimation on sub-samples of white-collar workers is discussed further in Section 4. 5
data indicate that women within the mineral extraction, construction and manufacturing industries are employed in firms with significantly higher mean profits than their male counterparts while within the agricultural and retail industries women are found in firms with significantly smaller mean profits. The 1995 data shows contrary results for manufacturing, i.e., that men are employed within firms in this industry with significantly higher mean profit levels. The same holds true for men in services.15 These descriptive statistics and their relationship to the estimation results will be discussed further below.
4. Results
Initially, a full interaction wage regression was estimated for each year, with lagged average profit-per-employee (lagged four year averages) as well as its interaction with a female dummy variable, as the main explana-tory variables of interest.16 In each model specification, all human capital and firm variables are interacted with a female dummy variable in order to allow for complete heterogeneity in human capital and firm effects between men and women.17 In order to control for the potential bias stemming from aggregated firm variables in an individual wage specification, standard errors are corrected for within-group correlated errors in all estimations.18
The results for 1991, reported in Table 1, show a significant positive association between lagged firm profit and individual wages regardless of model specification and including controls for industry affiliation. The interaction between lagged average profits and gender indicates (weakly) significant differences between men and women in remuneration from firm profits both without and with controls for human capital (models 1 and 2, Table 1). The lower coefficient for lagged profits when controlling for human capital indicates that some of the positive association between firm
15 Mean profit levels indicate that the mineral extraction industry has the highest
average profit levels both years. Other high profit industries include gas/water/electricity, manufacturing and retail. Low profit industries include post/telecommunications and services.
16 Lagged average profit-per-employee hereafter referred to as lagged average (firm)
profit.
17 The full interaction model, interacting all explanatory variables with the female
dummy variable, implies that the variable ‘female’ captures remaining gender differences in wages, given that men and women are remunerated differently for human capital and firm effects.
18 See Moulton (1990) for discussion on the problems associated with estimating
aggregate variables on micro units.
Table 1: Effect of Firm Average Profits on Wages, 1991
Dependent variable: log monthly wage. Full interaction model (gender interactions). Standard errors corrected for within group (firm)
correlations. (1) (2) (3) (4) (5) Profit/Employee 0.089* (0.028) (0.017) 0.062* (0.017) 0.062* (0.019) 0.066* (0.017) 0.053* Female*Profit/ Emp. -0.027*** (0.015) -0.018*** (0.010) -0.024** (0.011) -0.024** (0.012) -0.019*** (0.012) Female -0.145* (0.009) 0.045* (0.013) 0.110* (0.017) 0.038 (0.051) 0.110* (0.018) Proportion Female (establishment level) -- -- 0.032 (0.035) 0.048 (0.036) 0.039 (0.035) Prop. Fem.*Female -- -- -0.141* (0.036) -0.156* (0.035) -0.143* (0.036) Capital Intensity (firm level) -- -- -- -- 0.002** (0.001) Female*Cap. Intensity -- -- -- -- -0.001 (0.001)
Human Capital No Yes Yes Yes Yes Industry No No No Yes No R2 0.09 0.39 0.40 0.40 0.40
No. of Obs. 172,294 172,294 172,294 172,294 172,294 No. of firms 6,783 6,783 6,783 6,783 6,783
Notes: * indicates significance at the 1 percent level, ** at the 5 percent level and *** at
the 10 percent level. Human capital controls include education, seniority, experience and experience squared. Industry dummies are at the two-digit level. Human capital controls, firm effects and industry dummies all interacted with female dummy variable. profit and wages is due to a sorting of highly educated and skilled individuals into profitable firms. Calculating the elasticity of wages with respect to firm profits, using gender-specific mean profit levels for 1991, yields an estimated elasticity for men equal to 0.021 and for women,
0.015.19 This implies that a 1-percentage point increase in the profits of an employing firm has an approximately 30 percent lower effect on female wages than male wages.20
In order to test the power in numbers argument proposed by Sap (1993), i.e., that the proportion of female workers in the bargaining unit influences the strength of this group in so called first stage negotiations within the union or employee organisation and therefore wage outcomes after second stage negotiations with the employer, information on gender composition at the establishment level is used. Adding a control for the proportion of female employees at the establishment level as well as its interaction with a female dummy variable yields results, shown in model 3 of Table 1, that gender composition has a negative and significant effect on wages for women but an insignificant effect on wages for men. Gender differences in rent sharing also increase and remain significant. In separate estimations, by gender, the proportion of female employees was interacted with lagged average profits. The gender composition/average profits interaction in these estimations indicates that gender composition does not influence rents. A larger significant difference in rent sharing in model 3 therefore reflects a sorting effect by gender into different industries. A relatively high proportion of women are found within firms in the retail, bank and insurance, and service industries. Of these, only the retail industry is characterized by relatively high mean profits.21 Note however, that within the retail industry, the mean profit level of employing firms is significantly smaller for women than for men.22
Controlling for industry affiliation does not alter results of significant gender differences in rent sharing. Female employees have 2,4 percentage points lower remuneration for firm profits on wages than their male counterparts (see model 4, Table 1). The elasticity of wages with respect to profits is equal to 0.022 for men and 0.014 when controlling for industry affiliation, i.e., 36 percent lower for female employees. This model specification also controls for gender composition implying that gender differences in rent sharing exist within industries given a potential sorting of men and women into firms with varying profitability. Gender differences
19 Calculated using coefficients from model 2, Table 1.
20 The elasticity reported for men, falls well within the range of those previously
reported for Canada, the UK, and the US, as well as for Sweden. See for example, Christofides and Oswald (1992), Hildreth and Oswald (1997) and for Sweden, Arai & Heyman (2001).
21 See Appendix for mean profit levels by industry.
22 The mean profit level of employing firms for female employees in the retail industry
is 0.24 (st. dev. 0.50) compared to 0.37 (st. dev. 0.65) for male employees in 1991. 8
in rent sharing may then be a consequence of a sorting within firms into positions with different possibilities of rent extraction.
In order to determine whether a systematic sorting of women into firms with varying capital intensity explains gender differences in rent sharing, the full interaction wage equation is again re-estimated including firm capital intensity and its gender interaction.23 Results for 1991 are shown in model 5 of Table 1. The coefficient for firm capital-intensity is positive and significant and the interaction term insignificant. The coefficient for lagged average profits is significant but somewhat smaller due to the correlation between lagged average profits and capital intensity. Gender differences remain significant implying that men and women do not appear to be systematically sorted into firms with varying capital intensity.
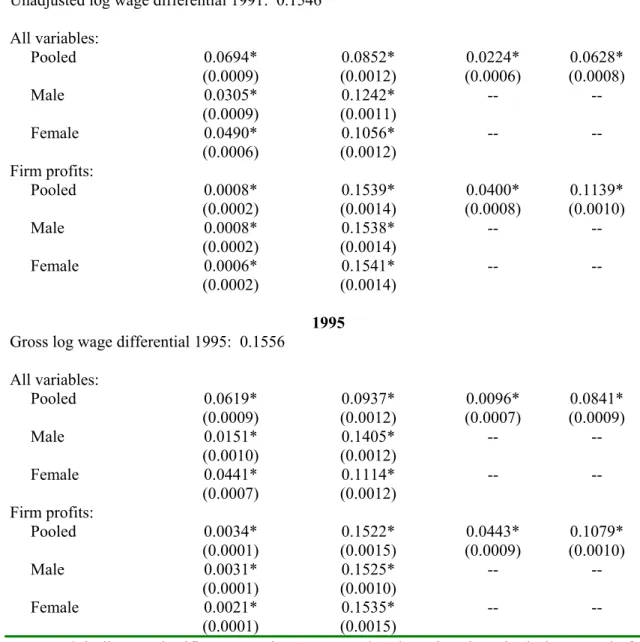
Wage gap estimates controlling for human capital and industry affiliation indicate that a large part of the unadjusted log wage differential of 0.1546 for 1991 is attributable to the unexplained effect, i.e., to gender differences in remuneration for human capital and firm profits within industries.24 The marginal impact of rent sharing is small. Wage decompositions for estimation based on firm profit only, indicate that differences in means explain only 0.0006 – 0.0008 of the wage gap for 1991, depending on assumed non-discriminatory wage structure. This implies that rent sharing alone explains less then one percent of the gender wage gap this year, a result that is not unexpected as mean differences in the average profit level of employing firms, between men and women, are small. The difference lies in the coefficients, i.e., in remuneration from firm profits.25
The data for 1995 yields somewhat different results as seen in Table 2. The association between lagged average profits and wages is smaller than 1991 estimates, but still positive and significant. 1995 marks the height of the economic recession that hit Sweden during this decade with open unemployment rates above 10 percent of the labor force.26 Smaller remuneration for firm profits is then consistent with theoretical predictions implying lower bargaining power due to poorer outside opportunities. Gender differences in rent sharing are of approximately the same magni-
23 Information on capital intensity comes from firm balance-sheet reports and is defined,
per firm, as lagged average ‘machines’ (assets) per employee, averaged over a four-year period.
24 The unadjusted log wage differential translates into an unadjusted mean female/male
wage ratio of 0.85 in 1991 and 0.86 in 1995, well in line with previous Swedish estimates. For an historical overview of gender wage differentials in Sweden, see Johansson et al., (2001).
25 See Table A3 in Appendix for wage decomposition results.
26 Unemployment, as a percentage of the labor force, was 10.1 percent in 1995,
compared to 3 percent in 1991.
Table 2: Effect of Firm Average Profits on Wages, 1995
Dependent variable: log monthly wage. Full interaction model (gender interactions). Standard errors corrected for within group (firm)
correlations. (1) (2) (3) (4) (5) (6) Profit/Employee 0.046* (0.013) 0.044* (0.013) 0.046* (0.013) 0.044* (0.013) 0.035* (0.014) 0.042* (0.012) Female*Profit/ Emp. -0.015 (0.012) -0.019*** (0.011) -0.026** (0.011) -0.025** (0.011) -0.017 (0.013) -0.024** (0.010) Female -0.148* (0.012) 0.084* (0.020) 0.140* (0.020) 0.103* (0.019) 0.131 (71.476) 0.106* (0.019) Proportion Female (establishment level) -- -- 0.043 (0.042) 0.033 (0.041) 0.051 (0.035) 0.035 (0.039) Prop. Fem.*Female -- -- -0.138* (0.039) -0.119* (0.039) -0.132* (0.029) -0.119* (0.037) Individual Unemployment -- -- -- -0.108* (0.007) -0.111* (0.008) -0.106* (0.007) Female*Ind. Unemployment -- -- -- 0.024* (0.008) 0.027* (0.007) 0.023* (0.008) Capital Intensity (firm level) -- -- -- -- -- 0.003* (0.001) Female*Cap. Intensity -- -- -- -- -- -0.002* (0.001)
Human Capital No Yes Yes Yes Yes Yes Industry No No No No Yes No R2 0.06 0.38 0.38 0.40 0.44 0.40
No. of Obs. 175,049 175,049 175,049 175,049 175,049 175,049 No. of firms 5,331 5,331 5,331 5,331 5,331 5,331
Notes: * indicates significance at the 1 percent level, ** at the 5 percent level and *** at
the 10 percent level. Human capital controls include education, seniority, experience and experience squared. Industry dummies are at the two-digit level. Human capital controls, firm effects and industry dummies all interacted with female dummy variable.
tude as indicated in the 1991 data and significant for controls for human capital, gender composition and firm capital intensity but not to controls for industry affiliation. This implies that gender differences in rent sharing are robust to some forms of sorting between firms, i.e., by gender composition and capital intensity, but are not generally found within industries in 1995.
Estimation on the 1995 data includes a control for individual unemployment history. This variable is available for the years 1992-1995 and therefore estimated on the 1995 data only.27 Individual unemployment history has a negative and significant effect on wages for both male and female employees but a significantly less negative effect for women. Controlling for individual unemployment history does not explain gender differences in rent sharing, both lagged average profits and its gender interaction remain significant. Separate regressions, by gender, including interactions between lagged average profit and individual unemployment history indicate that individual unemployment has a negative and significant effect on rents for men only.28 Estimates of the elasticity of wages with respect to firm profits, calculated for gender specific mean profit levels for 1995, indicate that estimates for female employees are approximately 45 - 65 percent smaller than comparable estimates for male employees, depending on model specification estimated on.
The results reported above indicate that female employees have approximately 2 percentage points lower remuneration for lagged firm profits on wages than their male counterparts. The significance of gender differences in rent sharing, between and within industries, varies somewhat between the two cross section estimations, notably that gender differences are not found within industries in the 1995 data. Accounting for gender differences in the mean profit levels of employing firms indicates that the elasticity of wages with respect to profits ranges from 30 to 65 percent lower for female employees. Wage decompositions on the 1995 data, based on estimations of firm profit only, indicate that differences in means explain 0.0021 – 0.0034 of the wage gap this year. Rent sharing alone therefore explains approximately two percent of the gender wage gap in 1995 due to slightly larger gender differences in the mean profit levels of employing firms.
In order to analyse more generally if remuneration from firm profits differs at different points in the wage distribution, i.e., to see if gender differences in rent sharing vary for those at the bottom of the wage
27 Individual employment history is based on data from National Labor Market Board’s
(AMS) Event Database and is defined as a dichotomous variable equal to one if the individual is registered as unemployed at anytime during the period 1992-1995.
28 Results available from author by request.
distribution, in comparison to those at the top of the wage distribution, simultaneous quantile regressions are estimated for each year.29 Results, shown in Table 3, for the 0.25, 0.50 and 0.75 percentiles of the total wage distribution indicate that rent sharing increases along the wage distribution.
Table 3: Effect of Firm Average Profits on Wages at Different
Percentiles of the Wage Distribution.
Dependent variable: log monthly wage. Full interaction model (gender interactions). Bootstrapped standard errors.
1991
0.25 Percentile 0.50 Percentile 0.75 Percentile Profit/Employee 0.037* (0.002) 0.068* (0.003) 0.102* (0.002) Female*Profit/ Emp. -0.007* (0.003) -0.035* (0.003) -0.052* (0.002) Human Capital Yes Yes Yes
Industry Yes Yes Yes
Pseudo R2 0.19 0.21 0.26
No. of Obs. 161,807 161,807 161,807
1995
0.25 Percentile 0.50 Percentile 0.75 Percentile Profit/Employee 0.023* (0.001) 0.024* (0.002) 0.044* (0.003) Female*Profit/ Emp. 0.004 (0.002) -0.009* (0.002) -0.033* (0.005) Human Capital Yes Yes Yes
Industry Yes Yes Yes
Pseudo R2 0.16 0.21 0.26
No. of Obs. 175,409 175,409 175,409
Notes: * indicates significance at the 1 percent level, ** at the 5 percent level and *** at
the 10 percent level. Human capital controls include education, seniority, experience and experience squared. Proportion female employees at the establishment level also included as control variable. Industry dummies are at the two-digit level. Human capital controls, firm effects and industry dummies all interacted with female dummy variable.
29 This technique has the advantage of using all observations in a single regression
instead of mechanically dividing the sample into sub-samples and introducing sample selection problems. See Vilhelmsson (2002) for informative description of the quantile regression method.
Employees at the top end of the wage distribution have greater remu-neration from firm profits than those at the bottom of the wage distribution. The coefficient for lagged average profits is equal to 0.037 at the 0.25 percentile of the 1991 wage distribution, increasing to 0.102 at the 0.75 percentile (for 1995, respective coefficients are 0.023 and 0.044).
The deviation in remuneration for female employees is also found to increase along the wage distribution. In 1991, female employees at the 0.75 percentile of the total wage distribution had 5 percentage points lower remuneration for firm profits on wages than comparable male employees compared to a 1-percentage point difference at the 0.25 percentile. In 1995, a 3-percentage point difference is noted at the 0.75 percentile and insignificant differences at the 0.25 percentile. In 1991, only small gender differences in the mean profit levels of employing firms are found at different points on the wage distribution.30 The 1995 data, however indicate that gender differences in the mean profit level of employing firms also increase at the top end of the wage distribution implying larger differences in rents, on average, between men and women at the 0.75 percentile of the wage distribution for this year.31
One untested hypothesis is that men and women are sorted into positions within firms that differ in terms of their possibility for rent extraction. Basic information on the occupational position of white-collar workers is available for the 1995 cross-section. Wage estimations, separately by gender, on these individuals indicate that those in leadership positions have larger rent extraction possibilities. See Table 4. This is especially true for the selection of female chief executives who have significantly larger coefficients for lagged firm profits in wage estimation than their male counterparts and female subordinates. It was however noted earlier that women in leadership positions, and especially female top executives, are employed in firms with significantly lower mean profit levels than their male counterparts. Gender differences in mean profit levels are also shown in Table 4 and are significant at the one percent level. It appears that the
30 The data for 1991 indicates that for wages below the 0.25 percentile, mean profits of
employing firms is equal to 0.30 (st. dev 0.43) for men and 0.28 (st. dev. 0.41) for women. For wages above the 0.75 percentiles, mean profits are equal to 0.46 (st. dev. 0.57) for men and 0.49 for women (st. dev. 0.61).
31 The data for 1995 indicates that for wages below the 0.25 percentile, mean profits of
employing firms is equal to 0.28 (st. dev 0.44) for men and 0.26 (st. dev. 0.43) for women. For wages above the 0.75 percentiles, mean profits are equal to 0.40 (st. dev. 0.60) for men and 0.32 for women (st. dev. 0.54).
Table 4: Leadership Positions, based on data for white-collar workers, 1995.
Dependent variable: log monthly wage. Separate estimation, by gender. Standard errors corrected for within group (firm) correlations. Due to small number of observations in some estimations, results should be interpreted with caution.
Leadership Positions Chief Executives1 Management Section Leaders Supervisors Female Employees Profit/Employee 0.046*** (0.027) 0.302* (0.126) 0.019 (0.085) 0.085** (0.042) 0.020 (0.018) Human Capital Yes Yes Yes Yes Yes
R2 0.43 0.48 0.42 0.31 0.21
No. of Obs. 917 34 124 338 240 Mean profit level 0.21 0.19 0.17 0.19 0.24
Male Employees Profit/Employee 0.033** (0.015) 0.124* (0.041) 0.048 (0.040) 0.066*** (0.040) 0.023 (0.017) Human Capital Yes Yes Yes Yes Yes
R2 0.40 0.24 0.29 0.25 0.09
No. of Obs. 8,247 348 1,425 1,895 3,460 Mean profit level 0.35 0.40 0.32 0.30 0.40
Notes: * indicates significance at one percent level, ** at five percent level and *** at
ten percent level.
1 F-test is significant only at the 10 percent level for estimation on sub sample of female
chief executives.
select group of women in top positions with large possibilities for rent extraction are also found in less profitable firms.32
5. Conclusions
This study finds significant differences in rent sharing between men and women in cross-section wage estimation for 1991 and 1995. Differing forms of sorting, by gender, into firms with varying capital intensity or into different industries, partially account for these differences. The elasticity of wages with respect to firm profits is estimated to be 30 – 65 percent lower for women than comparable male estimates. These gender differences are not explained by individual unemployment history or by gender composition at the establishment level.
Although rent sharing is found to generally increase for employees at the upper end of the wage distribution, gender differences in rent sharing also increase. Initial estimation on a small sample of white-collar workers in leadership positions, however, shows that rent extraction possibilities are greater, in general, for those in top positions. This is especially true for the small select group of female chief executives. These women are also found within, on average, less profitable firms implying that the elasticity of wages with respect to firm profits remains generally smaller for women than comparable male estimates.
Gender differences in rent sharing are found to explain no more than two percent of the gender wage gap. This is not unexpected as the difference between men and women is not in the mean profit levels of employing firms but in remuneration from firm profit. As an assessment of bargaining differences, one should note that the effect of firm profits on wages is only one possible measure of potential increments resulting from bargaining. As such, it is likely that the results underestimate true gender differences. A better measure of wage bargaining outcomes including for example fringe benefits, non-wage benefits and other incentive pay schemes may better mirror true gender differences in bargaining strength and its implications for the gender wage gap. Nonetheless, this study finds that gender
32 Wage regressions, by gender and industry, also indicate that women in more
profitable industries vary in terms of whether or not they have greater rent sharing than their male counterparts in these industries. Within the construction industry, women are found to have significantly greater coefficients for lagged firm profit while within the mineral extraction and agricultural industries the reverse is true. Within the largest employer, the manufacturing industry, women have significantly smaller coefficients for lagged firm profit.
differences in rent sharing, based on OLS regressions estimating the mean effect of explanatory characteristics on wages, do little to explain the gender wage gap in Sweden.
References
Abowd, J. M.; Kramarz, F. & Margolis, D. N. (1999), ”High-Wage Workers and High-Wage Firms.” Econometrica 67, March 1999: 251-333.
Abowd, J. M. & Lemieux, T. (1993), “The Effects of Product Market Competition on Collective Bargaining Agreements: The Case of Foreign Competition in Canada.” Quarterly Journal of Economics, 108, August 1993: 983-1014.
Arai, M. (2001), “Wages, Profits and Capital Intensity: Evidence from Matched Worker-Firm Data.” Forthcoming Journal of Labor Economics
and Working Papers in Economics 1999:3, Department of Economics, Stockholm University.
Arai, M. & Heyman, F. (2001), ”Wages, Profits and Individual Unemployment Risk: Evidence from Matched Worker-Firm Data.” FIEF Working Papers Series 2001: 172.
Blanchflower, D. G.; Oswald, A. J. & Sanfey, P. (1996), “Wages, Profits, and Rent-Sharing.” Quarterly Journal of Economics 111, February 1996: 227-252.
Christofides, L. N. & Oswald, A. J. (1992), “Real Wage Determination and Rent-Sharing in Collective Bargaining Agreements.” Quarterly Journal of Economics 107, August 1992: 985-1002.
Forslund, A. (1994), “Wage setting at the Firm Level – Insider Versus Outsider Forces.” Oxford Economic Papers 45, 1994: 245-261.
Hildreth, A. D. G. & Oswald, A. J. (1997), “Rent-Sharing and Wages: Evidence from Company and Establishment Panels.” Journal of Labor Economics 15, April 1997: 318-337.
Holden, S. (1998), “Wage Drift and the Relevance of Centralised Wage Setting.” Scandinavian Journal of Economics, Vol. 100, No. 4, 1998: 711-732.
Holmlund, B. & Skedinger, P. (1990), ”Wage Bargaining and Wage Drift: Evidence from the Swedish Wood Industry.” in Lars Calmfors (ed.),
Wage Formation and Macroeconomic Policy in the Nordic Countries, SNS-Förlag and Oxford University Press, 1990.
Holmlund, B. & Zetterberg, J. (1991), “Insider Effects in Wage Determination.” European Economic Review 35, July 1991: 1009-1034. Johansson, M.; Katz, K. & Nyman, H. (2001), ”Wage Differentials and
Gender Discrimination – Changes in Sweden 1981-1998.” Working Papers in Economics 2001:15, Department of Economics, Stockholm University.
Katz, L. F. & Summers, L. H. (1989), “Industry Rents: Evidence and Implications.” Brooking Papers on Economic Activity (Microeconomics),
1989: 209-275.
Margolis, D. N. & Salvanes, K. G. (2001), ”Do Firms Really Share Rents With Their Workers?” CNRS TEAM Working papers 2001:26.
Moulton, B. R. (1990), “An Illustration of a Pitfall in Estimating the Effects of Aggregate Variables on Micro Units.” Review of Economics and Statistics 74, May 1990: 334-338.
Nickell, S. J.; Vainiomaki, J. & Wadhwani, S. (1994), ”Wages and Product Market Power.” Economica 61, November 1994: 457-473.
Oaxaca, R. L. (1973), “Male-female wage differentials in urban labor markets.” International Economic Review 9: 693-709.
Oaxaca, R. L. & Ransom, M. R. (1994), “On discrimination and the decomposition of wage differentials.” Journal of Econometrics 61, 1994: 5-21.
Reilly, K. T. & Wirjanto, T. S. (1999), ”Does more mean less? The male/female wage gap and the proportion of females at the establishment level.” Canadian Journal of Economics, Vol. 32, No. 4, August 1999: 906-929.
Rycx, F. (2002), “Rent-sharing and the Gender Wage Gap. Evidence from Belgian Matched Employer-Employee Data.” Mimeo, Department of Applied Economics (DULBEA), Université Libre de Bruxelles.
Sap, J. (1993), “Bargaining Power and Wages. A game-theoretic model of gender differences in union wage bargaining.” Labour Economics 1, 1993: 25-48.
Shapiro, C. & Stiglitz, J. E. (1984), “Equilibrium Unemployment as a Worker Discipline Device.” The American Economic Review, Vol. 74, nr. 3, June 1984: 433-444.
Vilhelmsson, R. (2002), “The Immigrant –Native Wage Gap in Sweden: Is there a Difference Between the Top and the Bottom of the Wage Distribution?” Mimeo, Swedish Institute for Social Research (SOFI), Stockholm University.
Appendix:
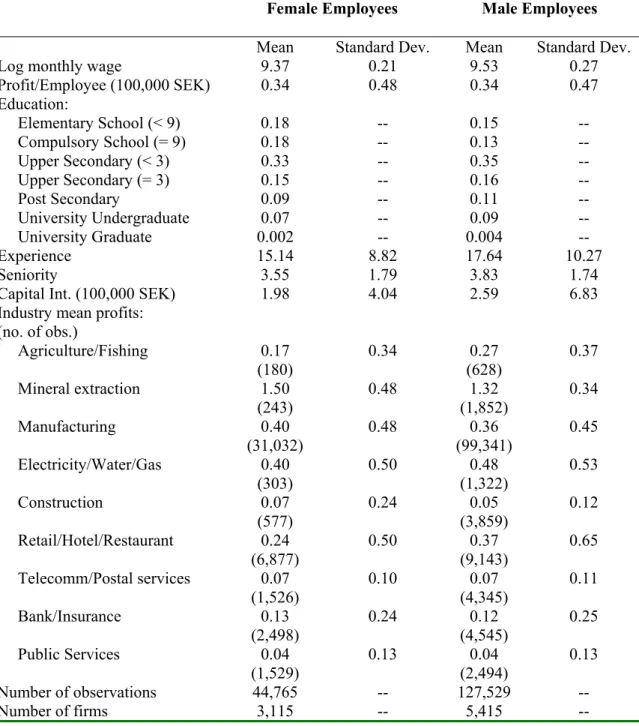
Table A1: Sample Means, 1991
Female Employees Male Employees
Mean Standard Dev. Mean Standard Dev. Log monthly wage 9.37 0.21 9.53 0.27 Profit/Employee (100,000 SEK) 0.34 0.48 0.34 0.47 Education: Elementary School (< 9) 0.18 -- 0.15 -- Compulsory School (= 9) 0.18 -- 0.13 -- Upper Secondary (< 3) 0.33 -- 0.35 -- Upper Secondary (= 3) 0.15 -- 0.16 -- Post Secondary 0.09 -- 0.11 -- University Undergraduate 0.07 -- 0.09 -- University Graduate 0.002 -- 0.004 -- Experience 15.14 8.82 17.64 10.27 Seniority 3.55 1.79 3.83 1.74
Capital Int. (100,000 SEK) 1.98 4.04 2.59 6.83 Industry mean profits:
(no. of obs.) Agriculture/Fishing 0.17 (180) 0.34 0.27 (628) 0.37 Mineral extraction 1.50 (243) 0.48 1.32 (1,852) 0.34 Manufacturing 0.40 (31,032) 0.48 0.36 (99,341) 0.45 Electricity/Water/Gas 0.40 (303) 0.50 0.48 (1,322) 0.53 Construction 0.07 (577) 0.24 0.05 (3,859) 0.12 Retail/Hotel/Restaurant 0.24 (6,877) 0.50 0.37 (9,143) 0.65 Telecomm/Postal services 0.07 (1,526) 0.10 0.07 (4,345) 0.11 Bank/Insurance 0.13 (2,498) 0.24 0.12 (4,545) 0.25 Public Services 0.04 (1,529) 0.13 0.04 (2,494) 0.13 Number of observations 44,765 -- 127,529 -- Number of firms 3,115 -- 5,415 --
Note: Profit and capital measures in SEK 1990 prices.
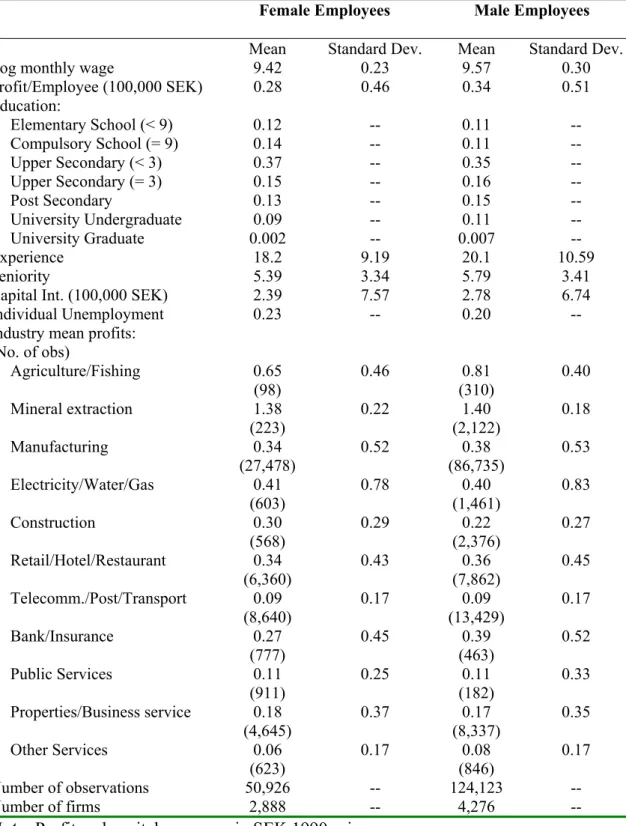
Table A2: Sample Means, 1995
Female Employees Male Employees
Mean Standard Dev. Mean Standard Dev. Log monthly wage 9.42 0.23 9.57 0.30 Profit/Employee (100,000 SEK) 0.28 0.46 0.34 0.51 Education: Elementary School (< 9) 0.12 -- 0.11 -- Compulsory School (= 9) 0.14 -- 0.11 -- Upper Secondary (< 3) 0.37 -- 0.35 -- Upper Secondary (= 3) 0.15 -- 0.16 -- Post Secondary 0.13 -- 0.15 -- University Undergraduate 0.09 -- 0.11 -- University Graduate 0.002 -- 0.007 -- Experience 18.2 9.19 20.1 10.59 Seniority 5.39 3.34 5.79 3.41
Capital Int. (100,000 SEK) 2.39 7.57 2.78 6.74 Individual Unemployment 0.23 -- 0.20 -- Industry mean profits:
(No. of obs) Agriculture/Fishing 0.65 (98) 0.46 0.81 (310) 0.40 Mineral extraction 1.38 (223) 0.22 1.40 (2,122) 0.18 Manufacturing 0.34 (27,478) 0.52 0.38 (86,735) 0.53 Electricity/Water/Gas 0.41 (603) 0.78 0.40 (1,461) 0.83 Construction 0.30 (568) 0.29 0.22 (2,376) 0.27 Retail/Hotel/Restaurant 0.34 (6,360) 0.43 0.36 (7,862) 0.45 Telecomm./Post/Transport 0.09 (8,640) 0.17 0.09 (13,429) 0.17 Bank/Insurance 0.27 (777) 0.45 0.39 (463) 0.52 Public Services 0.11 (911) 0.25 0.11 (182) 0.33 Properties/Business service 0.18 (4,645) 0.37 0.17 (8,337) 0.35 Other Services 0.06 (623) 0.17 0.08 (846) 0.17 Number of observations 50,926 -- 124,123 -- Number of firms 2,888 -- 4,276 --
Note: Profit and capital measures in SEK 1990 prices.
Table A3: Decomposition of Male/Female Log Wage Differential Assumed Non-Discriminatory Wage Structure Explained (contribution of differences in means to gap) Unexplained (contribution of difference in coefficients to gap) Male
Advantage1 DisadvantageFemale 2 1991
Unadjusted log wage differential 1991: 0.1546 All variables: Pooled 0.0694* (0.0009) 0.0852* (0.0012) 0.0224* (0.0006) 0.0628* (0.0008) Male 0.0305* (0.0009) 0.1242* (0.0011) -- -- Female 0.0490* (0.0006) 0.1056* (0.0012) -- -- Firm profits: Pooled 0.0008* (0.0002) 0.1539* (0.0014) 0.0400* (0.0008) 0.1139* (0.0010) Male 0.0008* (0.0002) 0.1538* (0.0014) -- -- Female 0.0006* (0.0002) 0.1541* (0.0014) -- -- 1995
Gross log wage differential 1995: 0.1556 All variables: Pooled 0.0619* (0.0009) 0.0937* (0.0012) 0.0096* (0.0007) 0.0841* (0.0009) Male 0.0151* (0.0010) 0.1405* (0.0012) -- -- Female 0.0441* (0.0007) 0.1114* (0.0012) -- -- Firm profits: Pooled 0.0034* (0.0001) 0.1522* (0.0015) 0.0443* (0.0009) 0.1079* (0.0010) Male 0.0031* (0.0001) 0.1525* (0.0010) -- -- Female 0.0021* (0.0001) 0.1535* (0.0015) -- --
Notes: * indicates significance at the 1 percent level. Estimations include controls for human capital and industry affiliation.
1 Contribution of the difference between the observed male coefficients and the pooled
coefficients to the unadjusted gap in log wages for all characteristics.
2 Contribution of the difference between the pooled coefficients and the observed female
coefficients to the unadjusted gap in log wages for all characteristics.
Definition of
v
ariables:
Wages: Monthly pre-tax full-time equivalent wages in 1990 prices. Wage data comes from the Swedish Trade Union Confederation (LO), The Swedish Employers’ Confederation (SAF) and from the Income and Asset Register (Inkomst och förmögenhetsregistret) of Statistics Sweden (SCB).
Profit per Employee: Firm profits defined as annual profit after capital depreciation per employee in 1990 prices and calculated as lagged four-year averages. Information based on balance-sheet data from MM Partners. In estimation, firms with less than three observations or less than two employees were removed as well as those with average profits per employee below the first percentile and above the 99 percentile. Data on employees are from MM Partners.
Education: Seven level dummy variables based on the two-digit level of the Swedish Education Nomenclature (SUN code) from the Swedish Education Register. These are elementary school (less than 9 years), compulsory school (9 years), upper secondary (less than 3 years), upper secondary (3 years), post secondary school (less than 3 years), university undergraduate studies (3 years or more, not including graduate studies) and university graduate studies.
Experience: Number of years in the labor market based on the Employment Register (Sysselsättningsregistret) of Statistics Sweden (SCB).
Seniority: Two level dummy variables for 1991 and three level dummy variable for 1995, indicating number of years at the establishment. These are low seniority (less than 3 years), medium seniority (3.5 – 5.5 years) and high seniority (more than 5.5 years). Data based on tracing individuals back to 1986 in the Employment Register.
Individual Unemployment: Dummy variable equal to one if individual is registered as unemployed during any year from 1992 to 1995. Information comes from the National Labor Market Board’s Event Database (AMS Händelsedatabas).
Gender: Information comes from Statistics Sweden (SCB) Population Census (Registret över totalbefolkningen).
Capital Intensity: Capital to labor ratio based on balance-sheet data from MM Partners. Capital defined as value of ‘machine’ assets per employee in 1990 prices, averaged over preceding four year period.
Proportion Female: Proportion female employees per establishment. Calculated from Swedish Establishment Survey (APU).
Industry: Own classification of 9 industries in 1991 and 11 industries in 1995, based on the 2-digit SIC (SNI69 and SNI92).
Working Paper Series/Arbetsrapport
FIEF Working Paper Series was initiated in 1985. A complete list is available from FIEF upon request.
Information about the series is also available at our website: http://www.fief.se/Publications/WP.html.
2000
158. Antelius, Jesper, “Sheepskin Effects in the Returns to Education: Evidence on Swedish Data”, 17 pp.
159. Erixon, Lennart, “The ‘Third Way’ Revisited. A Revaluation of the Swedish Model in the Light of Modern Economics”, 97 pp.
160. Lundborg, Per, “Taxes, Risk Aversion and Unemployment Insurance as Causes for Wage
Rigidity”, 16 pp.
161. Antelius, Jesper and Lundberg, Lars, “Competition, Market Structure and Job Turnover”, 27 pp.
162. Johansson, Sten och Sélen, Jan, ”Arbetslöshetsförsäkringen och arbetslösheten – En reanalys av IFAUs studie”, 46 s.
163. Edin, Per-Anders, Fredriksson, Peter and Lundborg, Per, ”Trade, Earnings, and Mobility – Swedish Evidence”, 28 pp.
164. Strauss, Tove, “Economic Reforms and the Poor”, 25 pp.
165. Strauss, Tove, “Structural Reforms, Uncertainty, and Private Investment”, 31 pp.
2001
166. Hansson, Pär, “Skill Upgrading and Production Transfer within Swedish Multinationals in the 1990s”, 27 pp.
167. Arai, Mahmood and Skogman Thoursie, Peter, “Incentives and Selection in Cyclical Absenteeism”, 15 pp.
168. Hansen, Sten and Persson, Joakim, “Direkta undanträngningseffekter av
arbetsmarknadspolitiska åtgärder”, 27 pp.
169. Arai, Mahmood and Vilhelmsson, Roger, ”Immigrants’ and Natives’ Unemployment-risk: Productivity Differentials or Discrimination?”, 27 pp.
170. Johansson, Sten och Selén, Jan, ”Arbetslöshetsförsäkringen och arbetslösheten (2). Reformeffekt vid 1993 års sänkning av ersättningsgraden i arbetslöshetsförsäkringen?”, 39 pp.
171. Johansson, Sten, ”Conceptualizing and Measuring Quality of Life for National Policy”, 18 pp.
172. Arai, Mahmood and Heyman, Fredrik, “Wages, Profits and Individual Unemployment Risk: Evidence from Matched Worker-Firm Data”, 27 pp.
173. Lundborg, Per and Sacklén, Hans, “Is There a Long Run Unemployment- Inflation Trade-off in Sweden?”, 29 pp.
174. Alexius, Annika and Carlsson, Mikael, “Measures of Technology and the Business Cycle: Evidence from Sweden and the U.S.”, 47 pp.
175. Alexius, Annika, “How to Beat the Random Walk”, 21 pp.
2002
176. Gustavsson, Patrik, “The Dynamics of European Industrial Structure”, 41 pp.
177. Selén, Jan, “Taxable Income Responses to Tax Changes – A Panel Analysis of the 1990/91 Swedish Reform”, 30 pp.
178. Eriksson, Clas and Persson, Joakim, “Economic Growth, Inequality, Democratization, and the Environment”, 21 pp.
179. Granqvist, Lena, Selén, Jan and Ståhlberg, Ann-Charlotte, “Mandatory Earnings-Related Insurance Rights, Human Capital and the Gender Earnings Gap in Sweden”, 21 pp. 180. Larsson, Anna, “The Swedish Real Exchange Rate under Different Currency Regimes”, 22 pp.
181. Heyman, Fredrik, “Wage Dispersion and Job Turnover: Evidence from Sweden”, 28 pp. 182. Nekby, Lena, “Gender Differences in Rent Sharing and its Implications for the Gender Wage Gap”, 22 pp.