MPRA
Munich Personal RePEc Archive
Do Democracies Have Higher Current
Account Deficits?
Antonis Adam and Sofia Tsarsitalidou
University of Ioannina, Department of Economics, University of
Ioannina, Department of Economics
25 January 2017
Online at
https://mpra.ub.uni-muenchen.de/76400/
Antonis Adam, Soa Tsarsitalidou
aDepartment of Economics, University of Ioannina, PO Box 1180, Ioannina 45110, Greece.
Abstract
In this paper we argue that democracies tend to run (larger)current account decits than autocracies. Our argument is based on the dierent incentives faced by democratic and autocratic leaders. The main theoretical hypothesis are tested on a dataset that consists of 121 countries over the period 1980-2012, using ve year averages and a xed eects panel data model. The empirical ndings suggest that autocracies run lower current account decits than democracies. Special focus is given in the issue of endogeneity by estimating an IV Fixed Eects model, using as instruments of Democracy the share of Christian adherents in each country and also the level of democracy in neighboring countries. These results are found to be robust across alternative empirical specications.
Keywords: Current Account, Democracy, Autocracy
Email addresses: [email protected] (Antonis Adam), [email protected] (Soa Tsarsitalidou ) Acknowledgements: We would like to thank Thomas Moutos and Nikos Mylonides for valuable sug-gestions and discussions. We have also beneted from comments by Thanasis Stengos, Fabio Antoniou, Thanasis Lapatinas, Michael Chletsos, Stamatia Ftergioti, George Tridimas as well as from participants at the 4th confenence on Applied Economics (University of Thessaly), the 2016 IMAEF Conference and also from seminar participants at the University of Ioannina. Any remaining errors are ours.
1. Introduction
There is a huge literature analyzing the determinants of current account imbalances (Chinn and Prasad,2003; Chinn and Ito, 2007; Imam, 2007; Endegnanew et al., 2012; Gru-ber and Kamin, 2005 etc). Most of these studies nd that economic factors such as the net foreign asset position, the budget balance, the real eective exchange rate and the economic openness of the country aect the current account position. This literature however seems to ignore the political institutions that may shape the external balance of the economy. In the present paper we try to examine these forces, by establishing a link between current account decits and the political regime type. Specically we argue and empirically establish a relationship between the level of democracy and the current account decit and show that more autocratic regimes deliver lower current account decits than do democratic ones.
The eect of democracy on the external sector of the economy, has been a subject of research for a number of papers. For example Harms and Ursprung (2002), Adam and Filippaios (2007) and others, examine the eect of democracy on the ow of Foreign Direct Investments. The general nding is that democracy increases FDI as long as FDI are not targeted towards the extraction of natural resources (Asiedu and Lien, 2011). Similarly there is a vast literature which examines the eect of democracy on trade. For example Milner and Kubota (2005) and O'Rourke and Taylor (2006) nd that democratization results into more liberal trade policies in countries where workers stand to gain from free trade. On the other hand Yu (2010), using a gravity model of trade nd that democracy increases exports as it improves the quality of the exportables. This eect might dominate the negative eect of democracy on trade policies and overall it may be the case that democracy increases trade ows. The present paper is related to this literature, however it examines the eect of the political regime on the current account balance instead of focusing on just one of its components. To our knowledge this is the rst paper that examines this relationship.
that it will also aect the overall current account position. In Section 2 we justify theoret-ically our empirical model and derive our main testable hypothesis, i.e. that democracies tend to run (larger) current account decits. Our arguments are as follows: Firstly, follow-ing Anderson(1988), we expect that dictators are immune from public pressures relatively to democratically elected politicians. Therefore they are more able to temporary increase taxes or reduce the government expenditures without facing severe opposition by the gen-eral public. This implies that current account consolidations are more easily achieved in an autocratic environment. Secondly, as autocracies tend to be less safe for foreign investment the supply of foreign capital will tend to be lower. And even when there is high capital inow this can be rather threatening for the survival of the regime (Kalyvitis and Vlachaki, 2012): increased holdings of capital by foreigners will result into pressures on the dictator for democratization. Consequently, dictators that fear such foreign pressures will try to use policies that keep the current account balanced in order to decrease the reliance on net for-eign assets. Finally, following Rodrik (1999) we expect democracies to pay higher wages than autocracies. This results into a real eective exchange rate appreciation and consequently higher current account decits.
In order to examine empirically the above theoretical hypotheses and to establish a causal relationship between democracy and the current account balance we estimate a Fixed Eects panel model. Our sample consists of 121 countries over the period 1980-2012. All variables are expressed as ve year averages in order to eliminate the eect of short run uctuations, and examine the long run causal eects of the political regime. The dependent variable is the current account balance as percent of GDP and the rest of the explanatory variables are similar to Chinn and Prassad (2003). The main proxy of democracy is the Polity IV index of democracy, which provides the coding of the authority characteristics of states around the world and calculates various measures of how a country is governed from 1800 (or the year that the state gained its independence) onwards. To examine the robustness of our results
we also employ the Freedom House index of democracy, which provides an index of the civil and political freedoms allowed by the political regime. Our main nding is that autocracies run lower current account decits than democracies.
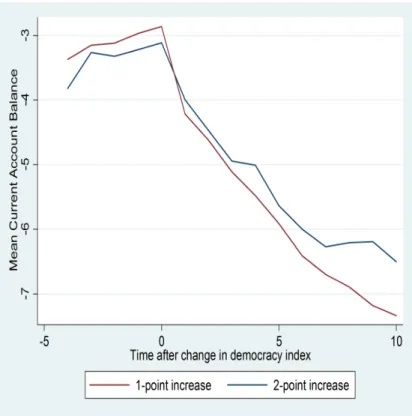
To get a rst insight about the relationship between current account decits and democ-racy, we present Figure 1. This gure depicts the dynamics of the current account balance after an one (blue line) or two point (red line) increase in the Polity IV index. The gure indicates that after an increase in the level of democracy at time zero, there is an associated decline on the average, across countries, current account balance for up to ten years onwards. Even though the results of this graph are suggestive about an important negative eect of democracy on the current account balance, they do not capture the eect of other macroe-conomic variables, or country specic xed eects. Moreover the gure shows that the long run eect of a change in democracy is much larger than the short run one. For these reasons our empirical results rely on a Fixed Eects panel model on ve year averages.
To further strengthen our results, we also provide a series of robustness checks in order to verify that the empirical results are robust to the country sample employed and the estimation method. As we are interested in the causal relationship between democracy and the current account balance we also perform an instrumental variable analysis so as to eliminate the existence of possible endogeneity. We use two instruments. Our rst instrument is the share of Christian adherents in each country; according to Huntington (1993) Christianity played a key role on the democratization process during the previous years. This correlation is evident from just the simple correlation of the instrument with democracy (almost 50%). At the same time our data reveal a virtually zero correlation with the current account balance (correlation coecient 0.001). Moreover following Persson and Tabellini (2009) we use the average weighted democracy index of each country's neighbors. Following the literature we expect a positive association between the Polity score of a country with its neighbors. This is consistent with the democratization waves theory of Huntington (1993) and the regional
Figure 1: The eect of a change in democracy on the Current Account Balance
clusters of democracy and autocracy observed by Persson and Tabellini (2009).
The Instrumental Variables analysis veries the negative relationship between Democracy and Current Account balance while in the rst stage we nd a positive relationship between Christianity, Regioanl Democracy and the Polity variable. At the same time all relevant test indicate that our instruments are valid. Furthermore a standard Durbin- Wu- Hausman test indicates weak evidence against the exogeneity of the democracy variable. We can therefore conclude that our results are robust. Finally, in the robustness section we perform a number of additional tests, which verify the theoretical channels through which democracy aect the current account balance.
The rest of the paper is structured as follows: in Section 2 we elaborate on our hypothesis that more autocratic regimes face lower current account decits relatively to more democratic. In Section 3 we introduce the empirical methodology and the data. In Section 4 we present
our empirical results. In Section 5 we present the results of the instrumental variable analysis. Section 6 concludes.
2. Theoretical Framework
In this section we try to explore the channel via which democracy aects the current account balance. We also explain why autocracies tend to run lower current account decits relatively to democracies.
According to Anderson(1989) autocracies are less sensitive to public pressures relative to democratic elected governments. Therefore they are more likely to follow unpopular policies compared to their democratic counterparts. Following the literature on the economics of dictatorship (e.g. Wintrobe, 1998, Acemoglu and Robinson, 2005) we conceive the dictator to be maximizing a weighted social utility function which places more weight to an elite. In contrast a democratic elected government, wishes to be re- elected and thus places more weight on the wishes of the majority of the population (Acemoglu and Robinson , 2005). The underlying mechanism behind this eect stems from the fact that the cost of overthrowing a government in a democracy is lower than the associated cost in an autocracy, as the cost of voting is lower than the cost of a revolution. 2 Therefore democratic governments face
more constraints in their choice of policies. Similarly Brough and Kimenyi (1986), argue that the time horizon of a typical dictator is longer than that of a democratically elected politician. These eects have been veried in the empirical literature. For example Aidt and Jensen (2013) show that democratization leads to higher public spending. Similarly, Amin and Djankov (2014) show that authoritarian regimes may undertake reforms that are painful as they do not worry about the public opinion. This is consistent also with some
2This rests on the collective action problem introduced by Olson (1965) and extended by Tullock (1971)
which applies it in revolution activities. If someone takes part in a revolution he faces a direct cost of eort. He also faces two indirect costs. The rst one is the danger of taking part in illegal activities and the second is an opportunity cost as he does not work and takes part in the revolution (Acemoglu and Robinson, 2006).
historical accounts, as the case of the Ceausescu regime in 1985 Romania- where strong austerity measures were introduced in order to fully repay all external debt.3
The above imply that dictators can more easily impose the strict scal measures that a current consolidation requires. And even when currency depreciations are required in order to correct current account decits, democratically elected governments also face huge losses in political support. According to Frankel (2005) , large currency depreciations are associated with loss of support to the government, and higher probability of losing the elections.
What this discussion reveals is the tendency of the democratically elected governments to avoid large current account consolidations and delay them until after the elections, or after a new party comes into power ( Alesina and Drazen, 1991). In contrast there are no such motives for dictators: they can easily impose scal measures or allow a large currency depreciation. Therefore, current account imbalances are not expected to exist for a large period of time in autocracies, as they are corrected more easily than in democracies. In other words we expect democracies to run larger current account decits than dictatorships.
And even though dictators can more easily correct current account imbalances, they have also more to fear from foreign indebtedness, either in the form of holdings of government bonds or more importantly foreign investment in the home economy. The accumulation of foreign assets leads to increased political power of the foreigners which hold these assets (see Kalyvitis and Vlachaki, 2011). Since typically democracies pressure autocracies in order to democratize (Levitsky and Way,2010), dictators will not fare well with this increase in foreign power within the country. And as long as they can correct external imbalances either through scal measures or currency depreciation, they would refrain from large and
3These measures included for example the full exporting of all Romania's agricultural goods, which of
course led to huge decline in the standard of living of the whole population (Mungiu-Pippidi, 2001). In our sample the average current account balance over GDP for Romania before democratization run on 1.61%, implying a non negligible current account surplus. After the fall of communism and the democratization of the country the respective number to -6.12%. Even if we take the years after 2000, when democracy appears more consolidated, the average current account decit in Romania is 1.41% of GDP.
extended current account imbalances which eventually lead to increases in foreign debt. But even if dictators have nothing to fear from the accumulation of foreign assets, it can be the case that sovereign lending markets imperfections may prevent domestic borrowing. In this case it is no the decision of the dictator not accumulate foreign debt, but the lower creditworthiness that constraints dictatorships from borrowing. Democracies tend to exhibit higher stability (see e.g. Feng , 1997 ), better protect property rights (see e.g.; Roe and Siegel, 2008 Acemoglu et al. [2]) and have more developed nanacial markets (e.g. Bhattacharyy, 1993). Democracies then are a safer place for foreign investment than dictatorships and are more able to attract foreign capital. For example, many foreigners want to invest in the United States, both in private capital markets and by buying government bonds, because they are safer than investing where property rights are poorly protected. In all cases the end result is the same, i.e. dictatorships will run lower current account decits.
The above argument can be related to a long standing hypothesis that globalization promotes the diusion of democratic ideas (Shumpeter,1950; Lipset, 1959; Kant, 1975 ; Hayek 1978). Recent evidence verify this relationship between openness and democracy, especially during the third wave of democratization (Papaioannou and Siourounis, 2008). According to this view, free trade and capital ows raise incomes and economic development, which in eect foster democratization by enhancing the eciency of the resource allocation. Therefore there are reasons to expect that autocratic regimes will favor restrictions to trade and capital ows and lower exposure to the global markets.
Finally, Rodrik (1999) has shown that typically democracies pay higher wages than non-democracies. This occurs as in democracies, the bargaining power of workers is higher rel-atively to the associated bargaining power in autocracies. As a consequence, the prices of domestically produced products in democratic countries are higher resulting into a real eec-tive exchange rate appreciation. This ultimately suggest that ceteris paribus it is expected that democracies will tend to have larger trade decits.
All the above arguments point to the same theoretical hypothesis to be tested in the empirical section, i.e. democracies run higher current account decits than autocracies. The sections that follow establish that this is indeed the case.
3. Data
Our sample consists of 121 countries over the 1980- 2012 period. All variables are ex-pressed in ve year averages in order to eliminate the eect of short run uctuations. This sample of 121 countries, include all countries for which data are available, excluding coun-tries with an average (over the whole period) population of less than 2 million. According to Endegnanew et al. (2012), micro-states display large changes in their current account balance which are not related to changes in economic policy but to the external environment, and thus their current account is aected by other variables than larger countries.
Our dependent variable is current account balance as percent of GDP (cabi,t), as taken
from the IMF's World Economic Outlook database.4
Our main variable of interest is the Democracy variable which captures the level of
democracy in each country. This variable is taken from the Polity IV database. The Polity democracy index focuses on the institutional structure of the political regime. The variable
Democracy takes values from -10 to 10. A score ofDemocracy equal to -10 (+10) indicates
a strongly autocratic (democratic) state. According to Polity IV, a democratic state has three essential characteristics. First, the political participation is fully competitive; second, institutionalized constraints on executive power are present; and third, civil liberties are secured. In contrast, an absence of these three characteristics typies an autocratic country. According to our theoretical priors set in the previous section, we expect the sign of this variable to be negative as we believe that more democratic countries tend to have higher current account decits. To verify that our results are not driven by the choice of the
democracy index, we examine the robustness of our results when we use the the Gastil democracy index (Freedom House, 2015). The dierence between the Polity and the Freedom House indices is that the latter places more emphasis on the political and civil liberties and, therefore, it denes democracy in a rather non-minimalist way.
To correctly specify our model we use a series of control variables consistent with the relevant literature (Chinn and Prassad 2003; Gruber and Kamin 2005; Chinn and Ito, 2007 ; Imam 2007 ;Endegnanew et al., 2012)
First of all, we use as proxy for the scal balance theCyclically Adjusted Budget Balance.To
this end we take the component of the Expenditure and Revenues (as percent of GDP) which are not explained by the growth rate of the economy or a time trend. These data are ob-tained from IMF's, World Economic Outlook. Then, our variable is dened as the ratio of the Change in Cyclically Adjusted Revenue (percent of GDP) minus the Change in the Cyclically Adjusted Expenditure (percent of GDP). According to Endegnanew et al.(2012) cyclical adjusted values are included in order to eliminate the common reaction to the busi-ness cycle. Following the twin decits hypothesis we expect the sign of this variable to be positive.
As theN et F oreign Asset position is the accumulation of past current account balances,
we expect this variable to aect the current account position (Gruber and Kamin,2005), even though the sign of the variable is a- priori ambiguous. Economies with high Net Foreign Assets can aord to run trade decits longer which leads to lower current account balances. On the other hand, a positive relationship may exist as higher Net Foreign Assets lead to higher net income ows (Imam, 2008). The variable is expressed as a share of GDP and is taken from the World Bank.
Following Masson et al.(1998), and according to the standard life cycle model of savings, we expect an increase in the share of the youth and elderly population dependency ratio to lead to a ceteris paribus decrease on private savings. Therefore we use theDependency Ratio
which is the proportion of the population less than 18 years old plus population aged above 65 to total population. So we expect the sign of this variable to be negative as a reduction in private saving reduces the current account balance.
As oil-exporting countries generally run large current account surpluses and accumu-late foreign assets during the extractive stage in order to smooth consumption once the non-renewable resources have been exhausted (Adam and Moutos, 2015), we introduce the variable Oil Rents which measures the dierence between the value of crude oil production
at world prices and the total costs of production as a share of GDP. We expect the sign to be positive.5 Following Chinn and Prasad(2003), we use the variableOpenness to T rade, dened
as imports plus exports over GDP. This variable captures the fact that more open economies have the capacity to service external debt. This happens as they can easily generate foreign exchange earnings through exports. This leads to a higher current account balance. So we expect the sign of this variable to be positive. The last three variables are taken from World Bank's World Development Indicators Database.
We also use a proxy for nancial development by using the variableP rivate Credit as
% of GDP (also taken by World Bank's World Development Indicators Database ) as a deviation of the world's average, as in Chinn and Ito (2007). The expected sign of this variable depends on whether the saving glut or the nancial deepening hypothesis holds.
6 A positive relationship between private credit and the current account balance implies that
the nancial deepening hypothesis is correct. This happens as higher nancial deepening, in the form of increased provision of nancial services or increased money supply, induces
5Since we foundOil Rentsto be highly correlated withDemocracy, we made the two variables orthogonal
by regressingDemocracyon the share of Oil Rents to GDP and use the residuals as the variableOil Rents.(For the relationship between Oil endowments and dictatorship see also Crespo et al. (2011).
6According to Chinn and Ito (2007) A global saving glut argument views excess saving from Asian
emerging market countries, driven by rising saving and collapsing investment in the aftermath of the nancial crisis (and to a lesser extent Europe), as the cause of the U.S. current account decit... (Chinn and Ito, 2007, page 248).The nancial deepening hypothesis on the other hand suggests that nancial development leads to higher investment and thus lower current account decit.
higher saving which eventually lead to current account surpluses. On the other hand a negative relationship implies that the saving glut hypothesis, which states that current account imbalances are the outcome of excessive surpluses from oil exporting countries or savings from emerging market countries in the aftermath of nancial crises, holds (Chinn and Ito, 2007).
To control for changes in the price competitiveness vis-à-vis the rest of the world, we use the logarithm of the Real Ef f ective Exchange Rate (as in Endegnanew et al.,2012). The
sign of this variable is expected to be negative, as an increase in the real eective exchange rate implies a real depreciation which is expected to improve external balance. Similarly we include the Real Ef f ective Exchange RateV olatility , which is the 5- year standard
deviation in the Real Ef f ective Exchange Rate. Higher volatility might lead agents to save
more for precautionary reasons and also might lead economies to experience low investment. So we expect a negative relationship between real eective exchange rate volatility and current account balance. The real eective exchange rate data are taken from Darvas(2012).
To take into account the level of development of each country we use the Relative Real GDP per capita of each country to the Average World real GDP per capita(Relative Income).
Standard neoclassical theory suggests that as long as capital is expected to ow from rich to poor countries, there must be a positive association between the current account balance and the relative income. However according to the stages of development hypothesis countries that move from a low to an intermediate level of development import capital and run current account decits. Then after reaching a threshold level of development they become net capital exporters, and run current account surpluses (Chinn and Ito, 2007). According to this view we can expect a U shaped relationship- or even a negative relationship- between
cabi,tand relative income.7 Similarly, we include theGrowth Rateof the real GDP per capita
7In the tables that follow we present the results of a linear eect of relative income on cab
i,t. We have
estimated the same model with a squared term and found that the non- linear eect turned out statistically insignicant. As this does not aect our main results we opted for a linear specication regarding the relative
as we believe that higher growth rates may result into expectations for higher future income, which in turn raises current consumption and thus leads to a reduction to the current account balance.
Finally we proxy for nancial openness using the variable constructed by Chinn and Prassad (2001), which measures F inancial Openness. Lower capital openness can have two
opposite eects: limited access to international capital may lead to lower current account decits. On the other hand however, restrictions to the ow of capital would reect attempts to stave o the consequences of a legacy of chronic current decits. The variable is taken from Chinn and Ito (2015)
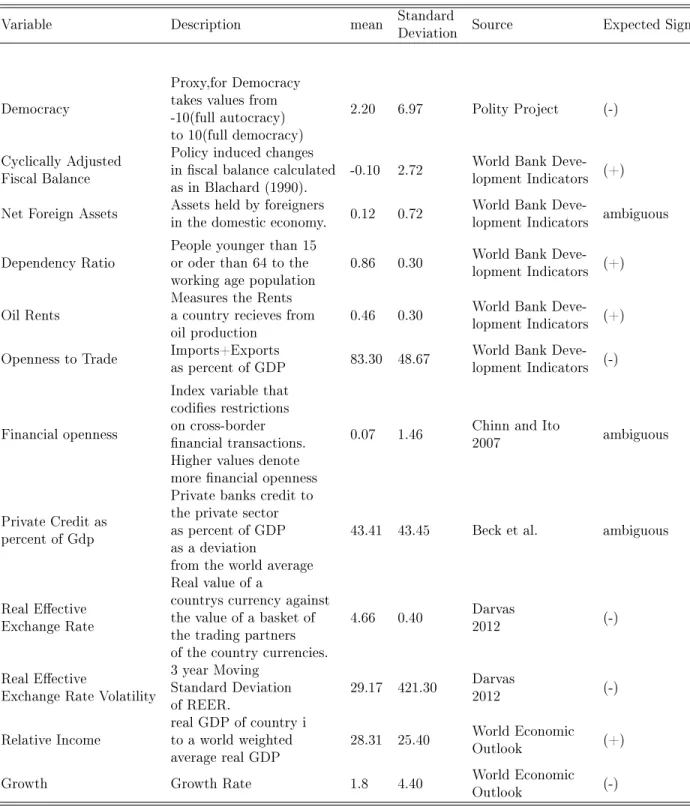
Table 1 presents the analytical description of our data, data sources, the summary statis-tics and also expected signs of all of our variables.
[Insert table 1 here]
The baseline specication used to study the relationship between current account balance and the political regime has the following form:
cabi,t =aconstant+ai+λt+b1polityi,t+b2nf ai,t+b3cyclbbi,t+b4dependencyi,t+b5growthi,t+
b6oilrentsi,t+b7opennessi,t+b8pcrediti,t+b9reervoli,t+b10reeri,t+b11incomei,t+b12kaopeni,t+
ui,t (1)
where,cab is the current account balance of country i at time t,polity is the democracy
measure, nf a is the net foreign assets position, dependency is the dependency ratio,growth
is the growth rate, openness is the openness to trade, oilrents is the amount of oil rents, pcredit is the private credit as percent of GDP, reervol is the real eective exchange rate
volatility, reer is the log of real eective exchange rate, income is the relative income and kaopen is the nancial openness.The terms aiand λtdenote the country xed eects and the
time xed eects respectively. So as to be sure that we estimated the correct model, we income variable.
also estimate a random eects model and apply a standard Hausman test which showed that the correct specication is the Fixed Eects model.8 We also test whether the time eects
are signicant by an F test and nd that the best model is with the one with time eects. Therefore our baseline model is a Fixed Eects with country and time eects. Finally as our interest lies more of the medium to long run determinants of current account balances,we estimate the model using ve year averages as in Chinn and Ito (2008).
4. Empirical Results
We start by estimating equation (1), using the data and the empirical methodology out-lined in the previous section. The results are reported in Table 2.
Column (1) presents the baseline specication, where we estimate a panel data equation with time and country xed eects. As we can see the political regime has a strong negative relationship with current account balance. This veries our theoretical priors, i.e. democra-cies tend to run higher current account decits. Also, the coecient of the variable suggests that the quantitative eect of democracy on the current account balance in non- negligible: an one standard deviation increase in Democracy,9 is associated with a 3% point decline in
the current account balance.
[Insert table 2 here]
Regarding the rest of the control variables, Private Credit (% of GDP) has also a negative relationship and statistically signicant eect on current account balance. This is consistent with the saving glut hypothesis (Chinn and Ito, 2007) as highlighted in the previous section. Similarly the Real Eective Exchange Rate has a signicant negative eect on the current account balance at the 10% level of statistical signicance- suggesting that an increase in real
8The Hausman for Fixed versus Random Eects is given in the last line of Table 2. The Random Eects
model is clearly rejected in favor of the Fixed Eects model.
eective exchange rate makes imports more expensive and exports cheaper and thus exerting a negative eect on the current account balance. Oil Rents also enter with an expected
positive and statistically signicant sign (at the 1% level of signicance), which suggests that oil producing countries tend to run higher current account surpluses. This latter eect is quite large in size as an 1% increase in the oil rents is associated with an 1% higher current account balance.
Relative income appears to have a negative eect on current account balance. This eect is consistent with the stages of development hypothesis. However as this eect is rather small quantitatively, i.e. an 1% increase in the relative income for the country results in a 0.04% reduction in the current account balance and not consistently signicant in all estimations, we cannot place much condence in the result. Finally the budget balance has a strong positive eect on current account balance. This is consistent with a large number of papers (see for example Bussiere and Fratzscher(2006);Ca' Zorzi and Rubaszek(2008) ) which nd a positive association between current account balance and scal balance. As budget decits redistribute income from future to current generations therefore resulting into capital inows and current account decits (Obstfeld and Rogo, 1994).
The rest of the variables are found to be statistically insignicant. However with the exception of the variables Openness to T radeandReal Exchange Rate V olatility these
vari-ables have the expected signs.
In columns (2) to (5) of table 2 we re-estimate the baseline equation presented in column (1): (i) without time eects (column 2), (ii) assuming Random Eects (column 3), (iii) using a simple OLS (column 4) with time eects, (iv) with OLS without time eects (column 5).10
In all cases the eect of Democracy on the current account balance remains negative and
statistically signicant (at least in the 10% level of statistical signicance). With respect to
10We have also estimated our baseline model in an annual dataset and found the same eect of polity to
the rest of the variables the only important changes are in the P rivate Credit of GDPand Relative Income, which both change signs and remain statistically signicant. The literature
so far has for both variables inconclusive results. What we nd here is that the empirical result is heavily Dependent on the estimation method. However since the Fixed Eects model is (i) the correctly specied model according to the specication tests and (ii) the Fixed Eects model by estimating the within variation in the data captures the causal relationship between the independent and dependent variables (1) , we place more faith on the results of column (1).
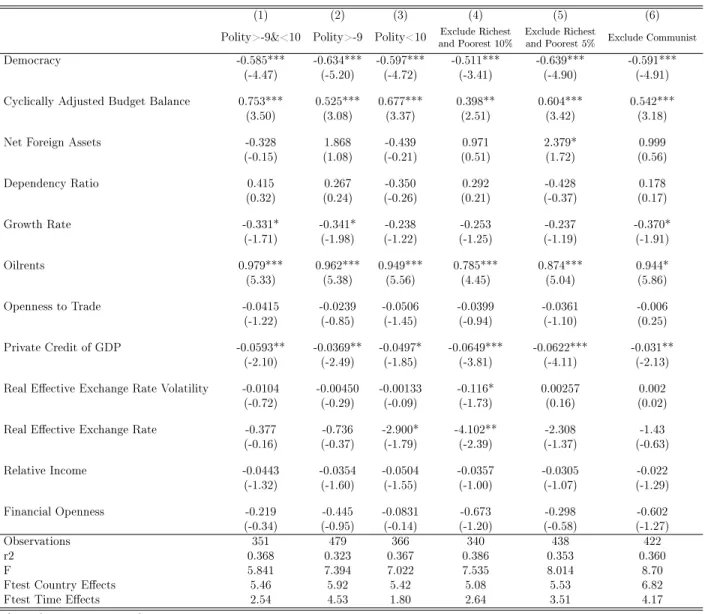
To further explore the robustness of our results, in Table 3 we re-estimate the baseline Fixed Eects equation by excluding countries that are a- priori expected to potentially aect our main nding.
[Insert table 3 here]
In columns (1) to (3) we examine whether the eect of the regime on current account is driven by the extreme values of Democracy in our sample. So in column (1) we estimate
our baseline equation by excluding from our sample countries that achieve a Polity IV score of 10 or below -9. We do so since these are the extreme values of the Democracy index
in our sample.11 In column (2) we exclude only countries where their Polity IV score takes
the minimum value, i.e. -9 and nally in column (3) we exclude countries which achieve the maximum Polity IV score, i.e. 10. As we can observe our main variable of interest remains negative and statistically signicant to the 1% level of statistical signicance. Moreover most of the variables retain their sign and signicance, with the exception of the real eective exchange rate and relative income variables which become insignicant. 12
In column (4) we estimate our model by excluding the richest and the poorest countries. Specically, we exclude countries with GDP per capita at the lowest and highest 10% (column
11There are no instances of countries with a polity score equal to -10. 12This may be attributed to the signicant decline in the observations.
4) and 5% (column 5) in the sample. The reason we do this is that we want to reject the probability that extreme values of GDP drive the result of the regime type on current account balance. As we can observe Democracy remains statistically signicant to the 1%
level , which implies that our relationship is very strong. The other variables have similar signs as in our baseline model except from slight dierences which may occur because of the change in observations. Finally, in column (6) we exclude countries which where communist and democratized. We believe that in these countries current account decits are a result of huge amounts of infrastructure investment and private consumption that was needed to be nanced using foreign funds and goods. So , we want to be sure that our results are not driven by those countries. It is obvious in column 6 that this does not happen. The coecient of democracy remains statistically signicant to the 1% level.
In Table 4 we re-estimate our model by using additional control variables. In column (1) we use the Freedom House index as proxy for democracy. We do that so as to ensure that the eect of the regime type on current account balance is not related with a specic variable that captures democracy (in this case Polity IV) but remains if we use other measures of democracy. As we can see, the eect of democracy is again statistically signicant to the 1% level and all the other variables have similar coecients and same signs as in our baseline model13
[Insert table 4 here]
In columns (2) to (5) we re-estimate our model by using additional control variables. In column (2) we replace the real eective exchange rate volatility with terms of trade volatility and in column (3) we estimate our model by using log GDP per capita instead of relative income. In column (4) we use the debt as percent of GDP instead of cyclically adjusted scal
13The only exception to the above statement being the variables which measure the Real Eective Exchange
balance. Finally in column (5) we exclude from our sample all the oil exporting countries. As we discussed earlier, the oil exporting economies face high current account surpluses and accumulate foreign assets during the extractive stage in order to smooth consumption once the non-renewable resources have been exhausted. For these economies the evolution of the current account in addition to being aected by oil prices may be aected by intended uctuations in their production in order to stabilize the global oil market rather than any particular concern on their external position (IMF, 2013). Furthermore oil exporting countries may face the eect of the natural resource curse, which is associated with weak institutions and excessive rent seeking (Torvik(2006), Robinson et al.(2006)). Therefore one can claim that our results may be driven by this eect. As we can observe, this is not the case.14 In all ve columns the eect of the political regime on current account balance
remains signicant at the 1% level.
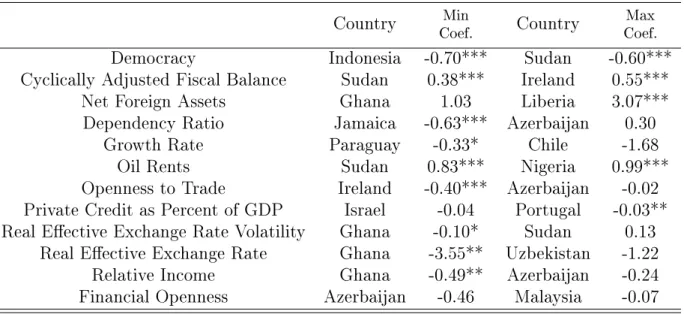
A nal robustness analysis is presented in Table 5, where we have performed a Jackknife analysis (Efron and Tibshirani, 1994). This method involves estimating the initial equation by excluding in each replication one cross sectional unit (country). In Table 5 we report the maximum and the minimum estimated coecients, as well as the excluded countries that exert this extreme identied impact. Comparing these coecients with the ones presented in Table 2 we can conclude that our results are robust to the exclusion of particular countries.
[Insert Table 5 here]
As the reader can easily verify the eect of Democracy on the current account balance,
is not sensitive to the exclusion of a particular country from the sample, as the coecient ranges from a -0.70 (with the exclusion of Indonesia) to -0.60 (with the exclusion of Sudan). These two values are within the condence interval of the baseline results (column (1)- Ta-ble2). Furthermore the variables that were found to be signicant in the baseline model,
14Although the coecient is half in size, we can't reject the hypothesis that the two coecients are not
do not change signs in the Jackknife estimation. It is interesting also to note that the vari-able Real Exchange Rate V olatilitywith the exclusion of Ghana from the sample, becomes
marginally statistically signicant and correctly signed- in contrast to the baseline results.
5. Instrumental Variables Analysis
In order to ensure that our results are not driven by endogeneity, in this section we employ an instrumental variable analysis. Endogeneity can be an important issue as it is possible that higher exposure to international markets, which may be associated with increased current account decits, may also lead to greater democracy. In other words it may argued that the correlation outlined in the previous section is not the outcome of a causal relationship but the outcome of another variable that aects Democracy and the Current Account Balance alike. Endogeneity among the variables may render all our previous results invalid. To avoid this possibility we resort to instrumental variables analysis.
To determine our instrument we follow Huntington (1993), who argues that Christianity was a key factor in the democratization process, as the clergy played an important role against authoritarian regimes. According to his historical account, in many countries Christian leaders encouraged coups against authoritarian regimes during the second and the third wave of democratization. This is attributed to the esoteric democratic message provided by Christianity and the fact that in most cases the Christian church- at least in the period under consideration which spans from 1945 onward- had a more distinct role from the state. Additionally Huntington pointed to the fact the Protestant church played a key role in the democratization process, as its structure is more democratically organized and thus has a natural tendency to promote the democratic structure of governance.
Following the above discussion, our main instrument is the share of all Christian adherents to Total Adherents. The variable is taken from the cross country World Religion Data
set.15 The World Religion Dataset provides data on religious adherence worldwide from 1945
onwards. The dataset rst creates a detailed religion tree, which classies all religions and religious families. It then uses census data or data from specic sources in order consistently compute the total number of adherents in each religious family for each country (see Maoz and Henderson, 2013for more details).The correlation of this variable withDemocracy- is close to
50%. Interestingly enough the share of Christian adherents has a 0.01correlation coecient
with the current account balance. Therefore a- priori it appears as a valid instrument. Also, according to Huntington (1993) and the democratization in waves concept as well as Persson and Tabellini (2009) and the foreign democratic capital theory, we also use the level of democracy of the neighbors of each country as an instrument , in each year. Both theories suggest that there is a strong positive correlation between the polity in a country and the polity in its neighbors. Therefore we construct a variable as follows:
Zi,t = P j6=iWijDjt X j6=i Wij
where Wijis the inverse distance in kilometers of capital cities of countries i and j and
Djtis the measure as determined by the polity score of country j at timet.
As nal instrument we use the lagged values ofDemocracy. Furthermore, we experiment
with the share of non-religious adherents- to verify the robustness of our results.16
Table 6 presents the results from the IV estimations. In column 1 the only instrument is the share of Christians in the country. As we can easily observe in the rst stage this variable has a positive eect on Democracy which is consistent with the above theoretical
reasoning. What is more interesting is the fact that in the second stage regression, the eect of Democracy remains negative and statistically signicant to the 1% level of statistical
15As available online on http://www.thearda.com/Archive/Files/Descriptions/WRDNATL.asp
16We have examined other instruments along the same line as well, for example the share of protestants,
share of Jewdish adherents etc. In all cases the correlation coecient withDemocracywas rather lower than the instruments used here. More importantly all tests for the validity of instruments rejected the use of this latter set of isntruments.
signicance. Moreover the instruments used are found statistically signicant at the rst stage, and we cannot reject the over identifying restrictions. This leads us to conclude that the instruments used are valid. Finally note that even though the Durbin- Wu-Hausman test provides evidence of endogeneity only at the 5% level of signicance, suggesting that even though there are valid reasons to argue for a reverse causality among Democracy and the
current account balance, there are not conclusive (statistical) evidence to reject the simple Fixed Eects model of the previous section.
[Insert Table 6 here]
In the rest of the columns in Table 6, we examine the robustness of the IV regression by experimenting with additional instruments. Firstly in column (2) we add the lagged
Democracy variable, then in column (3) we use the share of Christians, the lagged democracy
and the democracy in neighoring countries as instruments, in column (4) our instruments are the lagged and the democracy of neighboring countries and nally in column (5) we do the same as in column (4) but we also use the share of non-religious adherents as an instrument. The results, suggest that the instrumental variable analysis we perform is robust and give us strong empirical evidence that the relationship between the politica regime and the current account balance of a county are indeed associated. More specic, in column (2) we add the lagged variables of the democracy. The sing of this variable to the rst stage is positive and statistically signicant to the 1% as we expected and second stage gives us a statistically signcant and negative relationship between the regime type and the current account balance. In column (3) it is obvious from the rst stage that the democracy of the neighboring countries aects positively the level of democracy of a country. This is consistent with the theory that suggests, that a country's level of democracy depends on the level of democracy of its neighbors. What we care about is the second stage and the relationship between democracy and the current account balance. As we can observe, although we used
an additional instrument and not only the level of christianity, our negative relationship remains strong at the 1% level of statistical signicance. Furthermore, in column (4), we exclude the share of Cristians and our two instruments are only the lagged democracy and the democracy of the neighboring countries. We do that in order to ensure that it is not the share of christians the instrument that drives our result. It is clear that the latter does not happen. As we can observe, the strong relationship between the level of democracy and the current account balance remains signicant to the 1% level with the coecents of both models to be similar.
Finally in column (5) we do a placebo test on our instrumental variable analysis by using as an instrument a variable that is not expected to be correlated with the polity2 variable. This is the share of non religious adeherents. As column (5) indicates this instrument is no longer signicant in the rst stage regression. However, the rest of our instruments are statistically signicant and in the second stage the negative relationship between democracy and current account balance remains signicant.
Our nding from the instrumental variable analysis is that the main results of our empir-ical section remain: there is a clear negative and statistempir-ically signicant negative relationship between Democracy and the current account balance. Last but not least, the validity of
our instruments is strong as the latter are not rejected as valid instruments from our formal tests.17
6. Conclusions
In this paper we examined the eect of democracy on current account balance. Our nd-ings suggest that democracies tend to run higher current account decits than autocracies. These results were found to be robust across alternative specications. This negative
rela-17The Cragg Donald test suggests that all our instruments are strong and also F test indicates that our iv
tionship was justied on theoretical grounds. Firstly autocratic regimes want to be insulated by the political pressures of foreigners which may hold net foreign assets in their coun-try. Secondly, as globalization is associated positively with democracy and current account decits, dictatorships which are more closed run lower decits. Moreover current account consolidations are more easily achieved in an autocratic environment, as dictators face lower political pressures in imposing austerity measures. Finally as in democracies wages are higher relatively to autocracies, imports are higher too and thus current account decits are higher. Our analysis points to the severe policy constraints that current account adjustments face. Since democracies tend to have lower current account balances, there are two important conclusions to be drawn. Firstly, democratic countries are more prone than autocracies to face severe problems in servicing the decits in their external sector. And this always comes with a severe political cost. For example (Frankel 2005) and Borensztein and Panizza (2008) show that current account problems may have severe political repercussions, by leading to changes in the government and increase in political unrest. Then this may point to an endogenous problems faced by democracies, by following policies that by themselves undermine the whole political structure of the country. The second policy conclusion to be drawn is that current account adjustments in democracies may be more dicult to implement and ultimately to be sustained in the long run. Therefore any current account adjustment program, either designed by local governments, or international intergovernmental institutions, must always take into account the political framework within which the problem must be tackled with. References
Acemoglu, D., Johnson, S., Robinson, J. A., Yared, P., June 2008. Income and Democracy. American Economic Review 98 (3), 80842.
Acemoglu, D., Naidu, S., Restrepo, P., Robinson, J. A., March 2014. Democracy does cause growth. Working Paper 20004, National Bureau of Economic Research.
Acemoglu, D., Robinson, J. A., 2005. Economic origins of dictatorship and democracy. Cambridge University Press.
Adam, A., Filippaios, F., 2007. Foreign direct investment and civil liberties:a new perspec-tive. European Journal of Political Economy 23 (4), 10381052.
Aidt, T. S., Jensen, P. S., 2013. Democratization and the size of government: evidence from the long 19th century. Public Choice 157 (3), 511542.
Alesina, A., Drazen, A., December 1991. Why Are Stabilizations Delayed? American Eco-nomic Review 81 (5), 117088.
Amin, M., Djankov, S., 2014. Democratic institutions and regulatory reforms. Journal of Comparative Economics 42 (4), 839 854.
Anderson, G. M., 1988. Public nance in autocratic process: An empirical note. Public Choice 57 (1), 2537.
Asiedu, E., Lien, D., May 2011. Democracy, foreign direct investment and natural resources. Journal of International Economics 84 (1), 99111.
Bhattacharyya, S., 2013. Political origins of nancial structure. Journal of Comparative Economics 41 (4), 979 994.
Borensztein, E., Panizza, U., Oct. 2008. The Costs of Sovereign Default. IMF Working Papers 08/238, International Monetary Fund.
Brough, W., Kimenyi, M., January 1986. On the inecient extraction of rents by dictators. Public Choice 48 (1), 3748.
Bussiere, M., Fratzscher, M., 2006. Current Account Dynamics in OECD Countries and in the New EU Member States: An Intertemporal Approach. Journal of Economic Integration 21, 593618.
Ca' Zorzi, M., Rubaszek, M., May 2008. On the empirical evidence of the intertemporal current account model for the euro area countries. Working Paper Series 0895, European Central Bank.
Chinn, M. D., Ito, H., 08 2008. Global Current Account Imbalances: American Fiscal Policy versus East Asian Savings. Review of International Economics 16 (3), 479498.
Chinn, M. D., Prasad, E. S., January 2003. Medium-term determinants of current accounts in industrial and developing countries: an empirical exploration. Journal of International Economics 59 (1), 4776.
Crespo Cuaresma, J., Oberhofer, H., Raschky, P. A., 2011. Oil and the duration of dicta-torships. Public Choice 148 (3), 505530.
Darvas, Z., Mar. 2012. Real Eective Exchange Rates for 178 Countries: a New Database. Working Papers 1201, Department of Mathematical Economics and Economic Analysis, Corvinus University of Budapest.
Efron, B., Tibshirani, R., 1994. An Introduction to the Bootstrap. Chapman & Hall/CRC Monographs on Statistics & Applied Probability. Taylor & Francis.
Endegnanew, Y., Turner-Jones, T., Yartey, C. A., Feb. 2012. Fiscal Policy and the Current Account: Are Microstates Dierent? IMF Working Papers 12/51, International Monetary Fund.
Feng, Y., 1997. Democracy, political stability and economic growth. British Journal of Political Science 27 (03), 391418.
Frankel, J. A., August 2005. Contractionary currency crashes in developing countries. Work-ing Paper 11508, National Bureau of Economic Research.
Gruber, J. W., Kamin, S. B., 2005. Explaining the global pattern of current account im-balances. International Finance Discussion Papers 846, Board of Governors of the Federal Reserve System (U.S.).
Harms, P., Ursprung, H. W., October 2002. Do Civil and Political Repression Really Boost Foreign Direct Investments? Economic Inquiry 40 (4), 651663.
Hayek, F., 1978. The Constitution of Liberty. Phoenix book. University of Chicago Press. Helen V. Milner, K. K., 2005. Why the move to free trade? democracy and trade policy in the developing countries. International Organization 59 (1), 107143.
Huntington, S., 1993. The Third Wave: Democratization in the Late Twentieth Century. Julian J. Rothbaum distinguished lecture series. University of Oklahoma Press.
Imam, P. A., Sep. 2008. Rapid Current Account Adjustments: Are Microstates Dierent? IMF Working Papers 08/233, International Monetary Fund.
Kalyvitis, S., Vlachaki, I., 2012. When does more aid imply less democracy? An empirical examination. European Journal of Political Economy 28 (1), 132146.
Levitsky, S., Way, L., 2010. Competitive Authoritarianism: Hybrid Regimes After the Cold War. Problems of International Politics. Cambridge University Press.
Lipset, S. M., 3 1959. Some social requisites of democracy: Economic development and political legitimacy. American Political Science Review 53, 69105.
Maoz, Z., Henderson, E. A., 2013. The world religion dataset, 1945- 2010: Logic, estimates, and trends. International Interactions 39 (3), 265291.
Masson, P. R., Bayoumi, T., Samiei, H., September 1998. International Evidence on the Determinants of Private Saving. World Bank Economic Review 12 (3), 483501.
Mungiu-Pippidi, A., 2001. The return of populism - the 2000 romanian elections. Govern-ment and Opposition 36 (2), 230252.
Obstfeld, M., Rogo, K., Oct. 1994. The Intertemporal Approach to the Current Account. NBER Working Papers 4893, National Bureau of Economic Research, Inc.
Olson, M., 1965. The Logic of collective action. Harvard Economic Studies. Harvard Uni-versity Press.
O'Rourke, K. H., Taylor, A. M., May 2006. Democracy and protectionism. Working Paper 12250, National Bureau of Economic Research.
Papaioannou, E., Siourounis, G., September 2008. Economic and social factors driving the third wave of democratization. Journal of Comparative Economics 36 (3), 365387.
Robinson, J. A., Torvik, R., Verdier, T., April 2006. Political foundations of the resource curse. Journal of Development Economics 79 (2), 447468.
Rodrik, D., August 1999. Democracies pay higher wages. The Quarterly Journal of Eco-nomics 114 (3), 707738.
Roe, M. J., Siegel, J. I., 2011. Political instability: Eects on nancial development, roots in the severity of economic inequality. Journal of Comparative Economics 39 (3), 279 309. Torvik, R., April 2002. Natural resources, rent seeking and welfare. Journal of Development Economics 67 (2), 455470.
Tullock, G., September 1971. The paradox of revolution. Public Choice 11 (1), 8999. Wintrobe, R., 1998. The political economy of dictatorship. Vol. 6. Cambridge Univ Press. Yu, M., March 2010. Trade, democracy, and the gravity equation. Journal of Development Economics 91 (2), 289300.
TABLE 1: Descriptive Statistics
Variable Description mean StandardDeviation Source Expected Sign
Democracy
Proxy,for Democracy takes values from -10(full autocracy) to 10(full democracy)
2.20 6.97 Polity Project (-) Cyclically Adjusted
Fiscal Balance
Policy induced changes in scal balance calculated
as in Blachard (1990). -0.10 2.72
World Bank Deve-lopment Indicators (+) Net Foreign Assets Assets held by foreignersin the domestic economy. 0.12 0.72 World Bank Deve-lopment Indicators ambiguous Dependency Ratio People younger than 15or oder than 64 to the
working age population 0.86 0.30
World Bank Deve-lopment Indicators (+) Oil Rents Measures the Rentsa country recieves from
oil production 0.46 0.30
World Bank Deve-lopment Indicators (+) Openness to Trade Imports+Exportsas percent of GDP 83.30 48.67 World Bank Deve-lopment Indicators (-)
Financial openness
Index variable that codies restrictions on cross-border nancial transactions. Higher values denote more nancial openness
0.07 1.46 Chinn and Ito2007 ambiguous
Private Credit as percent of Gdp
Private banks credit to the private sector as percent of GDP as a deviation
from the world average
43.41 43.45 Beck et al. ambiguous
Real Eective Exchange Rate
Real value of a
countrys currency against the value of a basket of the trading partners of the country currencies.
4.66 0.40 Darvas2012 (-) Real Eective
Exchange Rate Volatility
3 year Moving Standard Deviation
of REER. 29.17 421.30
Darvas
2012 (-)
Relative Income real GDP of country ito a world weighted
average real GDP 28.31 25.40
World Economic Outlook (+) Growth Growth Rate 1.8 4.40 World EconomicOutlook (-)
TABLE 2: Baseline Estimations
(1) (2) (3) (4) (5)
Baseline No TimeEects RandomEects OLS OLS No TimeEects Democracy -0.660*** -0.556*** -0.161** -0.112* -0.125*
(-5.57) (-5.11) (-2.25) (-1.69) (-1.87) Cyclically Adjusted Budget Balance 0.483*** 0.534*** 0.602*** 0.645*** 0.597***
(3.02) (3.37) (3.75) (3.13) (2.89) Net Foreign Assets 1.689 2.152 4.171*** 6.688*** 7.045***
(1.02) (1.24) (2.93) (4.49) (4.64) Dependency Ratio -0.194 0.510 -0.404 -1.877* -1.440 (-0.17) (0.52) (-0.38) (-1.88) (-1.45) Growth Rate -0.259 -0.232 -0.208 -0.247* -0.293** (-1.50) (-1.49) (-1.50) (-1.68) (-2.01) Oilrents 0.931*** 0.923*** 0.432*** 0.381*** 0.365*** (5.66) (5.91) (5.67) (6.99) (6.82) Openness to Trade -0.0305 -0.0243 0.000210 0.0103 0.00701 (-1.05) (-0.87) (0.01) (1.14) (0.77) Private Credit of GDP -0.0326** -0.0180* 0.0197** 0.0438*** 0.0394*** (-2.30) (-1.67) (2.08) (5.95) (5.60) Real Eective Exchange Rate Volatility 0.00439 0.00692 0.0124 -0.00362 0.00227
(0.27) (0.44) (0.84) (-0.23) (0.15) Real Eective Exchange Rate -2.756* -4.074*** -2.789** 0.601 0.151
(-1.72) (-2.99) (-2.42) (0.50) (0.13) Relative Income -0.0391* -0.0276* 0.00305 0.0148 0.0322*** (-1.83) (-1.89) (0.25) (1.08) (2.85) Financial Openness -0.312 0.162 0.296 0.267 0.240 (-0.69) (0.39) (0.88) (1.02) (0.94) Observations 494 494 494 494 494 r2 0.326 0.295 0.345 0.412 0.399 F 8.470 5.496 11.37 15.73
F-test Country Eects 5.91 5.80
F-test Time Eects 3.80 2.43
Hausman Test(FE versus RE) 61.00
clustered t- statistics in parentheses. F-test country and time eects denote F-test for statistical signicance of xed country and time eects.* p<0.10, ** p<0.05, *** p<0.01
TABLE 3: Sensitivity Analysis
(1) (2) (3) (4) (5) (6) Polity>-9&<10 Polity>-9 Polity<10 and Poorest 10%Exclude Richest Exclude Richestand Poorest 5% Exclude Communist Democracy -0.585*** -0.634*** -0.597*** -0.511*** -0.639*** -0.591***
(-4.47) (-5.20) (-4.72) (-3.41) (-4.90) (-4.91) Cyclically Adjusted Budget Balance 0.753*** 0.525*** 0.677*** 0.398** 0.604*** 0.542***
(3.50) (3.08) (3.37) (2.51) (3.42) (3.18) Net Foreign Assets -0.328 1.868 -0.439 0.971 2.379* 0.999 (-0.15) (1.08) (-0.21) (0.51) (1.72) (0.56) Dependency Ratio 0.415 0.267 -0.350 0.292 -0.428 0.178 (0.32) (0.24) (-0.26) (0.21) (-0.37) (0.17) Growth Rate -0.331* -0.341* -0.238 -0.253 -0.237 -0.370* (-1.71) (-1.98) (-1.22) (-1.25) (-1.19) (-1.91) Oilrents 0.979*** 0.962*** 0.949*** 0.785*** 0.874*** 0.944* (5.33) (5.38) (5.56) (4.45) (5.04) (5.86) Openness to Trade -0.0415 -0.0239 -0.0506 -0.0399 -0.0361 -0.006 (-1.22) (-0.85) (-1.45) (-0.94) (-1.10) (0.25) Private Credit of GDP -0.0593** -0.0369** -0.0497* -0.0649*** -0.0622*** -0.031** (-2.10) (-2.49) (-1.85) (-3.81) (-4.11) (-2.13) Real Eective Exchange Rate Volatility -0.0104 -0.00450 -0.00133 -0.116* 0.00257 0.002
(-0.72) (-0.29) (-0.09) (-1.73) (0.16) (0.02) Real Eective Exchange Rate -0.377 -0.736 -2.900* -4.102** -2.308 -1.43 (-0.16) (-0.37) (-1.79) (-2.39) (-1.37) (-0.63) Relative Income -0.0443 -0.0354 -0.0504 -0.0357 -0.0305 -0.022 (-1.32) (-1.60) (-1.55) (-1.00) (-1.07) (-1.29) Financial Openness -0.219 -0.445 -0.0831 -0.673 -0.298 -0.602 (-0.34) (-0.95) (-0.14) (-1.20) (-0.58) (-1.27) Observations 351 479 366 340 438 422 r2 0.368 0.323 0.367 0.386 0.353 0.360 F 5.841 7.394 7.022 7.535 8.014 8.70 Ftest Country Eects 5.46 5.92 5.42 5.08 5.53 6.82 Ftest Time Eects 2.54 4.53 1.80 2.64 3.51 4.17
clustered t- statistics in parentheses * p<0.10, ** p<0.05, *** p<0.01
TABLE 4: Sensitivity Analysis (1) Freedom House Democracy (2) Terms of Trade Volatility (3)
GDP per Capita Fiscal Balance(4) Oil(5)
Freedom House -13.37***
(-4.35)
Cyclically Adjusted Budget Balance 0.502*** 0.500** 0.467*** 0.351
(3.12) (2.60) (2.80) (1.408)
Net Foreign Assets 1.187 1.127 1.223 0.898 -1.265
(0.69) (0.62) (0.67) (0.55) (-0.388) Dependency Ratio -0.487 -1.065 -0.231 -0.429 -0.357 (-0.41) (-0.96) (-0.23) (-0.36) (-0.34) Growth Rate -0.232 -0.239 -0.322* -0.188 0.009 (-1.34) (-1.35) (-1.84) (-1.00) (0.058) Oilrents 0.832*** 0.905*** 0.946*** 0.955*** 0.954*** (5.20) (4.28) (5.74) (6.52) (4.35) Openness to Trade -0.0273 -0.0230 -0.0310 -0.0295 0.026 (-0.96) (-0.77) (-1.06) (-0.92) (0.785) Private Credit of GDP -0.0229 -0.0312** -0.0391*** -0.0361** -0.006 (-1.65) (-2.29) (-2.69) (-2.41) (-0.225)
Real Eective Exchange Rate Volatility 0.00410 0.00571 -0.134** 0.072
(0.25) (0.40) (-2.02) (0.735)
Real Eective Exchange Rate -2.784 -4.126** -2.689* -3.373* -2.509
(-1.53) (-2.23) (-1.66) (-1.88) (-1.390) Relative Income -0.0405* -0.0485** -0.0496** -0.062** (-1.90) (-2.15) (-2.01) (-2.184) Financial Openness -0.319 -0.257 -0.417 -0.130 0.148 (-0.72) (-0.55) (-1.01) (-0.24) (0.252) Democracy -0.594*** -0.639*** -0.668*** -0.257** (-4.72) (-5.26) (-4.16) (-2.266)
terms of trade volatility -8.57e-14 -7.45e-14
(-1.16) (-1.41) Gdp Per Capita 2.168 2.221 (1.54) (1.52) Fiscal Balance 0.00587 0.00476 (0.44) (0.25) Observations 490 451 490 445 229 r2 0.311 0.323 0.329 0.359 0.273 F 7.954 . 8.407 8.977 5.15
Ftest Country Eects 5.73 6.07 5.50 5.91 8.00
Ftest Time Eects 2.90 4.27 4.28 3.42 4.31
clustered t- statistics in parentheses * p<0.10, ** p<0.05, *** p<0.01
TABLE 5: Jackknife Estimation
Country Coef.Min Country Coef.Max Democracy Indonesia -0.70*** Sudan -0.60*** Cyclically Adjusted Fiscal Balance Sudan 0.38*** Ireland 0.55*** Net Foreign Assets Ghana 1.03 Liberia 3.07***
Dependency Ratio Jamaica -0.63*** Azerbaijan 0.30 Growth Rate Paraguay -0.33* Chile -1.68
Oil Rents Sudan 0.83*** Nigeria 0.99*** Openness to Trade Ireland -0.40*** Azerbaijan -0.02 Private Credit as Percent of GDP Israel -0.04 Portugal -0.03** Real Eective Exchange Rate Volatility Ghana -0.10* Sudan 0.13
Real Eective Exchange Rate Ghana -3.55** Uzbekistan -1.22 Relative Income Ghana -0.49** Azerbaijan -0.24 Financial Openness Azerbaijan -0.46 Malaysia -0.07 * p<0.10, ** p<0.05, *** p<0.01
TABLE 6: IV Regressions (1) Instr.Christians (2) Instr. Christians Democracy(-1) (3) Instr.Democracy(-1) Christians Neighboor Democracy (4) Instr. Democracy (-1) Neighboor Democracy (5) Instr. NonReligious Democracy(-1) Neighboor Democracy Democracy -1.656*** -1.427*** -1.288*** -1.298*** -1.268*** (-3.11) (-3.64) (-3.58) (-3.50) (-3.48)
Cyclically Adjusted Budget 0.406*** 0.411*** 0.427*** 0.426*** 0.428***
Balance (2.67) (2.87) (3.01) (3.00) (3.02)
Net Foreign Assets 2.712* 1.466 2.543* 2.545* 2.538*
(1.89) (1.03) (1.94) (1.94) (1.94) Dependency Ratio -0.922 -0.498 -0.362 -0.366 -0.354 (-0.85) (-0.47) (-0.34) (-0.35) (-0.34) Growth Rate -0.207 -0.299* -0.294* -0.294* -0.293* (-1.19) (-1.68) (-1.66) (-1.66) (-1.66) Oil rents 1.138*** 1.058*** 1.042*** 1.044*** 1.038*** (4.99) (5.21) (5.16) (5.17) (5.14) Openness to trade -0.0247 -0.0308 -0.0323 -0.0324 -0.0323 (-0.96) (-1.21) (-1.25) (-1.25) (-1.25) Private credit -0.0323** -0.0511*** -0.0471*** -0.0473*** -0.0467*** as percent of gdp (-2.23) (-3.09) (-2.96) (-2.96) (-2.94) Real Eective -0.0164 -0.0327 -0.0308 -0.0310 -0.0304 Exchange Rate (-0.82) (-1.31) (-1.22) (-1.22) (-1.20)
Real Eective Exchange -3.936** -4.420** -4.230** -4.234** -4.221**
Rate Volatility (-2.55) (-2.12) (-2.03) (-2.03) (-2.03) Relative Income -0.0622*** -0.0461** -0.0436** -0.0436** -0.0437** (-3.31) (-2.31) (-2.20) (-2.20) (-2.20) Financial Openness 0.00501 -0.468 -0.411 -0.413 -0.407 (0.01) (-1.10) (-0.97) (-0.97) (-0.96) First stage Share of Christians 9.30*** 5.38*** 4.14** (3.32) (2.65 ) (1.95) Lagged Democracy 0.30*** 0.29*** 0.25*** 0.30*** (5.14) (5.62) (5.13) (5.34) Neighboor Democracy 0.72** 0.8** 0.78** (2.21) (2.41) (2.39) Share of NonReligious -2.16 (-1.43) Observations 489 469 463 463 463 R2 0.154 0.262 0.290 0.288 0.293 F 4.206 4.567 5.021 5.010 5.038 DWH 4.328** 6.073** 4.907** 7.30 *** 3.834**
Cragg Donald test 16.552*** 40.763*** 28.792*** 41.246*** 27.714***
F-test Instr. 11.02** 19.62*** 13.26 *** 18.44*** 13.09 ***
clustered t- statistics in parentheses. DWH is the Durbin- Wu- Hausman Test of endogeneity of the regressors.Rejection of the null suggests that the IV regression is required. Cragg Donald F statistic is a weak idendication test for the model. Null hypothesis indicates that the model is weak idendied. F-test Instr. denotes the test for excluded instruments.* p<0.10, ** p<0.05, *** p<0.01