D 2.4
DELIVERABLEPROJECT INFORMATION
Project Title: Systemic Seismic Vulnerability and Risk Analysis for
Buildings, Lifeline Networks and Infrastructures Safety Gain Acronym: SYNER-G
Project N°: 244061
Call N°: FP7-ENV-2009-1 Project start: 01 November 2009
Duration: 36 months
DELIVERABLE INFORMATION
Deliverable Title:
D2.4 - Definition of system components and the formulation of system functions to evaluate the performance of gas and oil pipeline
Date of issue: 30 June 2011
Work Package: WP2 – Development of a methodology to evaluate systemic vulnerability
Deliverable/Task Leader: AMRA
REVISION: Final Project Coordinator: Institution: e-mail: fax: telephone:
Prof. Kyriazis Pitilakis
Aristotle University of Thessaloniki [email protected]
+ 30 2310 995619 + 30 2310 995693
i
Abstract
In the frame of SYNER-G Work Package 2- Development of a methodology to evaluate systemic vulnerability-, the present deliverable aims to achieve the following targets:
o Definition of the taxonomy for the components of a Natural Gas System (GAS) and an Oil network (OIL) according to the general description given in deliverable report D5.4 on system vulnerability and loss for gas and oil systems.
o Description of performance indicators available in literature to evaluate the performance of the whole system and its components after an earthquake both in terms of connectivity and service-flow analysis. Moreover new indicators are proposed in order to better characterize the functionality of the system and its components.
iii
Acknowledgments
The research leading to these results has received funding from the European Community's Seventh Framework Programme [FP7/2007-2013] under grant agreement n° 244061.
v
Deliverable Contributors
AMRA Simona Esposito Sonia Giovinazzi Iunio Iervolino
vii
Table of Contents
Abstract ... i
Acknowledgments ... iii
Deliverable Contributors ... v
Table of Contents ... vii
List of Figures ... viii
List of Tables ... viii
1 Taxonomy of Natural Gas and Oil system ... 13
1.1 GENERAL DESCRIPTION ... 13
1.2 NATURAL GAS SYSTEM ... 16
1.2.1 GAS01-Production and gathering facility ... 16
1.2.2 GAS02-Treatment plant ... 17
1.2.3 GAS03-Storage tank farm ... 17
1.2.4 GAS04-Stations ... 17
1.2.5 GAS05-Pipelines ... 18
1.2.6 GAS06-Scada ... 18
1.3 OIL PIPELINE SYSTEM ... 19
1.3.1 OIL01-Production and gathering facility ... 19
1.3.2 OIL02-Refineries ... 19
1.3.3 OIL03-Storage tank farms ... 19
1.3.4 OIL04-Pumping plants ... 20
1.3.5 OIL05-Pipelines ... 20
1.3.6 OIL06-Scada ... 20
2 Performance Indicators ... 21
2.1 SYSTEM’S PERFORMANCE INDICATORS ... 22
ix
List of Figures
Fig. 1 Natural Gas production, transmission and distribution system ... 14
Fig. 2 Typical oil and gas production system ... 14
Fig. 3 Gas Transmission Pipelines ... 15
xi
List of Tables
Taxonomy of Natural Gas and Oil system
13
1
Taxonomy of Natural Gas and Oil system
1.1
GENERAL DESCRIPTION
Oil and gas are considered among the world’s most important resources. Petroleum itself is used for numerous products, in addition to serving as the world’s primary fuel source. The processes and systems involved are highly complex and capital-intensive. Once a company identifies where oil and gas is located, plans begin to drill an exploratory drill well. For on shore development of oil and gas production facilities, the wells are grouped to form a gathering system. The gathering system is connected to the production and processing facility, through a network of carbon steel tubes. In the production and the processing facility, the oil and the gas are treated through a chemical and a heating process. After the separation from water and sediments, oil and gas are placed in storage areas. From there the resources can be pumped through pipelines to the loading terminals where the fuels are ready to be transported. In offshore development, field platforms or floating vessels are used for the production and extraction process.
Therefore the Natural Gas and Oil systems can be subdivided essentially into two major parts (as shown in Fig (1)):
• Production/Processing • Transmission/Distribution
Both the Production/Processing and the Transmission/Distribution components are briefly described in the following sections. A more detailed treatment can be found in deliverable D5.3 “Systemic vulnerability and loss for gas and oil systems”.
Production and Processing
Raw natural gas comes from three types of wells: oil wells, gas wells, and condensate wells. The natural gas that comes from oil wells is typically referred to as 'associated gas'. The ‘associate gas’ can exist separate from oil (free gas), or dissolved in the crude oil (dissolved gas). The natural gas that comes from gas and condensate wells, where there is little or no crude oil, is termed 'non-associated gas'. Gas wells typically produce raw natural gas, while condensate wells produce free natural gas along with a semi-liquid hydrocarbon condensate. The natural gas must be purified before it can be transported. Therefore, after its extraction, the natural gas is processed in order to obtain 'pipeline quality gas', namely dry natural gas. The dry natural gas is obtained by eliminating different hydrocarbons and fluids normally contained in the pure natural gas, mainly ethane, propane, butane, and pentanes. Similarly the oil is sent to a refiner after the extraction process and from there the to a tanker terminal or to a transmission pipeline system. In the refinery plant, the crude oil is converted into high-octane motor fuel (gasoline/petrol), diesel oil, liquefied petroleum gases (LPG), jet aircraft fuel, kerosene, heating fuel oils, lubricating oils, asphalt and petroleum coke.
Taxonomy of Natural Gas and Oil system
14 A typical oil and gas production system is shown in Fig.(2).
Fig. 1 Natural Gas production, transmission and distribution system (from Thompson, 2001b)
Fig. 2 Typical oil and gas production system (from Ruschau and Al-Anezi, 2001a)
Taxonomy of Natural Gas and Oil system
15 Transmission/Distribution
The purpose of the natural gas gathering and transmission pipelines is similar to the one of crude oil gathering line and crude oil trunk lines; however, the operating conditions and equipment for natural gas and oil gathering and transmission pipeline are quite different. The gas transmission pipelines (Fig. 3) use compressors to force the gas through the pipe instead of pumps; when the natural gas leaves the processing plant, it enters into the compressor station where it is pressurized for the transmission. Before reaching a major metropolitan area, the natural gas is diverted through an intermediate station where the pressure is reduced, measured, and sold to the local gas company. The natural gas company distributes the natural gas through an underground network of smaller pipelines called "mains." Smaller lines called "services" connect the mains to the end-users. Natural gas is often treated in scrubbers or filters to ensure that it is dry prior to the distribution. Crude oil must undergo refining before it can be used as a product. Once oil is refined, product pipelines transport the product to a storage and distribution terminal. Different modes of transportation are used to move the oil from the production site to the refineries and from the refineries to the consumers. Crude oil and refined products are transported across the water in barges and tankers. On land crude oil and products are moved using pipelines, trucks, and trains. The pressure in the trunk lines is initiated and maintained by pumps to overcome friction, changes in elevation, or other pressure-decreasing factors.
Fig. 3 Gas Transmission Pipelines (from Thompson, 2001a)
Taxonomy of Natural Gas and Oil system
16
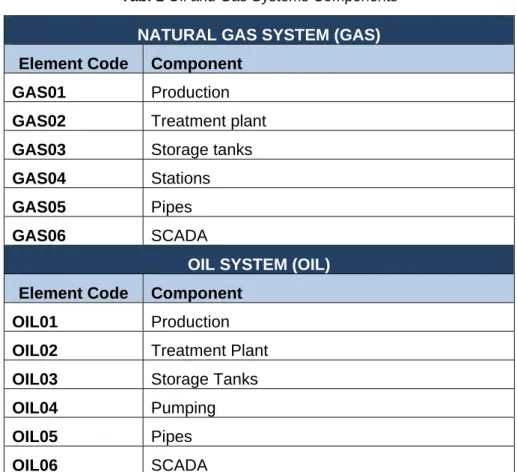
Therefore natural gas and oil systems consist essentially of: 1) a number of critical facilities (Production and gathering facilities, Treatment/Refineries plants, Storage facilities, Intermediate stations); 2) the trans-mission/distribution network made of pipelines; 3) the supervisory control and data acquisition sub-system, namely SCADA. Table (1) shows the networks components that are considered for the vulnerability analysis and that are described in details below.
Tab. 1 Oil and Gas Systems Components
NATURAL GAS SYSTEM (GAS)
Element Code Component GAS01 Production GAS02 Treatment plant GAS03 Storage tanks
GAS04 Stations
GAS05 Pipes
GAS06 SCADA
OIL SYSTEM (OIL)
Element Code Component
OIL01 Production
OIL02 Treatment Plant OIL03 Storage Tanks
OIL04 Pumping
OIL05 Pipes
OIL06 SCADA
1.2
NATURAL GAS SYSTEM
1.2.1 GAS01-Production and gathering facility
Production facilities consist of onshore facilities (production field) or offshore (marine-water) platforms. The former is an area encompassing a group of oil and gas pools and wells (oil, gas and condensate wells). The production facility is complemented by a gathering facility, which is a flow-line network (surface pipeline) and by process facilities that transport and control the flow of oil or gas from the wells to the main storage facility, the processing plant or the shipping point. There are two types of gathering systems, radial and trunk line. The radial type brings all the flow-lines to a central header, while the trunk-line type uses several remote headers to collect fluid. The latter is mainly used in large fields. The gathering line consists of low pressure, low diameter pipelines that transport raw natural gas from the wellhead to the processing plant.
Taxonomy of Natural Gas and Oil system
17
1.2.2 GAS02-Treatment plant
The gas is treated to remove any contaminants, water, and dust or petroleum liquids. The processing can be done at the wellhead and at centralized processing plants. The actual practice of processing natural gas to obtain pipeline dry gas quality levels usually involves four main processes:
• Oil and condensate removal (Separator)
• Water Removal (Separator, Absorption towers, Adsorption towers)
Separation of Natural Gas Liquids: generally in a centralized processing plant, includingtwo basic steps, namely NGL extraction (Absorption Towers, Cryogenic ExpansionProcess with expansion turbine) and NGL Fractionation(Deethanizer, Depropanizer, Debutanizer, Butane Splitter or Deisobutanizer)
• Sulfur and Carbon Dioxide Removal(Amine Absorption Process) Equipment:
• Amine process: Absorber, Regenerator and accessory equipment( Reboiler, Pumps, Condenser, Valve, Reflux drum etc)
• NGL Fractionation: Fractionating column and accessory equipment (Reboiler, Reflux drum, Condenser etc)
• Water removal: Regenerator, Contactor and accessory equipment (Absorption); Adsorption Towers.
1.2.3 GAS03-Storage tank farm
Storage facilities are used for demand floating, commercial purposes, and as buffer between transportation and distribution network. There are two types of storage facilities: 1) underground storage facilities (depleted gas reservoirs, aquifers, salt caverns); and 2) Storage Tanks for Liquefied Natural Gas (LNG) that includes pipes and electric components.
1.2.4 GAS04-Stations
• Compression Stations
The natural gas enters into the compressor station, where it is compressed by either a turbine, a motor, or an engine to ensure that the flowing of the natural gas, through any pipeline, remains pressurized. The turbine operates a centrifugal compressor that, using a fan, compresses and pumps the natural gas through the pipeline. Natural gas engines are also used to power some compressor stations. Compressor stations usually contain scrubbers and filters that capture any undesirable particles or liquids that might be still contained in the natural gas flowing through the pipeline.
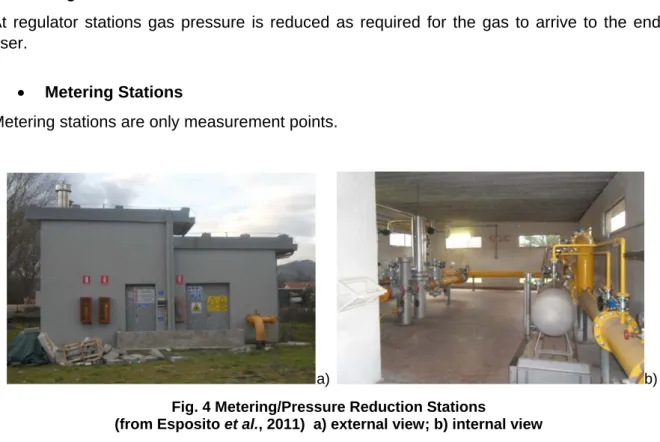
• Metering /Pressure Reduction Stations
Metering/Pressure Regulator Stations (Fig. 7) contain metering equipments for monitoring and managing the natural gas in their pipes, including the reduction of the gas pressure before its distribution into the pipe system.
Taxonomy of Natural Gas and Oil system
18 • Regulator Stations
At regulator stations gas pressure is reduced as required for the gas to arrive to the end-user.
• Metering Stations
Metering stations are only measurement points.
a) b)
Fig. 4 Metering/Pressure Reduction Stations
(from Esposito et al., 2011) a) external view; b) internal view
1.2.5 GAS05-Pipelines
There are three major types of pipelines used in three different systems:
o Gathering system: connects the wellhead to the treatment plant and it is characterized by low pressure and diameter pipelines.
o Transportation system: transports gas from the treatment plant to the distribution systems, often across long distances; it is characterized by high pressure and large diameter pipelines.
o Distribution system: connects regulator stations to the city, communities and it is characterized by low pressure and small-diameter pipelines.
Individual pipes (buried and unburied) connect residential buildings and businesses to the distribution system. However the description and vulnerability analysis of these pipeline systems is out of the scope of the Syner-G project.
Pipeline systems may include a great number of valves along their entire distributed network. These valves work like gateways: they are open to allow the flow of the natural gas; they can be closed to stop the gas flow along a certain section of pipe.
1.2.6 GAS06-Scada
Control and communication systems are critical for the safe and continuous conveyance of both gas and liquid fuels, and are vital to guarantee an effective and timely emergency response. In particular, Supervisory Control and Data Acquisition, SCADA, which stands for are sophisticated communications systems that take measurements and collect data along the pipeline network (usually in a metering or compressor stations and valves) and transmit them to centralized control stations. This enables a quick reaction to equipment
Taxonomy of Natural Gas and Oil system
19
malfunctions, leaks, or any other unusual activity along the pipeline. Some SCADA systems incorporate the ability to remotely operate certain equipment along the pipeline, including compressor stations, allowing engineers in a centralized control center to immediately and easily adjust flow rates in the pipeline.
1.3
OIL PIPELINE SYSTEM
1.3.1 OIL01-Production and gathering facility
Oil is found in reservoirs deep underground or beneath the ocean floor and it is extracted vertically through high-pressure tubing. The process extracts oil, water and mixed gases from the rock formations. Once at the surface, the production stream runs through a control wellhead into horizontal flow lines that carry the three phases into a separator vessel. In particular the gas from the top of the vessel may be injected again into the reservoir, flared or refined and marked, separating all the various hydrocarbons and fluids from the pure natural gas, to produce the ‘pipeline quality’ dry natural gas. The oil is sent to a pipeline for delivery to a refinery, tanker terminal or transmission pipeline system.
1.3.2 OIL02-Refineries
In the refineries the crude oil is converted into high-octane motor fuel (gasoline/petrol), diesel oil, liquefied petroleum gases (LPG), jet aircraft fuel, kerosene, heating fuel oils, lubricating oils, asphalt and petroleum coke.
Equipment:
Centrifuges, Compressors, Cooling towers, Crushers, Crystallizers, Distillation towers and pressure vessels, electric power generators, transformers and electric motors, electrolysis cell, evaporators, filters, fumaces, gas flares, mixers and blenders, monitoring and control systems, piping and valves, pumps, steam generators, steam turbines and gas turbines, storage tankers, wastewater treatment.
1.3.3 OIL03-Storage tank farms
There are four basic types of tanks used to store petroleum products: o Floating Roof Tank used for crude oil, gasoline, and naphtha.
o Fixed Roof Tank used for diesel, kerosene, catalytic cracker feedstock, and residual fuel oil.
o Bullet Tank used for normal butane, propane, and propylene. o Spherical Tank used for isobutane and normal butane.
Taxonomy of Natural Gas and Oil system
20
1.3.4 OIL04-Pumping plants
Pumping plant allows maintaining the flow of the oil in the pipelines. Pumping plants usually use two or more pumps. Pumps can be of either centrifugal or reciprocating type. However, no differentiation is made between these two types of pumps in the analysis of oil systems.
1.3.5 OIL05-Pipelines
Pipelines are used to move crude oil from the wellhead to gathering and processing facilities and from there to refineries and tanker loading facilities. Product pipelines ship gasoline, jet fuel, and diesel fuel from the refinery to local distribution facilities. After crude oil is converted into refined products such as gasoline, pipelines are used to transport the products to terminals for movement to gasoline stations. In addition to gasoline, products pipelines are used to ship diesel fuel, home heating fuel, kerosene, and jet fuel.
1.3.6 OIL06-Scada
Performance Indicators
21
2
Performance Indicators
An integrated system performance analysis is required to evaluate how the earthquake-induced damage, at the component level, can affect the functionality and serviceability of lifelines networks. For the specific case of the gas network, the performance may be related to the capacity of the system to deliver gas with sufficient pressure to costumers; in this case hydraulic analysis is used to assess the overall system performance, given the estimation of earthquake-induced damage at the component level.
Performance indicators (PIs) are introduced to provide a measure of the impact of the earthquake on the system functionality and serviceability.
As explained in the deliverable report D2.1, PIs can be categorized according to the object they refer to. Thus one has :
• Component level PIs • System level PIs • Infrastructure level PIs
Components level PIs and System Level PIs are proposed for the GAS and OIL systems to quantify the degree to which these systems are able to meet established specifications and/or customer requirements following an earthquake event.
At the system level, for the gas and oil systems, the adaptation and use of two serviceability performance indicators, originally defined for the water supply system, namely the System Serviceability Index (Wang et al. 2010) and the Connectivity Loss (Poljanšek et al., 2011), is proposed.
At the component level, the use of the Damage Consequent Index (Wang et al. 2010), originally defined for water pipes, is proposed to assess how the pipelines damage can impact on the system serviceability of gas or oil systems.
Further to the adaptation of existing measures, new PIs, are proposed to characterize the serviceability of the system, in terms of customer connectivity, and its residual functionality/capability (e.g. quality and pressure of the gas).
Both absolute and relative PIs are proposed. Absolute PIs measure the absolute functionality/serviceability at a certain period of time following the event (e.g. customer connectivity; utility customer density). Absolute PIs measure the loss of capability and/or serviceability relative to the initial situation.
Performance Indicators
22
2.1
SYSTEM’S PERFORMANCE INDICATORS
• System Serviceability Index(Wang et al, 2010)
The System Serviceability Index (SSI), originally defined by Wang et al. (2010) for a Water Supply Systems, is proposed as a system performance indicator for the Gas and Oil networks. The SSI is a relative index that compares the serviceability of the utility network, in terms of customer demand satisfaction, before and after the earthquake:.
∑ ∑
where n and n0 are respectively the number of satisfied demand nodes after and before the earthquake; Qi is the demand (flow) at the i-th node.
• Connectivity Loss (Poljanšek et al., 2011)
Connectivity loss (CL) measures the average reduction in the ability of sinks (gas-fired power plants) to receive flow from sources (gas fields and LNG terminals) counting the number of the sources connected to the i-th sink in the original (undamaged) network
, and then in the damaged network , :
1 ,
,
• Serviceability Ratio (Adachi and Ellingwood, 2008)
The Serviceability ratio (S), originally defined by Adachi and Ellingwood (2008) for a Water Supply Systems, is proposed for Gas and Oil systems. This index is directly related to the number of distribution nodes in the utility network, which remain accessible from at least one supply facility following the earthquake. It is computed as:
∑ ∑
Where s is the serviceability ratio of the system defined on the domain [0,1], is a weighting factor assigned to the distribution node I and represents the functionality of facility I, which is modeled as the outcome of a Bernoulli trial ( 1 if facility is accessible from at least one supply facility), N is the number of distribution nodes.
Performance Indicators
23 • Average Pressure Ratio
The Average Pressure Ratio is defined as the avarage ratio of the gas pressure in the seismically damaged network to the reference value for non-seismic, normal operations conditions considering nodes.
1 where the ratio PRi is defined below (see section 2.2).
• Utility Customer density
The Utility Customer Density measures the average number of customers connected to the utility services per square kilometer at the certain time. It can be evaluated considering the type of customer, i.e. residential, industrial or strategic.
2.2
COMPONENT PERFORMANCE INDICATORS
•
Damage Consequence Index (Wang et al., 2010)The use of the Damage Consequence Index, DCI, originally defined for water systems, is proposed for all gas and oil pipeline networks, DCI measures how the damage on a single pipe impacts on the overall system serviceability, by identifying critical linksthat significantly affect the system seismic performance. The Damage Consequences Index (DCI) is expressed as.
| 1
where is the expected value of SSI and
|
is the conditional value of SSI that consider only the i-th damaged pipes. DCI measures the reduction of SSI given that the i-th pipe is damaged.• Pressure ratio at nodes
The Pressure Ratio at Nodes is defined, for each node, as the ratio between the gas pressure in the seismically damaged network, Psi, and reference value of the pressure Poi, for, as-usual operating conditions. The determination of the gas pressure in the seismically damaged network, Psi requires a flow analysis of the network.
• Customer Connectivity
The Customer Connectivity (CC) evaluates capacity of demand nodes (or stations) in the gas distribution network to satisfy customers receiving flow from supply nodes (stations or plants). CC counts the number of customers satisfied by the i-th demand node ,
Performance Indicators
24
if the i-th demand node is accessible from at least one supply node, respect to the number of customers in the undamaged network , . Moreover this index can be evaluated for the j-th type of customer, i.e. residential, industrial or strategic:
, ,
References
25
References
Adachi T. and B.R. Ellingwood. 2008. Serviceability of earthquake-damaged water systems: Effects of electrical power availability and power backup systems on system vulnerability. Reliability Engineering and System Safety 93, 78-88
ALA. 2005. Guideline for Assessing the Performance of Oil and Natural Gas Pipeline Systems in Natural Hazard and Human Threat Events. April. American Lifelines Alliance. http://www.americanlifelinesalliance.org/Products new3.htm
Chang L. and J. Song. 2007. Matrix-based system reliability analysis of urban infrastructure networks: a case study of MLGW natural gas network. Proc. 5th China-Japan-US Trilateral Symposium on Lifeline Earthquake Engineering, November 26-28, Haikou, China.
Ching J. and W.-C. Hsu. 2007. An efficient method for evaluating origin-destination connectivity reliability of real-world lifeline networks. Computer-Aided Civil and Infrastructure Engineering 22 , 584-496.
Esposito S., Giovinazzi S., Elefante L. and I. Iervolino. 2011. Post-Earthquake Physical Damage Assessment for Gas Networks. Proc. of 9th Pacific Conference on Earthquake Engineering, Auckland, New Zealand, 14-16 April.
FEMA. 1992. Earthquake Resistant Construction of Gas and Liquid Fuel Pipeline Systems Serving, or Regulated by, the Federal Government. http://www.eeri.org/mitigation/files/fema-233.pdf
Helseth A. and A.T. Holen. 2006. Reliability modeling of gas and electric power distribution systems; similarities and differences. Proc. 9th international Conference on Probabilistic Methods Applied to Power Systems, June 11-15, Stockholm, Sweden.
Ruschau G. R. and A. M. Al-Anezi. 2001a. Oil and Gas Exploration and Production. Appendix S of Corrosion Cost and Preventative Strategies. Final Report. http://www.corrosioncost.com/pdf/oilgas.pdf
Ruschau G. R. and A. M. Al-Anezi. 2001b. Petroleum Refining Appendix U of Corrosion Cost and Preventative Strategies. Final Report. http://www.corrosioncost.com/pdf/petro.pdf
Poljanšek K., Bono F. and E. Gutiérrez. 2010. Gis-based method to assess seismic vulnerability of interconnected infrastructure : a case of Eu gas and electricity networks EUR – Scientific and Technical Research series – ISSN 1018-5593.
Poljanšek K., Bono F. and E. Gutiérrez. 2011. Seismic risk assessment of interdependent critical infrastructure systems: The case of European gas and electricity networks. Earthquake Engineering And Structural Dynamics. DOI: 10.1002/eqe.1118.
Thompson N. G. 2001a. Gas and Liquid Transmission Pipelines. Appendix E of Corrosion
Cost and Preventative Strategies. Final Report. http://www.corrosioncost.com/pdf/gasliquid.pdf
Thompson N. G. 2001b. Gas Distribution. Appendix J of Corrosion Cost and Preventative Strategies. Final Report. http://www.corrosioncost.com/pdf/gas.pdf.
Wang Y., Siu-Kui Au, and Fu Qiang. 2010. Seismic Risk Assessment and Mitigation of Water Supply Systems Earthquake Spectra 26 (1) 257-274.