Multimodal Machine Learning for Intelligent
Mobility
by
Aubrey James Roche
Doctoral Thesis
Submitted in partial fulfilment of the requirements for the award of Doctor of Philosophy
Institute of Digital Technologies, Loughborough University London
© Aubrey James Roche May 2020
Dedicate to my partner Sádhbh & my son Ruadhán – Nunc scio quid sit amor, semper gratiam habebo.
Ever tried. Ever failed. No matter. Try Again. Fail again. Fail better. (Samuel Beckett)
Certificate of Originality
Thesis Access Conditions and Deposit Agreement
Students should consult the guidance notes on the electronic thesis deposit and the access conditions in the University’s Code of Practice on Research Degree Programmes
Author: Jamie Roche ... Title: Multimodal Machine Learning for Intelligent Mobility ... I Jamie Roche, 2 Herbert Tec, Herbert Road, Bray, Co Wicklow, Ireland, “the Depositor”,
would like to deposit Multimodal Machine Learning for Intelligent Mobility, hereafter referred to as the “Work”, once it has successfully been examined in Loughborough University Research Repository Status of access OPEN / RESTRICTED / CONFIDENTIAL
Moratorium Period: 3 years 3 months ... years, ending 13 ... / Dec ... 2019 ... Status of access approved by (CAPITALS) ... Supervisor (Signature) ... School of: Loughborough University London ... Author's DeclarationI confirm the following:
CERTIFICATE OF ORIGINALITY
This is to certify that I am responsible for the work submitted in this thesis, that the original work is my own except as specified in acknowledgements or in footnotes, and that neither the thesis nor the original work therein has been submitted to this or any other institution for a degree
NON-EXCLUSIVE RIGHTS
The licence rights granted to Loughborough University Research Repository through this agreement are entirely non-exclusive and royalty free. I am free to publish the Work in its present version or future versions elsewhere. I agree that Loughborough University Research Repository administrators or any third party with whom Loughborough University Research Repository has an agreement to do so may, without changing content, convert the Work to any medium or format for the purpose of future preservation and accessibility.
DEPOSIT IN LOUGHBOROUGH UNIVERSITY RESEARCH REPOSITORY
I understand that open access work deposited in Loughborough University Research Repository will be accessible to a wide variety of people and institutions - including automated agents - via the World Wide Web. An electronic copy of my thesis may also be included in the British Library Electronic Theses On-line System (EThOS).
I understand that once the Work is deposited, a citation to the Work will always remain visible. Removal of the Work can be made after discussion with Loughborough University Research Repository, who shall make best efforts to ensure removal of the Work from any third party with whom Loughborough University Research Repository has an agreement. Restricted or Confidential access material will not be available on the World Wide Web until the moratorium period has expired.
- That I am the author of the Work and have the authority to make this agreement and to hereby give Loughborough University Research Repository administrators the right to make available the Work in the way described above.
- That I have exercised reasonable care to ensure that the Work is original, and does not to the best of my knowledge break any UK law or infringe any third party’s copyright or other Intellectual Property Right. I have read the University’s guidance on third party copyright material in theses.
- The administrators of Loughborough University Research Repository do not hold any obligation to take legal action on behalf of the Depositor, or other rights holders, in the event of breach of Intellectual Property Rights, or any other right, in the material deposited.
The statement below shall apply to ALL copies:
This copy has been supplied on the understanding that it is copyright material and that no quotation from the thesis may be published without proper acknowledgement.
Restricted/confidential work: All access and any copying shall be strictly subject to written permission from the University Dean of School and any external sponsor, if any.
Author's signature ... Date 13/12/2019 ...
user’s declaration: for signature during any Moratorium period (Not Open work):
I undertake to uphold the above conditions:
Abstract
Scientific problems are solved by finding the optimal solution for a specific task. Some problems can be solved analytically while other problems are solved using data driven methods. The use of digital technologies to improve the transportation of people and goods, which is referred to as intelligent mobility, is one of the principal beneficiaries of data driven solutions. Autonomous vehicles are at the heart of the developments that propel Intelligent Mobility. Due to the high dimensionality and complexities involved in real-world environments, it needs to become commonplace for intelligent mobility to use data-driven solutions. As it is near impossible to program decision making logic for every eventuality manually. While recent developments of data-driven solutions such as deep learning facilitate machines to learn effectively from large datasets, the application of techniques within safety-critical systems such as driverless cars remain scarce.
Autonomous vehicles need to be able to make context-driven decisions autonomously in different environments in which they operate. The recent literature on driverless vehicle research is heavily focused only on road or highway environments but have discounted pedestrianized areas and indoor environments. These unstructured environments tend to have more clutter and change rapidly over time. Therefore, for intelligent mobility to make a significant impact on human life, it is vital to extend the application beyond the structured environments. To further advance intelligent mobility, researchers need to take cues from multiple sensor streams, and multiple machine learning algorithms so that decisions can be robust and reliable. Only then will machines indeed be able to operate in unstructured and dynamic environments safely. Towards addressing these limitations, this thesis investigates data driven solutions towards crucial building blocks in intelligent mobility. Specifically, the thesis investigates multimodal sensor data fusion, machine learning, multimodal deep representation learning and its application of intelligent mobility. This work demonstrates that mobile robots can use multimodal machine learning to derive driver policy and therefore make autonomous decisions.
To facilitate autonomous decisions necessary to derive safe driving algorithms, we present an algorithm for free space detection and human activity recognition. Driving these decision-making algorithms are specific datasets collected throughout this study. They include the Loughborough London Autonomous Vehicle dataset, and the Loughborough London Human Activity Recognition dataset. The datasets were collected using an autonomous
platform design and developed in house as part of this research activity. The proposed framework for Free-Space Detection is based on an active learning paradigm that leverages the relative uncertainty of multimodal sensor data streams (ultrasound and camera). It utilizes an online learning methodology to continuously update the learnt model whenever the vehicle experiences new environments. The proposed Free Space Detection algorithm enables an autonomous vehicle to self-learn, evolve and adapt to new environments never encountered before. The results illustrate that online learning mechanism is superior to one-off training of deep neural networks that require large datasets to generalize to unfamiliar surroundings.
The thesis takes the view that human should be at the centre of any technological development related to artificial intelligence. It is imperative within the spectrum of intelligent mobility where an autonomous vehicle should be aware of what humans are doing in its vicinity. Towards improving the robustness of human activity recognition, this thesis proposes a novel algorithm that classifies point-cloud data originated from Light Detection and Ranging sensors. The proposed algorithm leverages multimodality by using the camera data to identify humans and segment the region of interest in point cloud data. The corresponding 3-dimensional data was converted to a Fisher Vector Representation before being classified by a deep Convolutional Neural Network. The proposed algorithm classifies the indoor activities performed by a human subject with an average precision of 90.3%. When compared to an alternative point cloud classifier, PointNet[1], [2], the proposed framework out preformed on all classes.
The developed autonomous testbed for data collection and algorithm validation, as well as the multimodal data-driven solutions for driverless cars, is the major contributions of this thesis. It is anticipated that these results and the testbed will have significant implications on the future of intelligent mobility by amplifying the developments of intelligent driverless vehicles.
Acknowledgements
First and foremost, I would like to thank my supervisors, Varuna De Silva and Ahmet Kondoz, for there unwavering support, invaluable research insights, ideas, good humour and help in times of crisis. It has been hugely rewarding being a member of the Insatiate of Digital Technologies, not least because of the fantastic team they have put together: thanks to everyone for the discussions, arguments, and adventures along the way!
My partner Sadhbh and my son Ruadhán deserve special recognition: I would not have made it this far without the two of them. They have made my time at Loughborough University London and our life on water more enjoyable. Finally, I would like to thank my family, who have been there to support me from the beginning, always encouraging me when I needed to escape from London, no matter how infrequently it was.
Monday, 4 May 2020 Jamie Roche
Contents
THESIS ACCESS CONDITIONS AND DEPOSIT AGREEMENT ... III
ABSTRACT ... V ACKNOWLEDGEMENTS ... VII LIST OF FIGURES ... XI LIST OF TABLES ... XVII LIST OF ABBREVIATIONS ... XVIII
CHAPTER 1 MULTIMODAL MACHINE LEARNING FOR INTELLIGENT MOBILITY ... 1
1.1INTRODUCTION ... 1
1.2CONTEXT &MOTIVATION ... 4
1.3OBJECTIVES ... 7
1.4CONTRIBUTIONS ... 8
1.5PUBLICATIONS ... 9
1.6THESIS OUTLINE ... 10
CHAPTER 2DATA-DRIVEN MACHINE INTELLIGENCE ... 12
2.1INTRODUCTION ... 12
2.2IMMINENT NERVOUS ACTIVITY A TEMPLATE FOR ARTIFICIAL INTELLIGENCE .. 14
2.2.1NEURAL PLASTICITY ... 15
2.3FUNDAMENTALS OF MACHINE LEARNING ... 17
2.3.1MACHINE LEARNING PARADIGMS AND METHODS ... 19
A.SUPERVISED LEARNING ... 21
B.SEMI-SUPERVISED LEARNING ... 22
C.UNSUPERVISED LEARNING ... 24
2.3.2REGRESSION &THE SUPPORT VECTOR MACHINE ... 25
A.SUPPORT VECTOR KERNEL ... 28
B.HYPERPLANES ... 29
2.3.3THE ARTIFICIAL NEURAL NETWORKS ... 29
A.FEEDFORWARD NEURAL NETWORKS ... 30
B.CONVOLUTIONAL NEURAL NETWORKS ... 31
C.ACTIVATION FUNCTIONS ... 36
D.LOSS FUNCTION ... 39
E.BACKPROPAGATION ... 40
2.4MULTIMODAL MACHINE LEARNING ... 41
2.5APPLICATIONS OF MACHINE LEARNING IN INTELLIGENT MOBILITY ... 42
2.6SUMMARY... 44
CHAPTER 3 ARCHITECTURE FOR AN INTELLIGENT MOBILE ROBOT ... 47
3.1INTRODUCTION ... 47
3.3INTELLIGENT MOBILITY DATASETS ... 52
3.3.1AUTONOMOUS VEHICLE DATASETS ... 52
3.3.2HUMAN ACTIVITY RECOGNITION DATASETS ... 54
3.4PROBLEM DEFINITION ... 56
3.5TECHNICAL PARAMETERS OF AN AUTONOMOUS PLATFORM ... 57
3.5.1PLATFORM &DATASET REQUIREMENTS ... 58
3.6AN AUTONOMOUS MOBILE ROBOTIC PLATFORM ... 60
3.6.1THE SENSING LAYER... 62
3.6.2THE APPLICATION LAYER ... 64
A.ULTRASOUND-BASED CONTROL ... 66
B.CAMERA-BASED CONTROL ... 67
C.OPERATOR-BASED CONTROL ... 67
3.6.3EXPERIMENTAL SETUP ... 71
3.7SENSOR DATA REPRESENTATIONS ... 73
3.7.1RGBDATA ... 73
3.7.2RGB-DDATA ... 74
3.7.3POINT CLOUD DATA ... 75
3.7.4ULTRASONIC DEPTH DATA ... 75
3.8DATA COLLECTION ... 76
3.8.1LOUGHBOROUGH AUTONOMOUS VEHICLE DATASET ... 77
3.8.2LOUGHBOROUGH HUMAN ACTIVITY RECOGNITION DATASET ... 81
3.9SUMMARY ... 84
CHAPTER 4 A SELF-EVOLVING FREE SPACE DETECTION MODEL ...86
4.1INTRODUCTION ... 86
4.2PROBLEM DEFINITION ... 87
4.2.1STATE-OF-THE-ART FREE SPACE DETECTION ... 88
4.2.2MOTIVATIONS AND REQUIREMENTS ... 89
4.3GEOMETRIC ALIGNMENT OF SENSOR DATA ... 91
4.4SELF-EVOLVING FREE SPACE DETECTION ... 93
4.4.1IMAGE BASED FREE SPACE DETECTION ... 96
4.4.2ULTRASOUND-BASED FREE SPACE DETECTION ... 96
4.4.3ONLINE ACTIVE LEARNING FOR FREE-SPACE DETECTION ... 97
4.5RESULTS AND DISCUSSION ... 98
4.5.1DATASET ... 98
4.5.2PERFORMANCE ... 100
A.ONLINE ACTIVE MLPERFORMANCE ... 102
B.DEEPLABV3+PERFORMANCE ... 103
4.5.3VISUAL RESULTS ... 104
CHAPTER 5 A MULTIMODAL FISHER VECTOR NETWORK FOR HUMAN ACTIVITY
RECOGNITION ... 109
5.1INTRODUCTION ... 109
5.2PROBLEM DEFINITION ... 111
5.2.13DPOINT CLOUD MACHINE LEARNING ... 112
5.2.2MOTIVATION AND CONTEXT ... 114
5.3POINT CLOUD REPRESENTATION LEARNING FOR ACTIVITY RECOGNITION ... 115
5.3.1OBJECT DETECTION NETWORK... 115
5.3.2GEOMETRIC ALIGNMENT OF SENSOR DATA ... 116
5.3.33DMFVCLASSIFICATION NETWORK ... 120
A.FISHER VECTORS ... 121
B.CLASSIFICATION OF FISHER VECTOR REPRESENTATION ... 122
5.4RESULTS AND DISCUSSION ... 123
5.4.1DATASET ... 124
5.4.2MFVNET PERFORMANCE ... 124
A.2DDETECTION NETWORK PERFORMANCE ... 125
B.3DCLASSIFICATION NETWORK PERFORMANCE ... 127
5.4.3POINTNET CLASSIFICATION NETWORK PERFORMANCE ... 128
5.4.4VISUAL RESULTS ... 129
5.4.5LIMITATIONS &COMPARISON ... 132
5.5SUMMARY... 134
CHAPTER 6CONCLUSION ... 135
6.1INTRODUCTION ... 135
6.2CONTRIBUTIONS ... 137
6.2.1ARCHITECTURE FOR AN INTELLIGENT MOBILE ROBOT ... 137
6.2.2ASELF EVOLVING FREE SPACE DETECTION MODEL ... 138
6.2.3 A MULTIMODAL FISHER VECTOR NETWORK FOR HUMAN ACTIVITY RECOGNITION ... 138
6.3BENEFITS AND IMPLICATIONS OF THIS RESEARCH ... 138
6.4FUTURE WORK ... 139
APPENDIX A:LBOROLDNAVDATASET SAMPLE ... 142
APPENDIX B: LBOROLDNHAR DATASET SAMPLE ... 143
APPENDIX C:TECHNICAL DRAWINGS ... 144
List of Figures
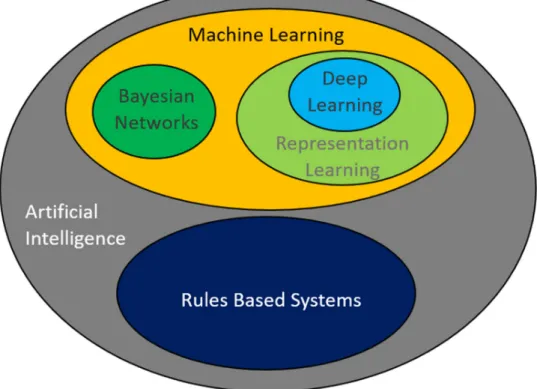
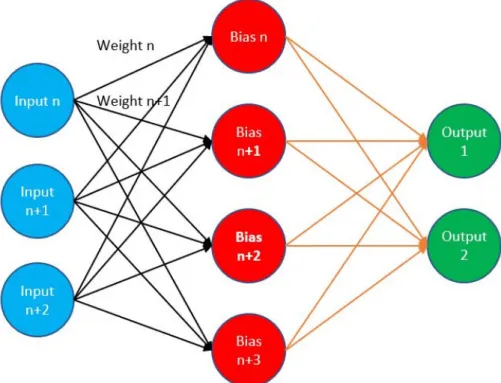
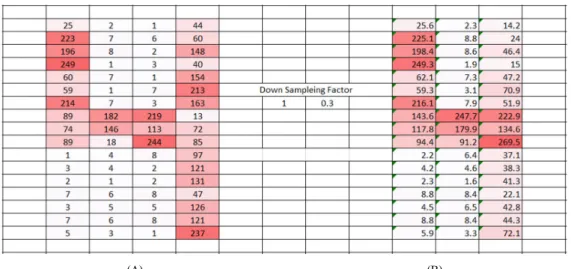
Figure 1: Two neurons side by side showing the Nucleus, Axon, Synapse, Dendrites, Neurotransmitters, and the Synaptic Cleft [71]. ... 13 Figure 2: Some different terms commonly used in AI, Rules-Based Systems, ML Representation Learning, DL and Bayesian Networks. ... 18 Figure 3: Three ML paradigms discussed in this chapter. Most of the research in this thesis is focused on supervised learning with a small diversion into semi-supervised learning. ... 20 Figure 4: Shows the process of online active ML. At first, the algorithm uses little data to make a classification. As a new instance is observed, the active Learning algorithm queries it. The online Learning Algorithm updates the Classifier. ... 23 Figure 5: Shows linearly separable data, a decision boundary, Support Vectors, and the Margin. In this case, the data falls into one of two Classes. ... 27 Figure 6: Shows a feedforward neural network is an ANN in which connections between the nodes do not form a cycle. The feedforward neural network was the first and most straightforward type of artificial neural network. ... 30 Figure 7: (a) Showing the Red layer of the true colour image of the number four. (b) Shows the flattening of the layer out into a single array lining up one column after another. ... 31 Figure 8: (a) Shows the original data of image four. (b) Shows the reduced horizontal dimensions of the image data still retains the spatial arrangement. ... 32 Figure 9: (a) & (b) Show the image data after having been acted on by the down sampling factor (1 0.3) and (0.5 1), respectively. In both cases, the dimensionality has reduced the image data from a 17 by 4 matrix to a 17 by 3 matrix. ... 33 Figure 10: (a) Shows the original image of the number four. (b) Shows the same image with the down sampling factor acting on both the horizontal and vertical data points. Note the overall reduction in dimensionality on the image. ... 34 Figure 11: The generalized architecture of a CNN showing the three main elements of CNN; Convolutional Layers, Pooling Layers, and the Output Layer. Note the process that occurs between the different layers of the network [152]. ... 35
Figure 12: Shows the down sampling process when using a Max Pooling layer filter with
dimensions of 2 by 2 acting on a 4 by 4 sample of data from an image representation. ... 35
Figure 13: Shows the Binary Step activation function [157]. ... 36
Figure 14: Shows the Bipolar Step activation function [157]. ... 36
Figure 15: Shows the Sigmoid activation function [160]. ... 38
Figure 16: Shows the ReLU activation function [161]. ... 38
Figure 17: The Regression Loss, Binary Classification, Multi-class Classification loss function and their subdivisions [167]. ... 39
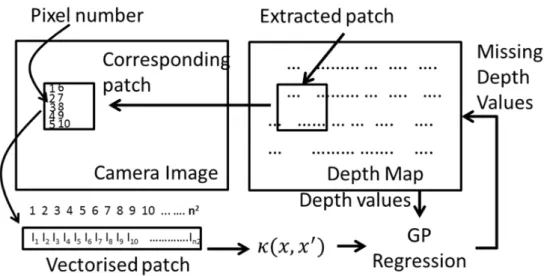
Figure 18: Shows the sequence of steps in the Gaussian process resolution matching algorithm. On the left side of the image is the high-resolution camera data, and on the right is the lower resolution LiDAR data [116]. ... 42
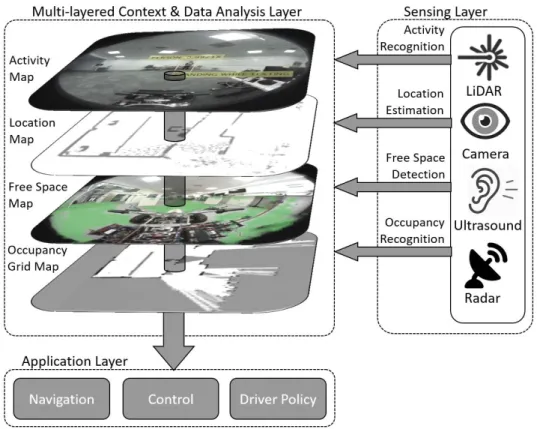
Figure 19: Shows the scalable, multi-layer context mapping and recognition system for the autonomous platform. They are depicting the sensing layer, a multi-layered context representation, the data analysis layer, and the application layer. ... 57
Figure 20: Loughborough University London autonomous platform indicating the location of the range and optical sensors used to collect the LboroLdn AV and LboroLdnHAR datasets. The Kinect sensor, missing from this image, is positioned on the handlebar. ... 61
Figure 21: Proposed framework for the platform showing the controllers, actuators, depth, optical, and telemeter sensors. All-optical and proximity data was logged to the laptop. Telemetry data was timestamped and logged to an SD card. ... 62
Figure 22: Steering assembly showing both servos motors the right and left tie rods linking to the handlebars. The link to the handlebars is through an additional two tie rods. Both servo motors are driven from the same signal – PWM – from the Arduino. ... 65
Figure 23: Shows the ultrasonic sensor array assembly, detailing the six HC-SR04 ultrasonic sensors and a section of the autonomous platform headset. The HC-SR04 were at an angel of 5°, 25°, and 45° either side of the longitudinal axis. ... 65
Figure 24: Ultrasound collision avoidance dictates navigation and driver policy for the autonomous platform for data collection. Decisions are hard programmed based on the proximity of objects relative to the ultrasonic sensor array. ... 66
Figure 25: The ultrasound-based control architecture for collision avoidance. Objects within the range are logged and acted upon, influencing the driver policy of the platform. ... 68 Figure 26: The camera-based control architecture for colour detection. Currently, the platform understands the colour of red green and amber. ... 69 Figure 27: The operator-based control architecture for manual override. The user is the only element of driver policy that exerts control over the collision avoidance policy – in the ultrasounds-based controller – and the colour governance in the camera-based controller. .. 70 Figure 28: Platform setup indicating the location of the sensors relative to the front axle. The location of each sensor is measured relative to the ground and the front axle of the platform. Except for the Wansview cameras, all sensors were on the centreline. ... 71 Figure 29: Platform setup indicating the horizontal FoV of the radar, the LiDAR, and the ultrasonic sensor array. The LiDAR provides midfield depth data, the radar provides far-field depth data, and the ultrasonic sensor array provides near filed depth data. ... 72 Figure 30: The primary data collection routes were traversed between 28th May 2018 and to 1st October 2018, and 1st November 2019 to 30th January 2020. The traversable distance was a total of 1.2 km over four different locations, Route 1 Lesney Avenue, Route 2 BT ... 77 Figure 31: Montage of six images taken on 28th May 2018, illustrating the diverse range of buildings and short-term lighting changes encountered by the platform. ... 79 Figure 32: Illustrates two different views from a single location under different environmental condition. Note environmental conditions are limited for this release of the dataset as most of the data was logged over the summer months. ... 80 Figure 33: Traversals for different environmental conditions for the LboroLdnAV dataset. Factors influencing the route, include events on campus and driver policy. The license and permits were granted for three months between 28th May and 1st October 2018. ... 80 Figure 34: The layout of furniture and the position of the autonomous platform during the collection of the LboroLdnHAR dataset. The data was collected throughout the 17th and 18th August 2018. In both cases, the subjects start and finish the activity with a T pose. ... 82 Figure 35: Montage of 6 images taken on 17th and 18th August 2018. The images illustrate six of the different activities performed during the data collection period. Carrying a box, pushing a board, running, sitting at a desk, standing, and walking while texting. ... 83
Figure 36: Illustrates the plan view of the sensor setup showing the location of the ultrasonic sensor Array and the wide-angled 360Fly camera. It should be noted that a denotes the range between the ultrasonic sensor array and the object, it is not the perpendicular distance. ... 91 Figure 37: Illustrates the elevated view of the sensor setup showing the location of the ultrasonic sensor array and the wide-angled 360Fly camera. ... 91 Figure 38: The proposed FSD pipeline. We first train an SVM on a small quantity of data. As new data becomes available, we quarry the robust sensor stream as to is class. ... 93 Figure 39: The proposed framework for FSD utilizing supervised and semi-supervised ML. This technique uses online active ML methods to self-learn free space and evolve as it encounters new data. ... 94 Figure 40: Shows the results of the ultrasound OGMap matching Scenario 1 in Figure 41. In this image, the white rays emanating from the testbed’s position at the zero coordinates correspond to free grid points, while the black grid points indicate occupied space. ... 97 Figure 41: A subset of the data used during the comparison between the proposed framework and Deep LabV3+. From the top left corner: (a) Scenario 1, (b) Scenario 2, (c) Scenario 3, (d) Scenario 4, (e) Scenario 5, (f) Scenario 6, (g) Scenario 7, (h) Scenario 8, (i) Scenario 9 and (j) Scenario 10. Scenario details reported in Table 10. ... 99 Figure 42: Confusion Matrix for the online active ML framework. The diagonal cells indicate true positives correctly classified. The off-diagonal cells indicate false positives that are incorrectly classified ... 103 Figure 43: Confusion Matrix for DeepLabV3+ framework. The diagonal cells indicate true positives correctly classified. The off-diagonal cells indicate false positives that are incorrectly classified. ... 104 Figure 44: Visual results of the Semi-supervised and Fusion approaches to FSD and DeepLabv3+ FSD. From the top-down. Scenario 1, Scenario 2, Scenario 3 and Scenario 4. Table 16 details the scenarios depicted in Figure 44. Images in the first column indicate the output of the proposed self-evolving FSD framework. Images in the second column indicate the output of DeepLabV3+. ... 106 Figure 45: Depicts the MfV Net HAR pipeline. Given RGB data, we first detect a subject and generate an ROI. Each RGB ROI is translated and aligned onto the 3D point cloud. The
corresponding 3D ROI is then passed onto the classifier before deciding what activity is being performed. ... 111 Figure 46: Shows the PointNet Architecture. The classification network takes n points as input, applies input and feature transformations, and then aggregates point features by max pooling. The output is classification scores for k classes. The segmentation network is an extension to the classification net to facilitate the segmentation the components that construct the object its classifying [1]. ... 113 Figure 47: The proposed HAR architecture. They are depicting all the elements in the Multimodal Fisher Vector Network. We first leverage the power of a CNN to detector objects and propose an ROI. The geometrically aligned and translated Point Cloud data allows us to identify the corresponding 3D ROI in the 3D sample. This segmented ROI is converted into a modified FV representation before being passed onto the classification network. The resultant class is overlaid on the object detector image proposed by the object detector network. .... 115 Figure 48: Illustrates the plan view of the setup showing the position of the Kinect and LiDAR sensors relative to the autonomous platform. ... 117 Figure 49: Illustrates the elevation view of the setup showing the position of the Kinect and LiDAR sensors relative to the autonomous platform. ... 117 Figure 50: Illustrates the plan view of the setup showing the position of the RGB and LiDAR sensors relative to the LboroLdn autonomous testbed. ... 118 Figure 51: Illustrates the elevated view of the setup showing the position of the RGB and LiDAR sensors relative to the LboroLdn autonomous testbed. ... 118 Figure 52: (a): A Scenario showing the subject carrying a box. Overlay with the 2D ROI, the translated and aligned Point Cloud data. (b) Shows the Point Cloud data with corresponding 3D ROI overlay. ... 120 Figure 53: Shows three 2D points superimposed on a 2D Gaussian on the left of the image. In the centre of the image is the FV, and on the fight is the FV representation for the three points. The vector in the centre of the image indicates the rate of curvature for the data. ... 121 Figure 54: (a) Shows the spherical Gaussians superimposed on the Point Cloud data. (b) Shows the modified FV representation of the GMM for the Point Cloud data ... 122
Figure 55: The average precision of the object detector portion of the proposed framework showing the trade-off between precision and recall. A high area under the curve represents both high recall and high precision – as we can see here... 126 Figure 56: The log–average miss rate of the object detector portion of the proposed framework indicating the quality of detection of the object detector. ... 126 Figure 57: Confusion matrix for the 3D classifier portion of the proposed framework. The diagonal cells indicate true positives correctly classified. The off-diagonal cells indicate false positives that are incorrectly classified. ... 128 Figure 58: Confusion matrix for PointNet. The diagonal cells indicate true positives correctly classified. The off-diagonal cells indicate false positives that are incorrectly classified. .... 129 Figure 59: A subset of the data used to assess the visual performance of the proposed MfV Net. From the top: Scenario 1, Scenario 2, Scenario 3 and Scenario 4. Table 19 details the scenarios depicted in Figure 59. Images in the first column indicate the output of the Object Detector. The centre column shows the segmented Point Cloud data. The final column shows the output of the network and the associated class identified for the activity being performed. ... 131 Figure 60: Montage of 48 traversals of the same location on 22nd May 2018, illustrating the diverse range of images, short-term lighting and weather changes encountered by the testbed when collecting the LboroLdnAV dataset. ... 142 Figure 61: Montage of 48 scenarios performed by different subjects captured on 17th June 2018 and 18th June 2018, illustrating the diverse range of activities in the LboroLdn HAR dataset. ... 143 Figure 62: Isometric View of the Autonomous Platform showing the quad bike chassis, electronic rack, ultrasonic array, steering assembly and MSI laptop. ... 144 Figure 63: Shows the ultrasonic sensor array. Top left showing side elevation. Top right showing the isometric view. Bottom Left showing plan view. Bottom right front elevation. ... 145 Figure 64: Shows the Steering assembly. Top left showing side elevation. Top right showing the isometric view. Bottom Left showing plan view. Bottom right front elevation. ... 146 Figure 65: Shows the Power Electric Rack. Top left showing side elevation. Top right showing the isometric view. Bottom Left showing plan view. Bottom right front elevation. ... 147
List of Tables
TABLE 1:REVIEWED AV DATASETS ... 53
TABLE 2:REVIEWED HARDATASETS... 55
TABLE 3:PROXIMITY SENSORS SUMMARY ... 63
TABLE 4:OPTICAL SENSORS SUMMARY ... 63
TABLE 5:TELEMETRY SENSORS SUMMARY ... 63
TABLE 6:DESCRIPTION OF THE LBOROLDNAVDATASET ... 79
TABLE 7:SUMMARY STATISTICS FOR THE LBOROLDNAVDATASET ... 79
TABLE 8:DESCRIPTION OF THE LBOROLDNHARDATASET ... 82
TABLE 9:SUMMARY STATISTICS FOR THE LBOROLDNHARDATASET ... 82
TABLE 10:SCENARIO DETAILS DEPICTED IN FIGURE 41 ... 99
TABLE 11:SEMANTIC SEGMENTATION NETWORKS MEAN IOU ... 101
TABLE 12:DATASET METRICS FOR THE ONLINE ACTIVE MLFRAMEWORK ... 102
TABLE 13:CLASS METRICS FOR THE PROPOSED ONLINE ACTIVE MLFRAMEWORK ... 102
TABLE 14:DATASET METRICS FOR DEEPLABV3+... 103
TABLE 15:CLASS METRICS DEEPLABV3+ ... 103
TABLE 16:SCENARIO DETAILS DEPICTED IN FIGURE 44 ... 105
TABLE 17:2DDETECTION NETWORK PERFORMANCE ... 125
TABLE 18:3DCLASSIFICATION NETWORK PERFORMANCE ... 127
TABLE 19:POINTNET CLASSIFICATION NETWORK PERFORMANCE ... 129
List of Abbreviations
AV ... Autonomous Vehicle AVSR ... Audio Visual Speech Recognition DL ... Deep Learning DMV ...Department of Motor Vehicles DUC ... Dense Up-sampling Convolution EKF ... Extended Kalman Filter ERC ... European Research Council ESR ... Electronic Scanning Radar FMCW ... Frequency Modulated Continuous Wave FoV ... Field of View FPS ... Frames Per Sec FSD ... Free Space Detection FTN ... Flock Traffic Navigation FV ... Fisher Vector GMM ... Gaussian Mixture Model GNSS ... Global Navigation Satellite System GPU ... Graphical Processing Units GUI ... Graphical User Interface HAP ... Human Action Prediction HAR ... Human Activity Recognition HD ... High Definition HDC ... Hybrid Dilated Convolution HFoV ... Horizontal Field of View HOG ... Histogram of Oriented Gradients
HRI ... Human-Robotic Interaction HSV ... Hue Saturation and Variance IMU ... Inertia Measurement Units IoT ... Internet of Things IoU ... Intersection Over Union IP ... Internet Protocol IR ... Infra-Red ITS ... Intelligent Transport Systems LboroLdnAV ... Loughborough London Autonomous Vehicle LboroLdnHAR ... Loughborough London Human Activity Recognition KITTI ... Karlsruhe Institute and Toyota Technological Institute LDR ... Light Dependent Resistor LiDAR ... Light Detection and Ranging LUTZ ... Low-carbon Urban Transport Zone MfV Net ...Multimodal Fisher Vector Network ML ... Machine Learning MSI ... Micro-Star International NHTSA ... National Highway Transportation and Safety Administration OGMap ... Occupancy Grid Map NTU ... Nanyang Technological University PNAS ... Proceedings of the National Academy of Sciences PWM ... Pulse Width Modulation RANSAC ... Random Sample Consensus RBF ... Radial Basis Function ReLU ... Rectifier Linear Unit RF ... Radio Frequency
RGB ... Red Green Blue ROI... Region of Interest RPM ... Revolutions Per Minute RPN ... Region Proposal Network SAE ... Society of Automotive Engineers SD ... Secure Digital SLAM ... Simultaneous Localization and Mapping SVM ... Support Vector Machine TfL ... Transport for London VFoV ... Vertical Field of View VIAC ... VisLab Intercontinental Autonomous Challenge VW ... Volkswagen
Chapter 1 Multimodal Machine Learning for
Intelligent Mobility
1.1 Introduction
Artificial Intelligence (AI) and Machine Learning (ML) have been used to beat masters at chess, poker aficionados and Go grandmasters – one of the world's most complex games [3], [4]. IBM Watson has even won the Gameshow Jeopardy, and now a different version of Watson has been trained to design personalized cancer treatments for patients [5]. AI is the development of algorithmic systems capable of performing tasks that typically require human intelligence [6]. ML, on the other hand, is a subset of AI in which computers uses big data to learn how to do a particular task [6]. Both AI and ML are used to do things that humans have spent many years perfecting, and the machines are beating us hands down. However, as good as we are at teaching AI to perform complex tasks, we are terrible at getting machines to learn even the most basic, childlike skills [4], [7].
Moravec's Paradox1 is the problem of being able to perform complex tasks but not
simple ones. Named after Hans Moravec, who studied this issue in the 1980s, he seemed to
1 Moravec Paradox states that, contrary to popular believe, high-level reasoning requires less computation than low-level unconscious cognition. [8]
have a pretty straightforward solution – make a program that thinks like a child [8]. On the most basic level, this is Moravec's Paradox. We do not know how to program general intelligence, although we are great at getting AI to do a singular task. For example, most toddler level skills, such as facial recognition, involves learning new things before transferring them to another context. Getting a computer to do this is a primary goal of AI, we called this concept, Artificial General Intelligence (AGI).
In 1988 Hans Moravec said that evolution is the reason it is so hard to achieve AGI [8]. His point was that the things that seem easy for us are the result of thousands of years of evolution. So even though most kids can quickly tell the difference between blue and yellow, a friend and a stranger, these are not simple skills. They only seem simple to us because our species have spent thousands of years refining them.
For example, learning to drive, one will always remember the early experiences of being behind the wheel. Whether it is memories of the driving instructor, the first lesson, theory or practical test, the memory is pronounced. The habits humans form, or driver policy we develop are a direct result of the rules of the road, and the experience gained. These rules are not instructions on how to behave but rather a group of statutory instruments setting out what one may or may not do. While this is sufficient to get started, it is only through the experience of driving on the road that one develops a policy to which we adhere. Of course, we can all agree that learning to drive is a trailing experience; however, Moravec theorized that it is not as difficult as learning to talk, walk, or understand the terrain around us.
This is no different for Intelligent machines where driver policy refers to the decision-making capability of the vehicle under various situations. The goal is to solve complex tasks consisting of high dimensional data input. Unfortunately, it has proven hard to construct sophisticated agents that are capable of driving a vehicle with human-like performance [9]. Although these agents can perform specific tasks very well, they cannot perform a range of functions.
Part of the problem is that computer science is relatively young, and the study of AI is even younger! Therefore, it is ambitious to think humans would have figured out AGI already. Then again, Moravec did not believe this was the only issue; he also thought that researchers were approaching the problem the wrong way [8]. In the 1980s, researchers into AI were mainly working from the top-down, trying to copy the mental process of fully formed human brains [10]. Moravec believed that the most successful approach would be to work
from the bottom up. In other words, instead of building a complex brain from scratch, he thought that machines should mimic evolution.
Like nature, Moravec thought it best to start small and then add complexity to the system, all the while challenging these systems to adapt. Moravec, amongst others, thought how the human brain performs tasks could be studied and then applied to machines [10], [11]. Self-evolution is what happens in online active learning [12], [13], where the machine queries new data as it comes in before reforming its understanding of what is its seeing. Moravec’s theory appears to be a solution that works, and the more that researchers base their AI on the human brain, the smarter these machines will get.
Although Moravec’s paradox was conceived 30 years ago, it is still very relevant today. For example, the current state-of-the-art in AI is excellent at solving “narrow” competencies or singular tasks, humans, on the other hand, are good at pretty much everything [14]. In an interview, Dr Sean Holden of Cambridge University stated that “Most AI researchers don’t try to solve the whole problem because it is too hard. They take some specific problem and do it better” [14]. Dr Holden is not alone in this thinking. In [15], researchers reported on the fact that the majority of the application of AI in today’s workplace uses virtually no abstract thought. Workers in positions that work to a fixed set of rules are being replaced at an astonishing rate [16]. Conversely in the creative industries, where abstract thought is prerequisite, peoples livelihood are as secure as they ever have been [16].
Neural networks are systems that can teach themselves to recognize patterns – they are modelled on the way human brains learn. When something new is learned, our brain strengthens the connection between neurons [17]. It does this by adding more connection so that the brain can process more signalling molecules. Over time these connections develop and grow stronger and will, in all likelihood, stay this way for some time. The connection can get overwritten with something more helpful. Neural networks mimic the circuits in the human brain [4]. They start with some basic framework about how to do a task. Then they practice that task with labelled test data to refine and optimize the connection between artificial neurons [18]. As a tool, Neural Networks are not perfect – they can only perform the task, they trained for, and the connections they form, adjust every time they re-train [19]. However, they are a big step towards AGI [20], although fully operational AGI is quite some distance away.
One approach to solving this problem takes inspiration from the way the human brain does not just use whatever neurons are available [21]. Instead, it activates different sets of neurons for different tasks and leaves some neurons alone [22], [23]. This process is achieved
using Dropout – where some neurons in the Neural Network are switched off – or an activation function that only responds to specific values. In a 2018 study published by Proceedings of the National Academy of Sciences (PNAS), researchers showed that it was possible to do this in a Neural Network too [24]. Making one task activate one set of neurons, and another task activate another. By combining this approach with previous research methods, these researchers were able to program a Neural Network that achieves 90% accuracy on over 500 different tasks [23]. The greater understanding we attain about the method in which these networks refine connections, the better this branch of AI is going to get at preforming various tasks. The challenge is getting the system to learn from more than just one example.
Not every task in ML has a massive dataset for a network to sort through; if a program is going to think like a human, it must start grasping the rules that govern it. While some tasks can be solved using big data, some must be learned from a relationship linking to data types. While it might not seem as obvious, these systems take design cues from our brains. When a system is learning from a robust sensor stream, it can help us deduce what another sensor sees. By building similar systems in AI, we hope to encourage the systems to keep learning and adapting their understanding of the surroundings [25].
A program with general intelligence should be able to process multiple kinds of data sources and be able to learn new rules. As well as taking advantage of data sources, AGI should be able to take advantage of multiple ML algorithms that perform different tasks that contribute towards a single goal [26]. Multimodal ML is a multi-disciplinary research field with one of its earliest application in the field of Audio-Visual Speech Recognition (AVSR) [27]. Similar to sensor data fusion in the sense that it uses multiple sensor modalities, Multimodal ML uses multiple ML algorithms, either in parallel or in series to improve performance [28]. While not quite AGI, this process allows different ML algorithm to perform multiple tasks in a similar way to people. Multimodal ML helps one modality to affect the identification of another modality, allowing use of complementary data [26].
1.2 Context & Motivation
Intelligent mobility is one of the most relevant applications of AI. Frequently used in many different sectors from Agriculture [29] to Medicine [30] and Finance [31], it is likely to have the greatest impact on the transport sector in the short-term [32]. Worldwide there is an average of 3,300 road deaths a day. In the UK alone, over the 11 years, from 1999 to 2010,
there were more than 3 million road traffic incidents [33]. In 2015 Transport for London (TfL) reported 25,193 casualties took place at signal-controlled urban junctions [34], [35].
Increasing degrees of automation – from semi-manual to fully computer-controlled vehicles – already exist or are being added to vehicles to improve safety, reduce the number of driver tasks, and improve fuel efficiency. The technology and sensors integral to self-driving, or vehicle autonomy, already impact the way humans drive. Some believe that as Autonomous Vehicle (AV) or robots become ubiquitous, traffic incidents and fatalities will reduce [36], [37]. While it is possible to distinguish between the different systems – driverless car, AV, or Intelligent mobile platform – they are in effect all robots. To that end, these terms are used interchangeably throughout this research.
Autonomous driving technology has developed at a rapid pace, and will, with all probability, continue to do so for the foreseeable future. Already, the first steps towards hands-free driving are evident, for example, Parking Assist by Volkswagen (VW) and Parktronic by Mercedes-Benz [38], [39]. While the majority of the sensor technologies used in automation are well-established – Light Detection and Ranging (LiDAR), Near Field Vision, Radar, and ultrasonic rangefinders – they primarily function independently, triggering a response rather than making decisions based on the data they observe [38], [39]. Fusing the sensor data used in such technologies should enable autonomous robots to create multi-layered virtual maps with real-time context information. From these real-time virtual maps, the robots can make more holistic decisions.
Given the high dimensionality and complexity of optical sensor data, it is crucial to examine ML algorithms to continue the progress already made in Intelligent mobility. Deep Learning (DL) – a subset of ML – is one approach to solving problems in this field using enormous datasets. Principally, data is passed through a function-approximator using a deep multi-layer Neural Network to learn features and make a classification [40]. DL has gained much notoriety because of two significant advancements. Firstly, improvements in hardware, specifically Graphical Processing Units (GPU), have facilitated computers to increase the bandwidth and quantity of data they process. Secondly, the availability of more and more large-scale labelled datasets – which are used for training and verification of feature learning networks. That is not to say that DL is flawless. Some significant shortcomings are limited knowledge about the internal workings of Neural Network [41] and sufficient amounts of training data [42], [43]. When either of these scenarios are met the network becomes unreliable and prone to errors.
Contrary to this, humans, or more specifically infants, have innate knowledge upon which they build their understanding of the world. This intuition helps them voraciously learn and adapt to situations never encountered. Many scientists working in the field of AI argue that most human skills are learned, and therefore machines can learn them without the need for pre-loaded rules [44]. But lately, there are a growing number of researchers attempting to encode machines with a bit of common sense [45], [46].
The latest trend in ML is DL. Deep Neural Networks – a collection of simple function-approximators – loosely modelled on neurons in the brain, adjust weights and bias as they are presented with more and more data. The results are astonishing, and credit where credit is due, Deep Neural Networks can perform remarkable tasks. From facial recognition [47] to classifying human activity [48], these networks produce incredible results. However, Neural Networks require thousands of training samples to identify the necessary features to form the associations needed to make a classification. Even then, they can produce some embarrassing errors and dangerous mistakes [49]. For example, ML algorithms can play classic Atari games like space invaders with superhuman skills. But by adding one or two random pixels to the playing screen, the player's avatar becomes a sitting duck [50]. By comparison, an infant can see an image once and instantly recognize it in another context.
Different research groups are trying to categorize human instinct before encoding into AI [51]. These frameworks sit somewhere between pure ML and hard programmed systems. One research team developed ML algorithms that emulate interaction networks [52]. Interaction Networks embed a rule that relationships exist between objects. For example, researchers in [53] embedded some basic knowledge about relationships before getting a Neural Network to segment the region of an image containing specific geometric shapes. Like the way a baby parses the world into groups with some underlying knowledge, or how they use a sense, like touch, to learn about something. In tests, once the ML algorithm learned physical properties like gravity and the specific relationships to a falling string, its ability to predict its behaviour increased dramatically [48]. While human-like AI is a little way off, these latest attempts to artificially reproduce common sense bring closer the possibility of creating machines that can fully interact with the world the way humans do, machines that start as an infant and progress to learn like a child.
1.3 Objectives
Traditional methods used in computer science require manual programming of specific tasks; however, for real-world perception tasks, this is not always possible. This is especially the case in computer vision, such as object or scene recognition. Of course, we have some well-defined problems, such as edge detection, and some that are more challenging, such as recognizing intricate relationships between different elements in an image [52]. In general terms, ML is a technique or a set of methods for automated analysis of structure in data [54]. It can be broken down into three learning paradigms, Unsupervised Learning, Semi-Supervised Learning and Semi-Supervised Learning. ML is very similar to data mining, but the focus is more on autonomous machine performance, rather than enabling humans to learn patterns from the data [55].
While there have been significant developments in ML, monumental challenges remain to enable real-world engineering systems to be enriched with data-driven systems. For example, most of the DL systems require massive amounts of data to achieve adequate generalization capability. In some instances, collecting enormous amounts of data is practically impossible. On the other hand, many critical engineering systems require multiple layers of safety, before new data-driven algorithms are assimilated into their operation, and most importantly, before the human operators can be replaced. Despite recent developments, ML is far from reaching the level of human perception and cognitive ability we hold. We can define perception as the interpretation of data to make a decision, and cognition as wisdom, or knowledge of an occurring event. In the medium to short-term, human intelligence must be the benchmark to compare the performance of ML algorithms. Hence it needs to be at least as good as humans are at preforming perception and cognitive tasks [56]–[58].
Intelligent mobility is the use of advanced technology to improve the way humans and objects are mobilized. The AVs that drive without the need for human intervention is a vital element of Intelligent mobility. The AVs will be one of the first mass-market application of intelligent robotics in the world. Broadly speaking, the objectives of the research fall under perception tasks and cognitive skills. For example, Free Space Detection (FSD), one of the contributions of this research, is a perception task, which is the detection of traversable space for an AV and largely regarded as a cornerstone of automated driving and human locomotion [59], [60].
On the other hand, robots such as AV should be aware of humans around it before making decisions. Human Activity Recognition (HAR), another contribution of this research, is a cognitive skill that classifies well-defined movements of a human agent to determine what activity they are performing [61]. This leaves us with a vast scope to address, and many problems to solve, if we want to apply ML to Intelligent mobility, and most importantly if we were to make AVs intelligent like humans.
Specifically, the high-level research objectives of this thesis are:
1. To design and develop a data collection mechanism to investigate a wide spectrum of environments that are to be catered by Intelligent mobility applications, such as indoor spaces and pedestrianized areas. 2. To explore ML algorithms that are capable of adapting to new
environments and data streams with little or no training.
3. To investigate methods of leveraging multiple heterogeneous data streams (multimodal sensor data) to make robust decisions in safety-critical autonomous systems.
The hypothesis of this research is to see if: it is possible to make autonomous systems safer and more intelligent with algorithms that are capable of adapting to new environments by leveraging multiple heterogeneous data streams to make robust decisions.
1.4 Contributions
To achieve the objectives listed above, this thesis presents multiple contributions to the academic literature. The contributions specifically focus on the autonomous (driverless) vehicle technology, and all the experiments and discussions are based on several applications of Intelligent mobility. The participation of this thesis are as follows:
1. Throughout the course of this research and in the quest to prove the research hypothesis, many datasets were reviewed. These datasets were deemed unsuitable for the project’s requirements because they lacked the correct sensor data modality, did not log data from unstructured surroundings or were recorded in outdoor environments. Therefore, a means of collecting specific data was needed. The first contribution of this thesis is to develop an autonomous platform as an open-source
experimental framework for data gathering, sharing, and experimental validation for driverless vehicle technology.
2. Using the autonomous platform, we developed two novel multimodal datasets collected with data-driven algorithm development and experimental validation in mind. Firstly, the Loughborough London Autonomous Vehicle (LboroLdnAV) Dataset is a dataset gathered from unstructured indoor and pedestrianized outdoor environments, annotated with 7 object classes collected using seven different perception sensors. Secondly, the Loughborough London Human Activity Recognition (LboroLdnHAR) Dataset is a Multimodal open-source dataset collected indoors, using three different sensors and annotated with 9 classes of human activity
3. A self-evolving FSD algorithm is developed, which leverages the relative uncertainty of different sensors as a utility to automatically label new data (active learning) and re-learn the data-driven model whenever new data streams are encountered (online learning).
4. Knowing what human agents are doing in their environment is crucial for safe decision-making by AVs. A Multimodal Fisher Vector Network, which is a type of deep CNN, is proposed as a new methodology for the classification of different human activities leveraging both Red Green Blue (RGB) camera data and the Point Cloud data that are gathered from LiDAR sensor.
1.5 Publications
Several publications in peer-reviewed conferences and journals have been made as a result of the contributions presented in Section 1.4. The following are the journal articles or conference papers that are about to be published or currently under review and directly influenced this thesis:
1. ROCHE, J., DE SILVA, V., KONDOZ, A., 2019. A Multimodal Perception Driven Self-Evolving Autonomous Vehicle. IEEE Trans Cybernetics. 2019 (Resubmitted for Review April 2020).
2. ROCHE, J., DE SILVA, V., HOOK, J., MOENCKS, M., KONDOZ, A., 2019. Multimodal Modal ML for Human Activity Recognition with Applications to Intelligent Mobility. IEEE Trans. on Industrial Informatics 2020 (Submitted May 2020).
The following are the journal articles and conference proceedings that are published, co-authored and partly influenced this thesis:
1. DE SILVA, V., ROCHE, J., KONDOZ, A., 2018. Robust fusion of LiDAR and wide-angle camera data for autonomous mobile robots. Sensors, 18 (8), 2730.
2. DE SILVA, V., ROCHE, J., SHI, X, KONDOZ, A., 2018. IoT driven ambient intelligence architecture for indoor Intelligent mobility. IEEE 4th Intl Conf on Big Data Intelligence and Computing and Cyber Science and Technology Congress Athens, Greece, 12-15 August 2018, pp.451-456.
3. MOENCKS, M., DE SILVA, V., ROCHE, J., & KONDOZ, A., 2019. Adaptive Feature Processing for Robust Human Activity Recognition on a Novel Multimodal Dataset. ArXiv, abs/1901.02858., in Robotics and Autonomous Systems (Resubmitted for Review March 2020).
The final publication list is aconferance paper that contributed little to this thesis other than some cross over areas of the relevant review material:
1. ROCHE, J., DE SILVA, V., KONDOZ, A., 2018. A cognitive framework for object recognition with application to autonomous vehicles. IN: IEEE Computing Conference, London, United Kingdom, 10-12 July 2018.
1.6 Thesis Outline
The organization of this thesis is as follows. The current chapter introduces the context, motivation, and objectives of this thesis, as well as the original contributions.
Chapter 2 provides background into the biological fundamentals of nervous activity in the human brain, before presenting a review of the fundamentals of ML, Multimodal ML and applications of ML in Intelligent mobility.
Chapter 3 presents research on a perception driven AV for data collection. In this Chapter, the current available AV and HAR datasets are reviewed. The requirements for the development of the test platform and the experimental setup are set out. Finally, this chapter finishes with a description of the sensor data representation and the datasets gathered during this research – LboroLdnAV dataset & LboroLdnHAR dataset.
Chapter 4 presents research on a self-evolving FSD model. In this chapter, the problems with the current state-of-the-art in FSD are identified, followed by an explanation of the geometric alignment of the sensor data representations. Immediately after this, the algorithmic frameworks for FSD are presented with an explanation of the different learning paradigms used in this process. Finally, Chapter 4 finishes off with some results of the proposed framework before moving on to a summary of the findings.
Chapter 5 presents research on a 3-Dimension (3D) Multimodal Fisher Vector Network (MfV Net) for HAR. In this chapter, problems with the current state-of-the-art in HAR are identified, followed by an explanation of the geometric alignment of the sensor data. Immediately after this, the algorithmic framework for HAR is presented with an explanation of the different methods of representation learning. Chapter 5 finishes off with some results of the proposed network before moving on to a summary of the findings.
Chapter 6 concludes this thesis and presents some suggestions for future work. Appendix A details the LboroLdnAV Dataset, while Appendix B details the LboroLdnHAR Dataset. Appendix C presents some technical drawings describing the autonomous platform.
Chapter 2 Data-Driven Machine Intelligence
2.1 Introduction
Many cognitive pathways are employed to survey a visual scene before judgment, and associated action is made [62]. During this period, objects in the sensory range are identified and classified. Posterior and occipital lobes are critical in linking the visual map with reality and, therefore, in determining the location of an object [63]. The ear, neck and extra-ocular muscles contribute to this ability to geo-locate [64]. These muscles and auditory abilities are responsible for maintaining the link between reality and visual perception [65]. For example, when the ears hear a sound, the head and eyes move with respect to the body. The input from eyes and ears are required to locate the object of interest. Once the location of an object is identified, the visual information is compared to memories stored in the temporal lobes – bringing about recognition of the objects. The occipital and temporal lobe regulates decisions regarding the recognized object [66]. Commonly referred to as the two-stream hypothesis, the link between these parts of the brain is responsible for all visual processing [67], [68].
The brain is a system with multiple and distinct components performing specific tasks for the body and mind. The neurobiology of vision has its genesis in the Occipital Lobe. The Occipital Lobe is a cluster of densely packed neurons, located towards the rear of the brain just above the brainstem. When the Occipital Lobe becomes stimulated, dopamine, and other neurotransmitters flood the nucleus accumbens and the central nervous system forcing the hippocampus to recall memories relating to the objects they see [69]. For example, dopamine, a neurotransmitter that helps control the reward and pleasure centres of the brain, muscle
innervation, and emotional response – enables humans not only “see rewards, but to take action to move towards them” [69], [70].
Figure 1: Two neurons side by side showing the Nucleus, Axon, Synapse, Dendrites, Neurotransmitters, and the Synaptic Cleft [71].
Although no physical connection exists between synapse and dendrites – the start and the end of neurons – signals are transmitted with the assistance of neurotransmitters and biochemical markers [72]. When a signal needs to pass across the synaptic cleft – the space between synapse and dendrites – neurotransmitters change the permeability of the cell wall [73]. This change in permeability allows cellular fluid to flow into the cerebral space mixing with cerebrospinal fluid – thus inducing an action potential that passes along the axon from neuron to neuron [70]. This arrangement is depicted in Figure 1, and depending on the biochemical marker and nerve type, the body and brain react in different ways. This relationship between neurotransmitters and biochemical markers, coupled with the location of brain components and nerve groupings, is the result of millions of years of evolution. It has allowed humankind to survive and controls how the body perceives objects it encounters continually. It is what makes humans who we are. It is what scientists are trying to emulate when they research AI [4].
Typically, what is regarded as AI nowadays is an Artificial Neural Network (ANN). An ANN is a computer algorithm that imitates the biological function of the human brain [74]. It contains virtual neurons that arrange in interconnected layers. Each artificial neuron passes on information by performing calculations in a similar way to the human brain. In the Neural Network, the neurons are just numbers in the code with typical values between 0 and 1. The connections between neurons are often referred to as weights. These weights describe how much the information from one-layer matters to the next. The values of the neurons (bias) and the weights are the free parameters of the network. In training the network, we want to find those values of these parameters so that loss can be minimized – often referred to as the loss function. Technically it is an optimization problem that the Neural Networks solve [75]. In such optimization problems, the Neural Network works through all combinations and learns the pattern in the data using Backpropagation. Learning through Backpropagation means that as the network returns a result that is not particularly good, the weights and bias are changed. Neural Networks learn from failure through a combination of forward and backpropagation. While it is nowhere near AGI, it certainly shows progress in the right direction.
This chapter is organized as follows; Section 2.2 reports on immanent nervous activity before moving onto the fundamentals of ML in Section 2.3. In this section, we shift from the biological to the artificial, reporting on the different learning paradigms and the ML techniques used during this research. In Section 2.4, we report on Multimodal Machine Learning before moving onto Section 2.5, where we applications of ML in Intelligent mobility. In Section 2.6, we conclude this chapter with a summary.
2.2 Imminent Nervous Activity a template for Artificial intelligence
In 1848 Phineas Gage was working as part of a crew cutting a railroad in the American bedrock of Vermont. Gage was using a tamping iron to pack explosives when tragedy struck [76]. The tamping iron - roughly 1 meter long, 3 cm in diameter and 6 kilograms in weight – ignited the explosives and shot the iron rod through Gage's left cheek, into his brain before the rod exited his skull and landed several meters away [77]. When Gage presented to Dr John Harlow - blinded in his left eye and suffering traumatic brain injury – Gage is reported to have remained lucid enough to tell the doctor, "Here is business enough for you" [76], [77].Such injury inevitably caused some notoriety for Gage amongst locals, but it was Dr Harlow who etched the incidence into the history books. Treating Gage for some time after the incident, Dr Harlow reported that his friends found him "no longer Gage." "The balance
between his intellectual faculties and animal propensities seemed gone." "He could not stick to plans, uttered the grossest profanity, and showed little deference for his fellows" [77], [78]. It was not long until the construction company – that previously regarded him as a "model foreman" – refused him employment [76]–[80]. Medical practitioners and psychologists argued that this was evidence that the brain was "localized" or "plastic" [77], [78]. To an extent, modern neuroscience tells us that both are correct – as the brain is regarded as being both plastic and compartmentalized.
Fast forward nearly 100 years, and research by Canadian psychologist Donald Hebb resulted in what is now known as Hebbian learning. Hebbian Learning describes how the brain undergoes neural plasticity following a traumatic incident or a period of neural adaptation [81]–[83]. His work considered events experienced by people such as Gage, and he formed the hypothesis of learning based on the mechanism of neural plasticity [83]. Building on Donald Hebb's work, Warren McCulloch and Walter Pitt's researched threshold logic, which is one of the cornerstones of modern Neural Nets. The work looked at two distinct approaches to biological processing in the brain and the applications of neural nets [74].
Donald's view on how the brain wires and rewires itself is what all contemporary neural nets do. How weights and bias are assigned to inputs to reaffirm a connection or build a new, more robust link is not a new idea [83]. People have been discussing concepts like this since Gage had that unfortunate accident. More recently, however, neural nets have gone through a revival due in part to projects like Google's Deep Mind, Tesla Self-Driving Cars, and Toyota's billion-dollar AI research Investment. These projects are expanding on McCulloch and Pitts' work with one key difference - they are expanding neural nets by adding hidden layers, stacking them on top of each other, and calling them Deep Net's [84], [85].
2.2.1 Neural Plasticity
Neuroscience is a biological science that is concerned with the function of the brain and the nervous system. Throughout our life, we are shaped by experiences that not only change our behaviour but also alter how we think. Exactly how this happens is not entirely understood, but one crucial mechanism is the physical changes and connections in our brain. The changing and shaping of connections in our brain is referred to as neuroplasticity. Donald Hebb was amongst the first people to describe this process. In his book "The Organization of Behaviour; A Neuropsychological Theory," he wrote his now-classic Hebb's postulate [11]. Hebb's postulate states that when two neurons fire at the same time, the connection between
fire in an uncoordinated manner, the connection between them weakens – becoming more likely to act independently in the future. Simply Put - neurons that fire together, wire together, - and neurons that fire apart, wire apart [11].
The brain can be viewed as a vast interconnected circuit with millions of different paths for the electrical currents to flow. Some of these paths can accommodate higher current allowing the electrons to move without restriction. These paths represent a human, established way of thinking, feeling, and doing. Every time we think, feel, or do something in the same way, we strengthen this path making it more robust, allowing an action potential to move without restriction. As a result, it becomes quicker and easier for the signals in our brain to travel this way [82].
By contrast, if a path is damaged, unused, or is not well constructed in the first place, we start to use a different pathway. If we keep using that new pathway and continue to use this route more and more - this new way of thinking, feeling, or doing becomes automatic. In the meantime, the old pathway gets less and less use, eventually weakening [11]. In other cases, it may be possible to repair or rebuild blocked pathways. This process of rewiring the brain by strengthening existing pathways, making new ones, weakening old ones, and repairing broken ones is neuroplasticity in action.
When we apply the neuroscience of learning to how the brain works, we can modify four variables to maximize the retainment of knowledge. Summarized as attention, generation, emotion, and spacing [86]. For us to be able to learn something, we need to be able to pay attention to it. If we can minimize the distractions, then we can maximize the learning, and we will not forget it. We nee1d to encourage the learner to generate meaningful connections and associations with what they already know – helping the learner to make that connection to previously learned patterns and the broader context [86]. If w00.0…00e attach emotion to learning – and help motivate the learner with rewards – they are much more likely to remember the information at a later date.
It is essential to understand that neuroplasticity is not good or bad – it is just what the brain does. Neuroplasticity can result in significant changes, like when a child learns to cross the road safely, or when adults learn a new set of skills. On the other hand, it can result in unhelpful changes in the brain, when someone learns an unnatural way of thinking or a bad habit – like Mr Gage above.
![Figure 1: Two neurons side by side showing the Nucleus, Axon, Synapse, Dendrites, Neurotransmitters, and the Synaptic Cleft [71]](https://thumb-us.123doks.com/thumbv2/123dok_us/1314215.2675695/33.892.216.738.241.638/figure-neurons-showing-nucleus-synapse-dendrites-neurotransmitters-synaptic.webp)


![Figure 17: The Regression Loss, Binary Classification, Multi-class Classification loss function and their subdivisions [167]](https://thumb-us.123doks.com/thumbv2/123dok_us/1314215.2675695/59.892.190.787.787.950/figure-regression-binary-classification-multi-classification-function-subdivisions.webp)