sampled optical endomicroscopy images.
Oleksii Leonovych1, Mohammad Rami Koujan1, Ahsan Akram2, Jody Westerfeld3, David Wilson3, Kevin Dhaliwal2, Stephen McLaughlin1, Antonios Perperidis*1,2
1 Institute of Sensors, Signals and Systems, Heriot Watt University, Edinburgh, UK 2 EPSRC Proteus Hub, MRC Centre for Inflammation Research, University of Edinburgh, UK
3 Community Health Network, Community South hospital, Indianapolis, USA *[email protected]
Abstract. Optical endomicroscopy (OEM) is a novel real-time imaging technol-ogy that provides endoscopic images at the microscopic level. Clinical OEM pro-cedures generate large datasets making their post procedural analysis a subjective and laborious task. There has been effort to automatically classify OEM frame sequences into relevant classes in aid of a fast and reliable diagnosis. Most exist-ing classification approaches adopt established texture metrics, such as Local Bi-nary Patterns (LBPs) derived from the regularly sampled grid images. However, due to the nature of image transmission through coherent fibre bundles, raw OEM data are sparsely and irregularly sampled, post-processed to a regularly sampled grid image format. This paper adapts Local Binary Patterns, a commonly used image texture descriptor, taking into consideration the sparse, irregular sampling imposed by the imaging fibre bundle on OEM images. The performance of Sparse Irregular Local Binary Patterns (SILBP) is assessed in conjunction with widely used classifiers, including Support Vector Machines, Random Forests and Linear Discriminant Analysis, for the detection of uninformative frames (i.e. noise and motion-artefacts) within pulmonary OEM frame sequences. Unin-formative frames can comprise a considerable proportion of a dataset, increasing the resources required to analyse the data and impacting on any automated quan-tification analysis. SILBPs achieve comparable performance to the optimal LBPs (> 92% overall accuracy), while employing < 13% of the associated data.
Keywords: Optical endomicroscopy, texture analysis, irregular sampling, local binary patterns, frame classification.
1
Introduction
Optical endomicroscopy (OEM) is an emerging imaging tool used both clinically and pre-clinically in the pulmonary, urological and the gastro-intestinal tracts. The technol-ogy employs a proximal illumination unit linked to an interface with a flexible multi-core optical fibre bundle. The miniaturised fibre bundle is passed through the working
channel of endoscopes enabling microscopic imaging at its distal end. Probe-based con-focal laser endomicroscopy (pCLE) is currently the most widely used platform and the only OEM methodology approved for clinical use. pCLE employs a single colour prox-imal laser scanning illumination (most commonly at 488nm). Yet, there is a plethora of flexible, versatile and low-cost OEM architectures currently under development and evaluation, employing LED illumination sources [1], capable of real-time imaging at multiple acquisition wavelengths [2].
In pulmonary OEM, auto-fluorescence (at 488nm) generated through the abundant elastin and collagen has enabled the exploration of the distal pulmonary tract [3] as well as the assessment of the respiratory bronchioles and alveolar gas exchanging units [4]. OEM has been used clinically in the lung for the detection of lung cancer [5] and has been used to assess the distal lung [6, 7] including the imaging of parenchymal lung diseases [8]. Furthermore, there has been an effort to develop molecularly targeted flu-orescent SmartProbes that can bind and amplify fluorescence in the presence of inflam-mation [9], bacteria [10] and fibrogenesis [4].
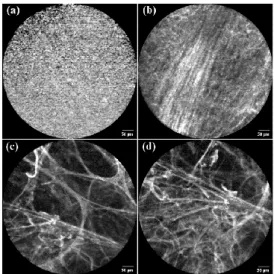
Fig. 1. Example pulmonary OEM images containing (a) pure noise due to loss of contact with tissue, (b) low contrast and mostly linear bronchus strands, (c-d) alveoli elastin strands, healthy and pathological respectively.
Clinical pulmonary OEM data acquisition tends to generate large image sequences that form a long continuous scene, rendering the process of their manual analysis labo-rious and highly subjective. In particular, within these OEM sequences there are frames that image the airways (Fig. 1.b), or the alveoli elastin strands (healthy or pathological), see Fig. 1.c-d. Furthermore, there are frames that contain only noise (Fig. 1.a), mostly due to the lack of contact of the fibre with a fluorescent target. Similarly, there are frame sequences where the spatial movement is very large when compared to the temporal rate of acquisition. This results in motion-artefacts (Fig. 2), expressed as either de-formed anatomical structures, or spatial discontinuity for temporally adjacent frames.
Such frames contain little information of value and are therefore referred to as “unin-formative frames”. There have recently been a number of studies attempting to group OEM images in two or more classes such as differentiating between informative and uninformative frames [11], or normal and abnormal elastin frames [12-14]. Frame clas-sification / parsing can be beneficial to the diagnostic process, reducing the associated human/computational resources, while enabling more targeted and objective image quantification/interpretation. Yet, all these studies have utilised texture descriptors based on regularly sampled, grid images. However, in raw OEM images, due to trans-mission of the data through a coherent fibre bundle, the sampling is sparse and irregular. This is a well-known limitation in OEM imaging with a number of proposed solutions for the reconstruction of regular, gridded images from the sparse captured data [15].
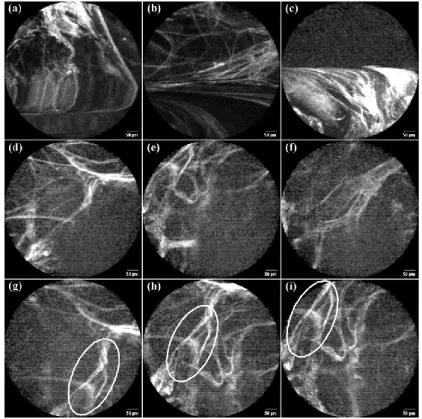
Fig. 2. Example frame sequences of (a-c) artefacts as deformed structures, (d-f) motion-artefacts as spatial discontinuity in temporally adjacent frames, and (g-i) large movements.
This paper makes the following contributions: (i) it investigates the effect of sparse, irregular sampling (and subsequent image reconstruction) imposed by the fibre bundle structure on the frame classification via standard texture descriptors such as Local Bi-nary Patterns (LBPs) and Gray Level Co-occurrence Matrices (GLCMs); (ii) it pro-poses an adaptation of LBPs utilising explicit knowledge of this sparse irregular sam-pling in an attempt to reduce the required computational resources. Similar to
Mesh-LBP [16], a set of vertices is triangulated to a mesh. However, unlike Mesh-Mesh-LBP, in-formation solely from the sparse and irregularly distributed vertices is employed. These texture descriptors, along with commonly used classifiers, are employed to disassociate between informative and uninformative frames. Uninformative frames can amount to a substantial proportion (likely > 25%) of a dataset, potentially (i) prolonging the off-line assessment, and (ii) diluting the results of any post-procedural image analysis. There is therefore a need for an automated approach to detect and remove such frames.
2
Methodology
The task of disassociating between informative and uninformative frames was formu-lated as a classification problem on a feature space comprising of texture descriptors derived from the OEM frame sequences. Three well-established classifiers were used (Random Forests, Support Vector Machines and Linear Discriminant Analysis). Simi-larly, commonly used texture descriptors such as LBPs and GLCMs, along with Sparse Irregular Local Binary Patterns (SILBPs), an adaptation of LBPs for sparse and irregu-larly sampled OEM images, were employed.
Video Pre-processing. Prior to any analysis, each video was (i) contrast enhanced en-suring a common dynamic range across all data, and (ii) cropped, maintaining the larg-est square region (360 × 360 pixels) within the circular field of view (FOV) as seen in Fig. 1. The remaining 4 segments (each 9% of the circular FOV) were not included in the texture estimations and the subsequent frame classification. This decision was based in the assumption that, if the central square region of a frame was identified as pure-noise or a motion-artefact, a small structure in any of the 4 excluded subsections would not be sufficient to reinstate the frame as an informative frame.
2.1 Texture Descriptors
Local Binary Patterns (LBPs). Let 𝐼(𝑥, 𝑦, 𝑡) be a greyscale image sequence, with 𝑥 ∈ [1, 𝑁], 𝑦 ∈ [1, 𝑀] and 𝑡 ∈ [1, 𝐾] indicating the pixel location (x - column and y - row) and the frame number respectively. As described in [17], for each pixel 𝑝 in a frame
𝐼𝑡= 𝐼(𝑥, 𝑦, 𝑡)(𝑥,𝑦)∈[1,𝑁]×[1,𝑀], a binary vector 𝐿𝐵𝑃𝐿,𝑅 of length 𝐿 was constructed by
thresholding 𝐿 equally-spaced neighbours located on a circle of radius 𝑅 around the central pixel 𝑝𝑐 by estimating
𝐿𝐵𝑃𝑡 𝐿,𝑅(𝑝 𝑐) = ∑ 𝑠 (𝐼𝑡(𝑥𝑝𝑖, 𝑦𝑝𝑖) − 𝐼𝑡(𝑥𝑝𝑐, 𝑦𝑝𝑐)) 2 𝑖 𝐿−1 𝑖=0 , (1) where 𝑠(𝑣) = {1, 𝑖𝑓 𝑣 ≥ 00, 𝑖𝑓 𝑣 < 0
with 𝐼𝑡(𝑥𝑝𝑐, 𝑦𝑝𝑐) and 𝐼𝑡(𝑥𝑝𝑖, 𝑦𝑝𝑖) representing the image intensity of the central pixel 𝑝𝑐 and its local neighbours 𝑝𝑖, where 𝑖 ∈ [0, 𝐿 − 1], respectively. In other words, a local
neighbor 𝑝𝑖 of value 𝐼𝑡(𝑥𝑝𝑖, 𝑦𝑝𝑖) on a circle of radius 𝑅 was assigned 0 if smaller than
𝐼𝑡(𝑥𝑝𝑐, 𝑦𝑝𝑐), and 1 otherwise, making the constructed binary vectors invariant to mon-otonic image intensity transformations. Uniform binary codes were derived, reducing the dimensionality of the feature space as well as a means of implementing a simple, rotation invariant descriptor. In particular, uniform LBPs were defined as patterns with at most two bit-wise transitions, either from 0 to 1 or 1 to 0. Uniform codes constituted more than 90% of all binary codes in the available OEM dataset. Uniform binary pat-terns were made rotation invariant by representing them using the number of elements with value 1 in each associated uniform vector of length 𝐿, resulting in 𝐿 + 1 distinct values (0 to 𝐿). The remaining non-uniform patterns were encoded with the value 𝐿 + 1. Finally, the encoded values were aggregated in a histogram 𝑋(𝑡) of 𝐿 + 2 bins, which characterised the current frame 𝐼𝑡. Each histogram was considered as a point in
the 𝐿 + 2 dimensional space and passed to the next stage for classification.
Sparse Irregular Local Binary Patterns (SILBPs). Let 𝐶 = [𝑐1, 𝑐2, … , 𝑐𝑃], where
𝑐𝑗= (𝑥𝑗, 𝑦𝑗) and 𝑗 ∈ [1, 𝑃], be the core centroids for each individual core within the
imaging fibre bundle (Fig. 3). Delaunay Triangulation was employed to derive a con-nectivity list 𝐷𝑇(𝐶) of the point set containing (𝑃 − 2) unique triangles (Fig. 3.b). De-launay Triangulation offers a number of attractive properties, including (i) connecting points in the nearest-neighbour manner, (ii) maximising the minimum angle of all the angles of the triangles (avoiding sliver triangles), and (iii) ensuring that a circle circum-scribing any triangle does not contain any other point in its interior. These properties make Delaunay Triangulation an attractive approach for interpolating across the sparse, quasi hexagonal sampling of a multicore fibre bundle, generating an associated regu-larly sampled rectangular grid [15].
For each core 𝑐 within the fibre bundle, the (𝑥, 𝑦) coordinates associated with the
rth -order neighbours in 𝐷𝑇(𝐶) were estimated as 𝑁𝑟= [𝑛
1 𝑟, 𝑛2 𝑟, … , 𝑛𝑘,𝑟], a collection
of coordinate vectors 𝑛𝑟, with 𝑘 being the number of rth -order neighbours of 𝑐 (Fig.
3.b). In theory, the imaging fibre bundles are constructed in a hexagonal structure. However, inhomogeneities in the construction result in a varying number neighboring cores. In particular, as illustrated in Fig. 4.a, most cores amongst the fibre bundles used throughout this study had between 5 and 7 1st order neighbours, with 6 neighbours being the most common occurrence. Similar variations were observed for remaining rth order neighbours. In order to replicate the vector notation of rth order neighbours to each pixel employed by the LBPs in regular grid images, for each core 𝑐 (Fig. 3.c):
1.The 2D image plane was divided in 𝑙 = 8 × 𝑟 equiangular segments; 2.A vector 𝑁′𝑟= [𝑛′
1 𝑟, 𝑛′2 𝑟, … , 𝑛𝑙,𝑟] of length 𝑙 = 8 × 𝑟 was created;
3.For each equiangular segment (in anticlockwise direction) 𝜃 = [1, 𝑙], 𝑛′𝜃 𝑟 = 𝜇(𝑁𝜃𝑟),
where 𝑁𝜃𝑟 contained the cores of 𝑁𝑟 falling within the segment 𝜃 and 𝜇 is the
asso-ciated average value.
In a similar fashion to 𝐿𝐵𝑃𝐿,𝑅, for each core 𝑐 in frame 𝐼, a binary vector 𝑆𝐼𝐿𝐵𝑃𝑙,𝑟 of
length 𝑙 was constructed by thresholding the rth order neighbouring cores around the central core by estimating
𝑆𝐼𝐿𝐵𝑃𝑙,𝑟(𝑐) = ∑𝐿−1𝑖=0𝑠 (𝐼 (𝑥𝑛′i 𝑟, 𝑦𝑛′𝑟i ) − 𝐼(𝑥𝑐, 𝑦𝑐)) 2𝑖, (2)
where 𝑠(𝑣) = {1, 𝑖𝑓 𝑣 ≥ 0 0, 𝑖𝑓 𝑣 < 0
with 𝐼(𝑥𝑐, 𝑦𝑐) and 𝐼 (𝑥𝑛′i 𝑟, 𝑦𝑛′i 𝑟) representing the image intensity of the central core
lo-cation and its local neighbours in 𝑁′𝑟 respectively. For segments including no cores
𝐼 (𝑥𝑛′𝑖 𝑟, 𝑦𝑛′𝑖 𝑟) = 0.5 ∗ (𝐼 (𝑥𝑛′𝑖−1 𝑟 , 𝑦𝑛′𝑖−1 𝑟 ) + 𝐼 (𝑥𝑛′𝑖+1 𝑟 , 𝑦𝑛′𝑖+1 𝑟 )). No two consecutive
segments without a core were observed and considering the measured number of neigh-bouring cores (Fig. 4.a) and the core distribution characteristics within a fibre bundle, such occurrence is highly unlikely. Similarly to LPBs, the encoded values describing frame 𝐼𝑡. were aggregated in histogram 𝑌(𝑡) of 𝑙 + 2 bins.
Fig. 3. (a) OEM frame of healthy lung elastin strands. (b) Zoomed-in region of interest with individual cores highlighted, as well as a central core (blue) along with its 1st (red) and 2nd (green) order neighbours estimated from the associated Delaunay Triangulation. (c) Illustrative example of 1st order neighbours core connectivity and spread, along with their relative position in the equiangular segments used in SILBPs.
The Gray-Level Co-occurrence Matrix (GLCMs). The Gray-Level Co-occurrence
Matrix [18] 𝐺𝑡 for frame 𝐼𝑡= 𝐼(𝑥, 𝑦, 𝑡)(𝑥,𝑦)∈[1,𝑁]×[1,𝑀] was defined as a 𝐵 × 𝐵 matrix
𝐺𝑡𝛥𝑥,𝛥𝑦(𝜂, 𝜁) = ∑ ∑ {1, 𝑖𝑓 𝐼(𝑥, 𝑦, 𝑡) = 𝜂 𝑎𝑛𝑑 𝐼(𝑥 + 𝛥𝑥, 𝑦 + 𝛥𝑦, 𝑡) = 𝜁 0, 𝑜𝑡ℎ𝑒𝑟𝑤𝑖𝑠𝑒 𝑀 𝑦=1 𝑁 𝑥=1 (3)
where, 𝐵 was the number of grey-levels within the image (16 bit), 𝜂 and 𝜁 were inten-sity levels, 𝑥 and 𝑦 were the spatial positions in the image 𝐼𝑡, and 𝛥𝑥 and 𝛥𝑦 were the
spatial offsets (in number of pixels) utilised to estimate the GLCM 𝐺𝑡. To achieve
ro-tational invariance of the relevant texture measures, 𝐺𝑡 was estimated as the mean
GLCM for offset pairs {(𝛥𝑥, 0), (𝛥𝑥, 𝛥𝑦), (0, 𝛥𝑦), (−𝛥𝑥, 𝛥𝑦)}, corresponding to a sin-gle pixel offset at directions (0°, 45°, 90° and 135°). The probability of each co-occur-ring pair was estimated as 𝐺𝑡𝑛𝑜𝑟𝑚= 𝐺𝑡⁄𝑛, where n was the sum of all elements in 𝐺𝑡.
Related texture metrics as described in [18] including Contrast, Energy, Homogeneity,
Entropy, Maximum Probability, Mean intensity and intensity Standard Deviation were derived, defining a 7-dimensional feature space 𝑍(𝑡).
Features for motion artefact detection. The direct texture values were employed to distinguish between informative and pure noise frames. On the other hand, the frame-by-frame texture variability 𝑇𝑒𝑥𝑡𝑢𝑟𝑒’ = 𝑇𝑒𝑥𝑡𝑢𝑟𝑒(𝑡) − 𝑇𝑒𝑥𝑡𝑢𝑟𝑒(𝑡 − 1) was used to detect motion artefacts, with 𝑇𝑒𝑥𝑡𝑢𝑟𝑒 ∈ [𝑋, 𝑌, 𝑍] corresponding to one of GLCMs, (𝑋) LBPs (𝑌) or SILBPs (𝑍) extracted from the data at frame number 𝑡 ∈ [1, 𝐾].
2.2 Classifiers
Support Vector Machines (SVM). Support Vector Machines (SVMs) performs a
bi-nary classification task by finding an optimal hyperplane in the feature space, maximis-ing the distance between the decision boundary and nearest trainmaximis-ing point from each class [19]. For 𝑢𝑚 and 𝑣𝑚 representing a single observation and its associated label in
the multi-dimensional feature space of the training set, SVM employs a linear model of the form 𝑓(𝑢𝑚) = 𝑢𝑚𝛽 + 𝑏 where 𝑏 is the bias, and 𝛽 the normal vector to the
plane, known as the decision boundary. In an attempt to find the best separating hyper-plane, 𝛽 and 𝑏 that constitute the perpendicular distance between the decision boundary and its nearest point as high as possible are estimated. To avoid overfitting the non-separable dataset and resulting in poor generalisation performance, a soft margin is de-fined by introducing a slack variable 𝜉 > 0 and penalty parameter 𝐶. The new optimi-sation problem is therefore formulated as follows
𝑚𝑖𝑛 𝛽,𝑏,𝜉(𝐶 ∑ 𝜉𝑚 𝑚+ 1 2‖𝛽‖ 2), such that 𝑣 𝑚𝑓(𝑢𝑚) ≥ 1 − 𝜉𝑚 (4)
where 𝑚 = [1, . . , 𝑄], 𝑄 being the size of the training set, and the parameter 𝐶 > 0
(called the box constraint) controlling the trade-off between the margin and the slack variable penalty, which compensates between the hard margin and soft margin.
Random Forests (RF). Random forests [20] are an ensemble learning method for clas-sification (and regression) that combines decision tree learning and tree bagging in or-der to correct for the overfitting to the training set tendency of the former approach. Each decision tree is formed by creating a split using the best predictive variable se-lected from a random subset of the training set until the leaf node has too few samples to split. After training, the classification decision is obtained by taking the majority vote of all the outputs of individual decision trees. In this study, a random forest implemen-tation was employed comprising of 200 trees, with a minimum number of leaf node observations set to 1 (default) and 𝑓𝑙𝑜𝑜𝑟(√𝑄) randomly selected features in each split, with 𝑄 being size of the whole training set.
Linear Discriminant Analysis (LDA). Fisher’s discriminant analysis, commonly
re-ferred to as Linear Discriminant Analysis (LDA) is a simple dimensionality reduction approach (through linear transformation of the feature space) that has found application as a linear classifier, capable of separating amongst data of two or more classes [21, 22]. In particular, LDA projects data from the multi-dimensional feature space into a
vector space that maximises between-class distance (scatter matrix) 𝑆𝐵 while
minimis-ing within-class distance (scatter matrix) 𝑆𝑊 through maximising objective function
𝐽(𝛾) = (𝛾
𝑇𝑆
𝐵
𝛾) (𝛾
⁄
𝑇𝑆
𝑊𝛾)
, w
here 𝛾 is the optimal projection vector. The discri-minant hyperplane is normal to 𝛾 and the associated decision criterion (location of hy-perplane) is estimated as a threshold on 𝛾. 𝑥 > 𝜔 for some threshold constant 𝜔.3
Data Analysis
A total of 9 OEM image sequences (8Hz) of the distal lung were used for the training and testing of the proposed methodology. All data were obtained as part of a larger database (126 subjects) during routine investigation for indeterminate pulmonary nod-ules (< 30𝑚𝑚) at the Columbus Lung Institute, Indiana, USA. Approval for the study, which generated the data studied in this paper, was granted by the Western Institutional Review Board. All of the data used in this paper were acquired by a single expert op-erator using a 488nm CellvizioTM with a 1.4𝑚𝑚 lateral diameter and a 600µ𝑚 field-of-view AlveoflexTM fibre, (Mauna Kea Technologies, Paris, France), and were stored in the proprietary .mkt format. Of the original database, 43 subjects were rejected due to (i) short duration of sequences (< 10 frames), (ii) corrupted data (i.e. not readable, misaligned / out-of-focus fibre), or (iii) lack of distal lung frames. Of the remaining videos, 9 were randomly selected as a training and testing set (averaging 627 frames per video) with no other subjective criteria (such as image quality) that could potentially bias the proposed algorithms. A 9-fold cross validation was employed, separating data at video level and consequently preventing potentially correlated frames included in both training and testing sets biasing the classification performance.
Table 1. Sizes (number of frames) of the overall dataset and the manually annotated sub-classes.
Total number of frames Informative frames Sub-sampled (1:9) informative frames
Noise frames Motion artefacts
5645 5046 561 404 195
Prior to any processing, an experienced investigator manually annotated each indi-vidual frame in the dataset as normal or pure-noise. Moreover, due to the more subjec-tive nature of the task, two investigators independently annotated each individual frame in the dataset as normal or motion-artefact. A frame was assigned the motion-artefact label if both investigators had annotated it as such. The resulting binary annotations were used as the gold standard for the subsequent evaluation of the proposed algorithm. Table 1 summarises the relevant sizes (in number of frames) of the available data. Due to the large class imbalance (> 10: 1 ratio) in the annotated frames, and considering the discriminative nature of the classifiers employed in this study [23], the training sets were adjusted by uniform sub-sampling of the informative frames with a 1: 9 ratio. Data sub-sampling also reduced any redundancies in the training set due to potential high correlation between consecutive frames. The effectiveness of the proposed approach in detecting uninformative frames was quantitatively assessed by estimating the accuracy, sensitivity and specificity against manual detection.
4
Results and Discussion
Fig. 4.b illustrates the distribution of distances (in number of pixels) between each core within a fibre bundle and its immediate (1st order) neighbouring cores. The majority of the cores are spaced 2 to 4 pixels apart, with just under 3 pixels being the most com-monplace occurrence. The inter-core distance appears to have a direct effect on the performance of LPBs in the disassociation between informative and pure noise frames. As shown in Table 2, there is a substantial increase in the classification performance (accuracy) for 𝑅 = 2 𝑡𝑜 4 pixels with best performance achieved for a radius of 3 pix-els. Similar behavior was observed in the GLCM estimation with optimal classification performance using a combination of the 3 and 4 pixels step. These results are indicative of the potential detrimental effect of extracting texture descriptors from sparsely sam-pled and subsequently reconstructed data such as OEM images. Consequently, estimat-ing the texture descriptors’ parameters based on the associated fibre bundle character-istics can enhance the classification performance.
Fig. 4. (a) Distribution of the number of the 1st order neighbouring cores for each core in a fibre bundle. (b) Distribution of distances (in pixels) between each core and its 1st order neighbours.
Table 2. Informative Vs Noise frames classification accuracy for LBPs of increasing radius. Random forest classifier employed (best classification performance).
R=1 R=2 R=3 R=4
Accuracy 93.0% 98.2% 98.7% 98.1%
Table 3 enables a comparison, in terms of classification performance (accuracy), across the combinations of different texture metrics and classifiers described in this study. For GLCM and LBPs the optimal parameters associated with the fibre bundle were employed. On the other hand, SILBPs used only immediate (1st order) neighbour-ing cores for the derivation of texture information. Employneighbour-ing only neighbourneighbour-ing core values removed some of the uncertainty introduced by the reconstructed pixels (used in LBPs and GLCMs) within the regular grid image. On the other hand, some uncertainty was introduced to the SILBP texture metric due to potential variations in distance be-tween central and neighboring cores (Fig. 4.b). As demonstrated by Table 3, all three texture descriptors perform very similarly in distinguishing between informative and
uninformative frames. There is a marginal drop in classification accuracy associated with SILBP when compared to GLCM3,4 and LBP3. Yet, each 360 × 360 pixel region of interest (> 129𝐾 pixels) analysed corresponds to just over 16𝐾 cores, accounting for 12.7% of the original information. Consequently, SILBPs can provide a viable al-ternative to commonly used texture metrics such as GLCMs and LBPs for applications were computational resources are scarce. In particular, it is expected to provide a valu-able tool for incorporating frame classification functionality in real-time the software n of OEM imaging platforms, where driving the hardware, capturing, storing, pre-pro-cessing and displaying data compete for and sometimes drain the available resources.
Table 3. Classification accuracy across different texture metrics and classifiers. (* positive class)
Informative* Vs Pure Noise Informative* Vs Motion Blur GLCM3,4 LBP3 SILBP GLCM3,4 LBP3 SILBP
RF 98.7% 98.7% 98.2% 95.9% 96.2% 95.9%
LDA 98.5% 98.5% 96.9% 96.1% 96.4% 96.2%
SVM 98.2% 98.4% 97.1% 95.8% 96.1% 96.0%
Table 4. Overall performance in differentiating between informative (* positive class) and unin-formative frames. SILBP combined with Random Forests classifier were used.
Pure Noise Motion Artefacts All Uninformative Informative*
Total frames 404 195 599 5046
Correctly classified 358 145 503 4673
Table 5. Associated statistics in differentiating between informative (positive class) and unin-formative frames. SILBP combined with Random Forests classifier were used.
Sensitivity Specificity Accuracy F1 Score
92.6% 84.0% 91.7% 95.2%
As shown in Table 4 and Table 5, SILBPs combined with Random Forests classifier (marginally outperforms LDA and SVM) can provide an accurate (> 91%) classifica-tion between informative and uninformative frames. Uninformative frames were iden-tified as a sequence of binary classifiers, classifying pure-noise vs elastin frames fol-lowed by a motion artefacts vs normal elastin. The performance is slightly inferior for identifying motion artefacts compared to pure noise frames. This is due to the detection of motion artefacts being a more challenging and subjective task, which has been illus-trated by the modest inter-observer agreement in the manual annotations of motion ar-tefacts recorded by [11]. Future steps include:
1.the assessment of SILBPs in other, clinically relevant classification tasks, such as localising between airways and distal lung, as well as between healthy and patho-logical lung tissue, and
2.the efficient implementation, integration and assessment of SILBPs in real-time clas-sification of OEM frame sequences.
5
Conclusions
Imaging through a fibre bundle generates sparse, irregularly sampled OEM data, recon-structed to regularly sampled grid images. Deriving texture metrics (such as LBPs and GLCMs) from the reconstructed images can have a detrimental effect on any associated frame classification performance. Determining texture descriptor parameters from ex-plicit knowledge on the irregularly sampled data, such as the average inter core dis-tance, can enhance the OEM frame classification accuracy. Furthermore, a proposed adaptation of LBPs utilising information from the irregularly sampled data directly and exclusively can achieve equivalent performance in identifying uninformative frames to LBPs, while accounting for only 12.7% of the original data. Conditional to appropriate refinement and testing, the proposed texture descriptor (SILPBs) can become widely applicable in on-the-fly classification/parsing of OEM frame sequences.
Acknowledgements. We thank the Engineering & Physical Sciences Research Council (UK) for the support via EP/K03197X/1. AA is a supported by Cancer Research, UK.
References
1. Pierce, M., Yu, D., Richards-Kortum, R.: High-resolution Fiber-optic Microendoscopy for in situ Cellular Imaging. Journal of Visualized Experiments (JoVE) 47),2306 (2011) 2. Krstajić, N., Akram, A.R., Choudhary, T.r.R., McDonald, N., Tanner, M.G., Pedretti, E.,
Dalgarno, P.A., Scholefield, E., Girkin, J.M., Moore, A., Bradley, M., Dhaliwal, K.: Two-color widefield fluorescence microendoscopy enables multiplexed molecular imaging in the alveolar space of human lung tissue. Journal of Biomedical Optics 21(4),046009-046009 (2016)
3. Thiberville, L., Moreno-Swirc, S., Vercauteren, T., Peltier, E., Cavé, C., Bourg Heckly, G.: In Vivo Imaging of the Bronchial Wall Microstructure Using Fibered Confocal Fluorescence Microscopy. Am. J. Respir. Crit. Care Med. 175(1),22-31 (2007)
4. Aslam, T., Miele, A., Chankeshwara, S.V., Megia-Fernandez, A., Michels, C., Akram, A.R., McDonald, N., Hirani, N., Haslett, C., Bradley, M., Dhaliwal, K.: Optical molecular imaging of lysyl oxidase activity - detection of active fibrogenesis in human lung tissue. Chemical Science 6(4946-4953 (2015)
5. Thiberville, L., Salaün, M., Lachkar, S., Dominique, S., Moreno-Swirc, S., Vever-Bizet, C., Bourg-Heckly, G.: In vivo confocal fluorescence endomicroscopy of lung cancer. J. Thorac. Oncol. 4(9),S48-S51 (2009)
6. Thiberville, L., Salaün, M., Lachkar, S., Dominique, S., Moreno-Swirc, S., Vever-Bizet, C., Bourg-Heckly, G.: Human in vivo fluorescence microimaging of the alveolar ducts and sacs during bronchoscopy. Eur. Respir. J. 33(5),974-985 (2009)
7. Thiberville, L., Salaün, M., Lachkar, S., Dominique, S., Moreno-Swirc, S., Vever-Bizet, C., Bourg-Heckly, G.: Confocal fluorescence endomicroscopy of the human airways. Proceedings of the American Thoracic Society 6(5),444-449 (2009)
8. Newton, R.C., Kemp, S.V., Yang, G.-Z., Elson, D.S., Darzi, A., Shah, P.L.: Imaging parenchymal lung diseases with confocal endomicroscopy. Respir. Med. 106(1),127-137 (2012)
9. Avlonitis, N., Debunne, M., Aslam, T., McDonald, N., Haslett, C., Dhaliwal, K., Bradley, M.: Highly specific, multi-branched fluorescent reporters for analysis of human neutrophil elastase. Org. Biomol. Chem. 11(26),4414-4418 (2013)
10. Akram, A.R., Avlonitis, N., Lilienkampf, A., Perez-Lopez, A.M., McDonald, N., Chankeshwara, S.V., Scholefield, E., Haslett, C., Bradley, M., Dhaliwal, K.: A Labelled-Ubiquicidin Antimicrobial Peptide for Immediate In Situ Optical Detection of Live Bacteria in Human Alveolar Lung Tissue. Chemical Science (2015)
11. Perperidis, A., Akram, A., Altmann, Y., McCool, P., Westerfeld, J., Wilson, D., Dhaliwal, K., McLaughlin, S.: Automated detection of uninformative frames in pulmonary optical endomicroscopy (OEM). IEEE Trans. Biomed. Eng. 64(1),87 - 98 (2016)
12. Desir, C., Petitjean, C., Heutte, L., Thiberville, L., Salaün, M.: An SVM-based distal lung image classification using texture descriptors. Comput. Med. Imaging Graph. 36(4), 264-270 (2012)
13. Saint-Réquier, A., Lelandais, B., Petitjean, C., Désir, C., Heutte, L., Salaün, M., Thiberville, L.: Characterization of Endomicroscopic Images of the Distal Lung for Computer-Aided Diagnosis. In: 5th International Conference on Intelligent Computing, pp. 994-1003. (2009) 14. Koujan, M.R., Ahsan, A., McCool, P., Westerfeld, J., Wilson, D., Dhaliwal, K., McLaughlin, S., Perperidis, A.: Multi-class classification of pulmonary endomicroscopic images. In: IEEE International Symposium on Biomedical Imaging. (2018)
15. Vercauteren, T.: Image Registration and Mosaicing for Dynamic In Vivo Fibered Confocal Microscopy. Mines ParisTech, Paris (2008)
16. Werghi, N., Berretti, S., Del Bimbo, A., Pala, P.: The Mesh-LBP: Computing Local Binary Patterns on Discrete Manifolds. In: IEEE International Conference on Computer Vision Workshops, pp. 562-569. (2013)
17. Ojala, T., Pietikainen, M., Maenpaa, T.: Multiresolution gray-scale and rotation invariant texture classification with local binary patterns. IEEE Transactions on Pattern Analysis and Machine Intelligence 24(7),971-987 (2002)
18. Haralick, R.M., Shanmugam, K., Dinstein, I.: Textural Features for Image Classification. IEEE Transactions on Systems, Man, and Cybernetics SMC-3(6),610-621 (1973) 19. Cristianini, N., Shawe-Taylor, J.: An introduction to support Vector Machines: and other
kernel-based learning methods. Cambridge University Press, Cambridge, UK (2000) 20. Breiman, L.: Random Forests. Machine Learning 45(1),5-32 (2001)
21. Mika, S., Ratsch, G., Weston, J., Scholkopf, B., Mullers, K.R.: Fisher discriminant analysis with kernels. In: Neural Networks for Signal Processing IX: Proceedings of the 1999 IEEE Signal Processing Society Workshop, pp. 41-48. (1999)
22. Martinez, A.M., Kak, A.C.: PCA versus LDA. IEEE Transactions on Pattern Analysis and Machine Intelligence 23(2),228-233 (2001)
23. He, Garcia, E.A.: Learning from Imbalanced Data. IEEE Transactions on Knowledge and Data Engineering 21(9),1263-1284 (2009)