Seabreeze dynamics and convection
initiation: the influence of convective
parameterization in weather and climate
model biases
Article
Published Version
Birch, C. E., Roberts, M. J., GarciaCarreras, L., Ackerley, D.,
Reeder, M. J., Lock, A. P. and Schiemann, R. (2015) Sea
breeze dynamics and convection initiation: the influence of
convective parameterization in weather and climate model
biases. Journal of Climate, 28 (20). pp. 80938108. ISSN
15200442 doi: https://doi.org/10.1175/JCLID1400850.1
Available at http://centaur.reading.ac.uk/46016/
It is advisable to refer to the publisher’s version if you intend to cite from the
work.
To link to this article DOI: http://dx.doi.org/10.1175/JCLID1400850.1
Publisher: American Meteorological Society
All outputs in CentAUR are protected by Intellectual Property Rights law,
including copyright law. Copyright and IPR is retained by the creators or other
copyright holders. Terms and conditions for use of this material are defined in
the End User Agreement
.
www.reading.ac.uk/centaur
CentAUR
Central Archive at the University of Reading
Reading’s research outputs online
Sea-Breeze Dynamics and Convection Initiation: The Influence of
Convective Parameterization in Weather and Climate Model Biases
CATHRYNE. BIRCH,* MALCOLMJ. ROBERTS,1LUISGARCIA-CARRERAS,#DUNCANACKERLEY,@,& MICHAELJ. REEDER,@,&ADRIANP. LOCK,1ANDREINHARDSCHIEMANN**
* Met Office@Leeds, University of Leeds, Leeds, United Kingdom
1Met Office, Exeter, United Kingdom
#School of Earth and Environment, University of Leeds, Leeds, United Kingdom @School of Earth, Atmosphere and Environment, Monash University, Clayton, Victoria, Australia &Centre of Excellence for Climate System Science, Monash University, Clayton, Victoria, Australia
** National Centre for Atmospheric Science, Department of Meteorology, University of Reading, Reading, United Kingdom
(Manuscript received 15 December 2014, in final form 15 June 2015) ABSTRACT
There are some long-established biases in atmospheric models that originate from the representation of tropical convection. Previously, it has been difficult to separate cause and effect because errors are often the result of a number of interacting biases. Recently, researchers have gained the ability to run multiyear global climate model simulations with grid spacings small enough to switch the convective parameterization off, which permits the convection to develop explicitly. There are clear improvements to the initiation of con-vective storms and the diurnal cycle of rainfall in the convection-permitting simulations, which enables a new process-study approach to model bias identification. In this study, multiyear global atmosphere-only climate simulations with and without convective parameterization are undertaken with the Met Office Unified Model and are analyzed over the Maritime Continent region, where convergence from sea-breeze circulations is key for convection initiation. The analysis shows that, although the simulation with parameterized convection is able to reproduce the key rain-forming sea-breeze circulation, the parameterization is not able to respond realistically to the circulation. A feedback of errors also occurs: the convective parameterization causes rain to fall in the early morning, which cools and wets the boundary layer, reducing the land–sea temperature contrast and weakening the sea breeze. This is, however, an effect of the convective bias, rather than a cause of it. Improvements to how and when convection schemes trigger convection will improve both the timing and location of tropical rainfall and representation of sea-breeze circulations.
1. Introduction
The representation of tropical convection is one of the major challenges in atmospheric science (Stephens et al. 2010) and one of the key uncertainties in future climate simulations (Rybka and Tost 2014). One major aspect of this challenge is the representation of the diurnal cycle of convection and rainfall in numerical models. Over many tropical regions there is a distinct diurnal cycle in pre-cipitation: over land the peak is generally in the evening and the minimum during the morning, and over the ocean
the peak generally occurs in the early morning (Yang and
Slingo 2001). Models that employ parameterized
con-vection generally produce rainfall that occurs too fre-quently, with an intensity that is too low (Sun et al. 2006;
Stephens et al. 2010) and a diurnal cycle that peaks too
early in the day (Dai 2006). Errors in the diurnal cycle affect heating rates, which feeds back on the large-scale circulation and other aspects of the model, such as the water budget (Marsham et al. 2013;Birch et al. 2014b).
The Maritime Continent consists of an archipelago of islands in the Pacific Ocean and the northern part of Australia (Fig. 1). The region has some of the highest sea surface temperatures (SSTs) and rainfall rates on Earth
(Ramage 1968), and the Rossby wave response to the
latent heating produced by convection has a strong in-fluence in remote regions (Neale and Slingo 2003); thus, Corresponding author address: Cathryn E. Birch, School of
Earth and Environment, University of Leeds, Woodhouse Lane, Leeds LS2 9JT, United Kingdom.
E-mail: [email protected] DOI: 10.1175/JCLI-D-14-00850.1
it is imperative to represent the region accurately in models. Sea-breeze dynamics and their interaction with the high topography are key rain-forming processes within the region. Differential daytime heating of the land and ocean causes sea-breeze circulations to develop
(Gille et al. 2005; Spengler and Smith 2008), which,
coupled with upslope winds over the mountain regions, create convergence zones inland that cause convection (and thus precipitation) to peak in the evening (Saito
et al. 2001;Qian 2008). After sunset, downslope
moun-tain winds develop as the land cools more rapidly than the ocean, reversing the sea breeze to form an offshore land breeze. This flow reversal, coupled to convectively generated gravity waves, advects the convection off-shore, producing a peak in precipitation over the ocean in the morning (Mori et al. 2004; Love et al. 2011;
Wapler and Lane 2012).
The representation of rainfall and the atmospheric circulation over the Maritime Continent is particularly poor in GCMs, and errors are apparent in both coupled and atmosphere-only climate model simulations (Flato
et al. 2013;Grose et al. 2014). In coupled models,
in-cluding the Met Office Unified Model (MetUM), pre-cipitation rates tend to be overestimated over the Maritime Continent, primarily as a result of a cold tongue SST bias in the Pacific (Irving et al. 2011). Conversely, a precipitation bias of the opposite sign occurs in atmosphere-only simulations of the MetUM where the SSTs are prescribed.Martin et al. (2006)show that this bias develops in the first few days of a simula-tion and is therefore unlikely to be caused by feedbacks originating from remote model biases, but is likely be-cause of an inadequate representation of convection. In addition, Qian (2008) suggests that model systematic errors are caused by the coarse representation of coastlines and mountains, which lead to weakened, or
missing, precipitation-forming mechanisms such as sea breezes and mountain winds.
Computing power is increasing all the time and so is our ability to run high-resolution simulations. The U.K. consortium Cascade project demonstrated that running limited-area models with grid spacings of 12–1.5 km, where the convective parameterization is switched off and convection is allowed to develop explicitly, can bring significant improvements to the initiation, propa-gation, and diurnal cycle of convection (Pearson et al.
2014; Marsham et al. 2013; Birch et al. 2014b).
Com-parisons with a simulation at an identical resolution but with the convective parameterization switched on show that the improvements are a result of the change in the representation of convection, rather than the change in resolution.Sato et al. (2009)analyze model precipitation from a global cloud-resolving model simulation with grid spacings of 14, 7, and 3.5 km and find that the di-urnal cycle in the 7- and 3.5-km simulations agrees well with satellite observations over land areas, although the diurnal peak in the 14-km simulation is about 3 h later than in reality and the mean rainfall in all three simu-lations can often be negatively impacted (Birch
et al. 2014b).
This study uses state-of-the-art, high-resolution multiyear MetUM global climate simulations with various representations of convection to understand the contribution of convective parameterization to biases in the diurnal cycle of precipitation in the Mar-itime Continent region and how errors in the diurnal cycle influence related aspects of the circulation, such as the sea breeze. First, the ability of the model to re-produce the diurnal cycle of precipitation over the global tropics is assessed (section 3). Second, the Cape York Peninsula in northeastern Australia (marked by the red box in Fig. 1) is used as a case study to un-derstand the impact of convective parameterization on sea-breeze dynamics and convection initiation (section 4). Third, the hypotheses suggested from the Cape York Peninsula analysis are tested over the entire Maritime Continent region (section 5).
2. Model simulations and observations
The MetUM was run using an atmosphere–land con-figuration named Global Atmosphere/Global Land (GA4; Walters et al. 2014;Mizielinski et al. 2014) at 0.1758 3 0.1178 horizontal resolution (approximately 12-km grid spacing at midlatitudes and 17 km at the equator) and 85 vertical levels (20 in lowest 3 km). SSTs and sea ice were prescribed daily from the Operational Sea Surface Temperature and Sea Ice Analysis (OSTIA;
Donlon et al. 2012;Martin et al. 2015) dataset, which
FIG. 1. The Maritime Continent region as defined for the anal-ysis. Gray shading represents orography height and the red box marks the subdomain over the Cape York Peninsula.
has a native resolution of1/208. The version of the MetUM
used in this study is semi-Lagrangian, semi-implicit, and nonhydrostatic with a terrain-following coordinate system
(Davies et al. 2005). Brief descriptions of the standard
model version GA4 parameterizations can be found in
Walters et al. (2014), including the surface (Essery et al.
2001;Best et al. 2011), clouds (Wilson et al. 2008a,b), the
planetary boundary layer (PBL;Lock et al. 2000), cumulus convection (Gregory and Rowntree 1990), and mixed-phase cloud microphysics (Wilson and Ballard 1999).
Three global MetUM simulations (M. J. Roberts 2013, unpublished data) are used in this study and their dif-ferences are summarized inTable 1. The first (PARAM) employs the standard GA4 MetUM’s parameterization schemes. The second (EXPLICIT) is essentially the same as PARAM but with the deep and shallow convective parameterization switched off, permitting the model to develop convection explicitly. Initial tests, however, found this configuration suffered from numerical in-stabilities, particularly at high latitudes, where the reg-ular latitude–longitude grid in the MetUM implies extremely fine spacing in the east–west direction. For operational NWP at kilometer scale, the Met Office now employs the blended turbulence scheme (Boutle et al. 2014), which dynamically combines the standard MetUM one-dimensional (1D) PBL scheme with a 3D Smagor-insky turbulence scheme, depending on how well re-solved the turbulent scales are predicted to be. Including the blended turbulence scheme in the EX-PLICIT configuration allowed the simulations to be performed without model failures and also to behave in a similar way to PARAM away from regions of cu-mulus convection, so the blended turbulence scheme is used in EXPLICIT in this paper. The disadvantage of the blended scheme was that, in regions of climato-logically significant shallow convection (such as the trade wind regions), EXPLICIT very clearly gave a poor representation of low cloud cover.
The third simulation (SCUMULUS) is the same as EXPLICIT but with a parameterization of shallow convection included to improve the representation of low cloud cover in subtropical regions. This is the same as the convection parameterization in PARAM, but the closure in the parameterization of deep convection is strongly damped as the CAPE becomes significant so that it is restricted to represent only weak convection
and produce almost no precipitation. This is the same convection parameterization as is used in the MetUM convection-permitting configuration in the Cascade project (Pearson et al. 2014). As a result, SCUMULUS performed as well as PARAM in the subtropics while, for the metrics analyzed here, EXPLICIT and SCUMULUS behave in a similar way. Including both simulations in this study is worthwhile because the period analyzed is more than a year into a set of climate simulations, and the similarities between EXPLICIT and SCUMULUS give confidence that the differences between the simu-lations with parameterized and nonparameterized deep convection are not simply because of interannual vari-ability or remote influences.
The model was initialized in March 2008 from a cli-matological state generated by a multiyear 17-km exper-iment and was run with a time step of 4 min for a period of 4 yr. Because of the large data volumes produced by the model, subdaily model diagnostics were only output for one of the model years (March 2009–February 2010); thus, only data from the Southern Hemisphere wet season (November–February) during this period are used here.
A grid spacing of 17 km is a coarse resolution at which to run a climate model without a convective parameteriza-tion. To truly resolve convection, sub-kilometer model grid spacings are necessary; but equally, as discussed above, convective parameterization also produces signifi-cant biases. The diurnal cycle is the first-order mode of variability in the climate system and has been investigated extensively in recent work from the Cascade project. For metrics related to the diurnal cycle (e.g., precipitation, propagation of storms, and convective triggering) limited-area model simulations performed in a similar way when run without a convective parameterization at 12, 4, and 1.5 km and were closer to reality than runs with a con-vective parameterization at 12 and 40 km (Pearson et al.
2014; Marsham et al. 2013; Birch et al. 2014a,b).
Convection-permitting versions of the MetUM are, however, known to overestimate precipitation amounts
(Kendon et al. 2012;Birch et al. 2014b). Here we are less
interested in absolute amounts of rainfall but in how the biases in the diurnal cycle can feed back on other aspects of the model, an aspect that is better represented in the convection-permitting configurations.
This study uses two precipitation products derived from satellite observations: TRMM 3B42 (Huffman et al. 2007;
TABLE1. Summary of the model simulations used in this study.
Deep convection Shallow convection PBL
PARAM Parameterized Parameterized MetUM GA4 standard (Lock et al. 2000) EXPLICIT Explicit Explicit Blended turbulence scheme (Boutle et al. 2014) SCUMULUS Explicit Parameterized Blended turbulence scheme (Boutle et al. 2014)
NASA 2015) and the CPC morphing method (CMORPH;
Joyce et al. 2004; NOAA 2015). These products are
known to have particular problems over steep topog-raphy, where biases have a strong dependence on elevation (Romilly and Gebremichael 2011), and mag-nitudes can exceed 50%–100% of the mean annual rainfall (Habib et al. 2012). Although both the satellite products used in this study have a 3-h time resolution, it should be noted that the satellite-derived precipitation maximum corresponds with the maximum in deep con-vective precipitation, which may be delayed by 1 or 2 h
relative to surface observations that include earlier rainfall from shallower clouds (Dai et al. 2007). Nonetheless, recent work byAckerley et al. (2014)made use of both gauge and satellite data to assess the diurnal cycle of rainfall over northwestern Australia and found the 3-hourly satellite observations agreed well with the ground observations. In this study, the absolute amounts of rainfall are of second-ary importance to the timing of the diurnal cycle, and the possible 1–2-h error in the timing of the peak rainfall in the satellite observations is smaller than the model error pro-duced by convective parameterization (.5 h).
FIG. 2. Local standard time of the precipitation maximum computed as the first harmonic of the diurnal cycle in (a)–(d) TRMM observations and the three model simulations (PARAM, EXPLICIT, and SCUMULUS). Twelve months of data were used for both the observations and the model.
3. Global and regional diurnal cycle
Switching off the convective parameterization causes a step change in the way convection is repre-sented that is in broad agreement with the findings of
Sato et al. (2009).Figures 2and3show the local time of
the precipitation maximum computed as the first har-monic of the diurnal cycle over the 1-yr period for the global tropics and the Maritime Continent region, re-spectively. In the TRMM satellite observations, the peak in precipitation over tropical land regions gener-ally occurs in the late afternoon and evening [1800–0000 local standard time (LST), orange and pink colors]. In PARAM, the peak over tropical land occurs between 0900 and 1500 LST (green and yellow colors), empha-sizing the common bias in models with parameterized convection, where the peak in precipitation occurs around midday, more than 6 h before the observed peak
(Dai 2006;Ackerley et al. 2015). When the convective
parameterization is switched off (EXPLICIT), the tim-ing in the diurnal cycle over land improves dramatically in regions such as the islands of the Maritime Continent, northwestern Australia, the Amazon region, and the Sahel region of Africa. Since very little rain is produced by parameterized shallow convection, the results for SCUMULUS and EXPLICIT are similar.
The signal over the noncoastal oceans in TRMM is noisier than over land, at least in part because the am-plitude of the diurnal cycle over the remote ocean is smaller than over land and coastal oceans (e.g.,Peatman
et al. 2014) and sometimes has a double peak. EXPLICIT
reproduces a similar noisy signal over the tropical oceans, whereas PARAM is dominated by peak rainfall between 0000 and 0600 LST. The offshore propagation of storms is evident in TRMM in the coastal waters around the Maritime Continent (Fig. 3), in agreement
withKikuchi and Wang (2008). Convection initiates in
the late afternoon and early evening over the land and propagates offshore in the early hours of the morning (0000–0600 LST, purple and blue colors), peaking in late morning 200–500 km away from the coasts (0800–1200 LST, green colors). There is some indication of this propaga-tion in PARAM, but it occurs too early in the diurnal cycle (2200–0400 LST, purple and blue colors). There are improvements to the timing in EXPLICIT and SCUMULUS; for example, propagation is evident off the west coast of Sumatra and in the coastal seas between the islands, but the signal is noisy.
4. Cape York Peninsula
Sea-breeze dynamics are known to play an important role in the initiation of convection (Saito et al. 2001;
Wapler and Lane 2012) and the formation of cloud lines
(Noonan and Smith 1986;Goler et al. 2006) and borelike
waves (Goler and Reeder 2004;Smith et al. 2006;Birch
and Reeder 2013) around the coastlines of northern
Australia. The Cape York Peninsula in northeastern Australia (red box,Fig. 1) is one example; in the af-ternoon, sea breezes form on the west and east coasts,
FIG. 4. (top)–(bottom) Mean diurnal cycle of precipitation over the Cape York Peninsula for February (mm 3 h21): (left)–(right) TRMM observations and the three model simulations
(PARAM, EXPLICIT, and SCUMULUS). The TRMM observations are averaged over years 2006–10. Note that the observed and model datasets are staggered in time by 1.5 h.
propagate inland, and create convergence zones in which convection is initiated (see theappendixfor an example case). The Cape York Peninsula is used as a case study for initial assessment of the impact of convective parame-terization on sea-breeze strength and precipitation, be-cause the geometry of the region is reasonably simple and the main rain-producing mechanism is understood
(Reeder et al. 2013). Monsoon onset over northern
Australia occurs at the end of December (Hendon and
Liebmann 1990), and prior to this there is minimal rain
over the Cape York Peninsula. To understand the influ-ence of convective biases on sea-breeze dynamics, the three model simulations are compared for both a dry month (November) and a wet month (February).
The mean diurnal cycles of TRMM and model pre-cipitation for February are shown inFig. 4. The TRMM
observations show a peak in precipitation over land between 1600 and 1900 LST and a peak over the coastal ocean in the early hours of the morning. Plots of CMORPH show a very similar pattern (not shown). The precipitation in PARAM peaks too early in the day both over land (1330 LST) and over the coastal oceans (0330 LST). EXPLICIT and SCUMULUS produce a much more realistic diurnal cycle over both land and sea. All three simulations do, however, overestimate the amount of rainfall, which is particularly true for PARAM over the ocean and EXPLICIT over the land. The amount of rainfall over land is smaller in SCUMULUS than EXPLICIT. Since only a negligible amount of rainfall is produced by the parameterized shallow convection in SCUMULUS, the difference in rainfall amounts in EXPLICIT and SCUMULUS is an indicator of interannual
FIG. 5. Number of occurrences of convergence at 1600 and 1900 LST above a threshold of 331025s21(colored
shading) and the mean rainfall rate at 2030 LST (solid red contours at 10 mm day21intervals between 10 and
variability in the climate system. Model data are only ana-lyzed for a single month (February 2010), and because this period is 3 yr into a climate simulation, it is not expected that EXPLICIT and SCUMULUS should produce the same monthly total rainfall amount.
Rainfall often develops over the peninsula in regions of convergence that forms when the west coast sea breeze propagates inland, meeting the prevailing easter-lies and/or the east coast sea breeze (Fig. A2shows an example).Figure 5shows the number of occurrences of high convergence (.331025s21) at 1600 and 1900 LST and the mean rainfall at 2030 LST for the months of November and February. In November, afternoon rainfall is less than 10 mm day21(apart from very small regions in EXPLICIT and SCUMULUS), and all three simulations produce a similar pattern of high conver-gence, with a peak near the west coast in the northern part of the peninsula and a peak inland of the east coast in the south. The high-frequency features in the south-east of the Cape York Peninsula are associated with the high orography in the region. The lower values along the east coast are a consequence of the prevailing easterly winds, which advect the convergence zone westward of the center of the peninsula. Moreover, as shown by
Goler and Reeder (2004), the sea breezes that form on
each side of the Cape York Peninsula are asymmestric because of the background easterly winds, which causes east coast sea breezes to be deeper and weaker than sea breezes that form on the west coast. By February, after monsoon onset and when rainfall rates have increased, there are large differences between the simulations. In EXPLICIT and SCUMULUS, strong convergence oc-curs frequently over the peninsula, and mean 2030 LST rainfall rates of up to 50 mm day21are associated with it. There are differences between EXPLICIT and SCUMULUS in both the frequency of occurrence of convergence and rainfall (Figs. 5e,f). Rainfall is higher and extends farther south in EXPLICIT, which some-what reduces the frequency of high convergence. This difference is almost certainly caused by interannual variability of the monsoon system, which has an impact on the analysis because the averages are only over 30 days. In contrast, PARAM produces high conver-gence much less frequently, and there is less than 10 mm day21rainfall at 2030 LST.
As the convergence over the peninsula depends on the relative strength of the two sea breezes, differences in the convergence between the runs should therefore be a
FIG. 6. Mean zonal wind (colored shading) for (left) November and (right) February at 1900 LST along a transect at 158S. The solid (dashed) black contours represent positive (westerly) wind [negative (easterly) wind]. The vertical black lines mark the coastlines of the peninsula at 158S, and the black areas mark regions below the surface.
result of differences in the sea-breeze representation.
Figure 6 shows a transect at 158S of the mean zonal
winds at 1900 LST (the approximate time of the peak in sea-breeze strength and precipitation in TRMM, EXPLICIT, and SCUMULUS; Fig. 4) for November and February in each of the simulations. The prevailing wind is easterly between the surface and at least 600 hPa (blue shading, dashed contours), and the west coast sea breeze is illustrated by the positive winds (red shading, solid contours) between 1408and 1428E. In November, before the onset of significant convective activity, the west coast sea breeze is of a similar depth and magnitude in all three simulations. By February, after the onset of the rainy season, the west coast sea breeze has weakened in EXPLICIT and SCUMULUS and appears to be completely absent from PARAM.
Sea breezes develop in response to land–sea temper-ature contrasts; during the day, land heats up quicker than water, driving an onshore flow at low levels and a compensating return flow aloft. As the mass divergence aloft exceeds the mass convergence at low levels, a pressure minimum develops over land (Miller et al.
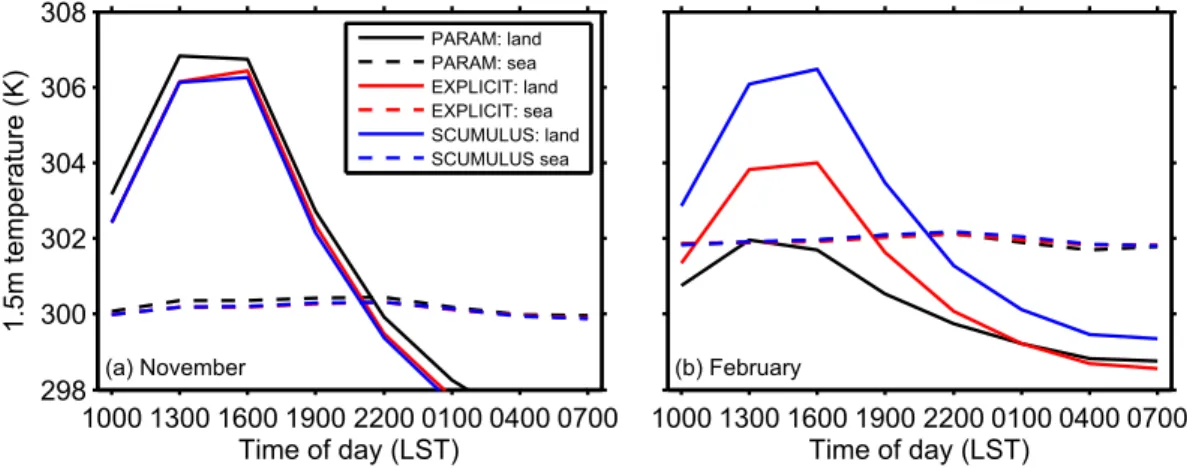
2003).Figure 7shows the mean diurnal cycle of the 1.5-m
temperature over land and sea for November and February. The diurnal cycle of near-surface tempera-tures over the sea is very small (,0.3 K), and there is little difference between the three model simulations (dashed lines). The amplitude of the diurnal cycle over land is approximately 8 K, with the peak occurring be-tween 1300 and 1600 LST (solid lines). In November, the three simulations produce very similar near-surface temperatures over land. By February, when the mon-soon is well established over the Cape York Peninsula, the peak daily temperature in PARAM has decreased so much that the temperature gradient between land and sea is negligible during the middle of the day. A
reduced land–sea temperature contrast can therefore explain the weaker sea breeze and low-level conver-gence in PARAM. The daytime land–sea temperature contrast is higher in EXPLICIT and SCUMULUS, al-though EXPLICIT is up to 2 K cooler than SCUMULUS, and therefore the sea breeze and convergence are weaker in EXPLICIT (cf.Figs. 5e and 5f). The cooler near-surface temperature difference in EXPLICIT can be explained by the higher rainfall rates and more southerly extent of the afternoon/evening rainfall in February over the region (Fig. 5), which act to cool the surface. As discussed above, this is most likely caused by interannual variability of the monsoon system, and re-sults in the following section indicate that EXPLICIT and SCUMULUS behave in a very similar way when averaged over a longer time period and a larger region.
The foregoing results suggest the following conclusion regarding the impact of convective parameterization on sea-breeze dynamics. In February, the convective pa-rameterization in PARAM produces precipitation in the morning, rather than the late afternoon, as observed and simulated in EXPLICIT and SCUMULUS. The rain cools and wets the surface and the boundary layer during the middle of the day, which reduces the land–sea tem-perature contrast and thus the sea-breeze strength at the time of day when sea breezes are at a maximum in re-ality. The behavior of the three simulations is, however, much more similar in November, before the start of the wet season, which strongly suggests that the differences seen in February are caused by convective processes.
Convergence from sea breezes is thought to be one of the main rain-forming mechanisms in the region, and the similarity of the simulations in November suggests that simulations with and without convective parameteriza-tion with 17-km grid spacing are both able to reproduce
FIG. 7. Mean diurnal cycle of the 1.5-m temperature for (a) November and (b) February: PARAM (black), EXPLICIT (red), and SCUMULUS (blue) over land (solid) and sea (dashed).
this main convergence-forming process. In PARAM, however, convection is triggered in the morning, before sea-breeze circulations form. This is because the con-vective parameterization does not respond properly to realistic trigger mechanisms, even if they are present in the model. Once the incorrect diurnal cycle is estab-lished in PARAM, a feedback with the boundary layer acts to weaken the rain-forming mechanism but this occurs second, not first. In EXPLICIT and SCUMULUS, convection must develop explicitly, requiring the convergence created by the sea-breeze circulations to initiate convection. The lack of response of the convective parameterization to low-level convergence is consistent with the findings of Birch et al. (2014a). Sea-breeze convergence is only one example of a mechanism for convection initiation. Over tropical land, many other convective triggers exist, such as cold pool outflows (Tompkins 2001), soil moisture ‘‘hot spots’’
(Taylor et al. 2011), and convergence lines in the lee of
orography (Birch et al. 2014a). The reason the same improvements in the phase of the diurnal cycle of precipitation are seen over tropical land, far inland of coastlines, is because the convection-permitting simu-lations are able to respond more realistically to all these triggers. In the following section, we present a similar analysis but averaged over the entire Maritime Continent region to show that the conclusions reached in this section are applicable more widely and that differences in the model simulations over Cape York are not simply because of variability within the 30-day period analyzed.
5. Maritime Continent
Unlike the Cape York Peninsula, it is wet in the Maritime Continent for the majority of the year
(Ramage 1968), and therefore little is gained from
comparing the months of November and February. In this section the December–February means from the three simulations are compared. Sea-breeze dynamics are evaluated over the entire Maritime Continent region by identifying land and sea points within 100 km of the coastlines using the model land–sea mask (Fig. 8). Grid boxes that contain both land and sea are illustrated by the white regions ofFig. 8and are not included in the analysis. The coastal land regions are then further cat-egorized by the height of the orography, where coastal lowland is defined as regions below 200 m above mean sea level (MSL; light blue shading) and coastal highland as above 200 m MSL (green shading).
The mean diurnal cycle of observed and model rainfall, averaged over the entire Maritime Continent subdomain and split into coastal lowland, coastal highland, and coastal sea, is shown inFig. 9. As with the Cape York Peninsula, peak rainfall rates occur approximately 6 h too early in PARAM compared to the observations, and this does not depend upon orography or surface type (Figs. 9a–c), whereas the diurnal cycle is better represented in EXPLICIT and SCUMULUS. Over coastal highland, all three simulations overestimate the total amount of precipitation. Using rain gauge data,Matthews et al.
(2013) found that TRMM underestimates rainfall in
the highlands of Papua New Guinea by a factor of two. The rainfall in EXPLICIT and SCUMULUS is more than twice that estimated by TRMM; thus, it is unlikely that the difference can be explained by uncertainties in the satellite observations alone. The MetUM at high resolution, with the convection scheme switched off, is known to overestimate precipitation amounts over a number of geographical regions (Kendon et al. 2012;
Birch et al. 2014b).
To understand the impact of convective parameteri-zation on sea-breeze strength,Fig. 10shows the mean diurnal cycle of the 1.5-m temperature, 925-hPa wind speed, and the surface latent (Qe) and sensible (Qh) heat
fluxes. Since the sea-breeze circulations in Fig. 6 are relatively shallow, their impact over coastal highland is much smaller, and thus only coastal sea and coastal lowland are illustrated here. Over sea, the diurnal cycle of all four variables is much weaker than over land, and all three simulations behave in a similar way. The be-havior of EXPLICIT and SCUMULUS is more similar here than in the Cape York case study because the model data are a 3-month mean, rather than a single month, and the averaging area is much larger. Over land,
FIG. 8. Noncoastal sea (dark blue), coastal sea (orange), non-coastal land (brown), non-coastal lowland (,200 m MSL; light blue), and coastal highland (.200 m MSL; light green) grid boxes. Coastal land and sea are defined as within 100 km of the coast. Grid boxes that contain both land and sea (white) are not included in the analysis.
the afternoon temperatures are more than 1 K cooler in PARAM than in EXPLICIT or SCUMULUS (Fig. 10a). The weaker land–sea temperature contrast in PARAM weakens the coastal wind speeds; from 1600 LST onward, PARAM has the weakest wind speeds over both coastal land and sea (Fig. 10b). Over land, bothQhandQepeak
during the middle of the day (Figs. 10c,d), when solar heating is at its highest. Between 1300 and 1600 LST,Qeis
approximately 60 W m22higher, andQhis approximately
60 W m22lower in PARAM than in either EXPLICIT or SCUMULUS. The total heat flux does not change be-tween the simulations, but the Bowen ratio (Qh/Qe)
does, from approximately 0.4 in PARAM to approxi-mately 0.75 in EXPLICIT and SCUMULUS. Large-eddy simulation studies show that a sensible heat flux of 50 W m22 accounts for approximately 1 K of near-surface temperature (Garcia-Carreras et al. 2011), which is consistent with the .1 K temperature differ-ence between the simulations inFig. 10a.
The other factor to consider is the effect of the diurnal cycle on radiation. It is possible that, since rainfall peaks too early in PARAM, cloud cover may also peak too early, reducing the surface radiation flux during the middle of the day and at least partly accounting for the lower afternoon land temperatures.Figures 11a–cshow the mean diurnal cycle of surface downward shortwave radiative flux over the three surface categories. There
are negligible differences between the simulations over coastal lowland and coastal sea and only small differences over coastal highland. There are also small differences in the amounts of cloud in the simulations (cloud fraction and cloud water path; not shown), but the impact of cloud and radiation on surface temperature is clearly small compared to that caused by the surface fluxes (Fig. 10), showing that the differences between the simulations are driven by the surface fluxes, not cloud and radiation.
6. Conclusions
State-of-the-art, high-resolution MetUM climate simu-lations with and without a convective parameterization are used to (i) understand how biases in the representation of convection in GCMs interact with local sea-breeze circu-lations, and (ii) diagnose what aspects of the convective parameterization require improvement. It is well estab-lished that models with convective parameterization gen-erally produce rainfall with a diurnal peak that is too early in the day (e.g.,Dai 2006). Switching off the convective parameterization in high-resolution (17-km grid spacing) global models causes a step change in the way convection is represented. Globally, over both land and sea, the timing of the peak in the diurnal cycle is much improved in the convection-permitting simulations, although the amount of precipitation is biased high, particularly over
FIG. 9. Mean diurnal cycle of precipitation over coastal (a) lowland, (b) highland, and (c) sea for December–February: TRMM (dashed), CMORPH (dotted), PARAM (black), EXPLICIT (red), and SCUMULUS (blue). Observations are a mean over December–February for the years 2006–10.
high orography, which is a known issue in convection-permitting configurations of the MetUM (Birch et al.
2014b;Holloway et al. 2012).
As with most coastal tropical regions, sea-breeze cir-culations in the Maritime Continent are an important rainfall-producing mechanism. They create conver-gence zones inland of the coast, which initiate convec-tive rainfall and control the diurnal timing of rainfall
(Qian 2008). The present study shows that, during dry
periods, sea-breeze circulations are present and are of a similar strength in all of the simulations. This suggests that, with 17-km grid spacing, both versions of the model have the ability to reproduce the sea-breeze circulations required to initiate convection. During wet periods, however, the convective parameterization triggers too early in the day, which cools and wets the land surface during the late morning, reducing the land–sea tem-perature contrast and thus the strength of the sea-breeze circulation. This feedback of errors further reduces the model’s ability to respond realistically to the afternoon convergence produced by the sea breeze. It is important to note that this feedback is an effect of the diurnal cycle errors in the convective parameterization, not a cause of them.
The cooling associated with the incorrect diurnal cycle of rainfall is manifested in a change in the partitioning of the sensible and latent heat fluxes; rainfall in the
morning wets the surface and thus cools and wets the boundary layer through a higher latent heat flux and a lower sensible heat flux. The impact of cloud on the surface radiation budget, and thus on the near-surface temperature, is negligible in comparison (i.e., a radiative impact of a few watts per square meter compared to a surface heat flux impact of 60 W m22). The behavior of the two simulations where the deep convective param-eterization is switched off is similar, giving confidence that the results presented are a result of the represen-tation of convection, rather than simply variability within the climate system.
The global numerical weather prediction (NWP) version of the MetUM currently runs operationally with a grid spacing of 25 km, which is approaching the 17-km grid spacing used in this study. Since the climate and NWP versions of the MetUM use the same con-vective parameterization, it is likely that simulations at NWP time scales also suffer from a similar bias in sea-breeze strength, which has implications for forecasting quantities, such as air quality, wind, temperature, and cloud in coastal regions.
Accurate future rainfall projections under climate change are imperative for future water security but are a major source of model uncertainty (Flato et al. 2013). Future rainfall will be determined by changes to rainfall-generating processes, and if they are not
FIG. 10. Mean diurnal cycle for December–February over coastal sea and coastal lowland for (a) 1.5-m temper-ature, (b) 925-hPa wind speed, and surface (c) latent and (d) sensible heat flux: PARAM (black), EXPLICIT (red), and SCUMULUS (blue) over land (solid) and sea (dashed).
represented accurately in present-day climate simula-tions, there is little chance of achieving accurate future predictions. Improving how and when the parameter-ization triggers convection, and perhaps making it more dependent on low-level convergence, will not only improve the timing and location of rainfall but also the representation of the convective triggers themselves. Moreover, this study highlights the im-portance of evaluating climate models at the processes level: a correct mean climate can be the result of
multiple feedbacks with compensating errors. Process studies can 1) diagnose specific aspects of the model that are problematic, rather than simply highlighting errors and 2) help quantify model uncertainty in cases, such as convection, where multiple models have the same biases and would underpredict uncertainty.
Acknowledgments.This work was partially funded by Meteorological Service Singapore, and CEB’s visit to Monash University was supported financially by the
FIG. 11. Mean diurnal cycle of surface downward shortwave radiation over coastal (a) lowland, (b) highland, and (c) sea for the months December–February: PARAM (black), EXPLICIT (red), and SCUMULUS (blue).
ARC Centre of Excellence for Climate System Sci-ence. R. Schiemann acknowledges Natural Environ-mental Research Council (NERC)–Met Office Joint Weather and Climate Research Programme (JWCRP) HRCM funding. This work made use of the facilities of MONSooN, a supercomputer jointly funded by the Natural Environmental Research Council and the Met Office and JASMIN, a superdata cluster (Lawrence et al. 2012) managed by the Science and Technology Facilities Council Scientific Computing Department (SCD) on behalf of the Centre for Environmental Data Archival. We are grateful to Nicholas Klingaman for his help pro-cessing the TRMM data. Thanks go to many Met Office staff for both technical and scientific advice on model configuration and data management and transfer. Met Office staff were supported by the Joint U.K. DECC/ DEFRA Met Office Hadley Centre Climate Pro-gramme (GA01101). The authors are grateful to the NOAA National Weather Service Climate Prediction Center for providing the CMORPH rainfall data. We also acknowledge the TRMM mission scientists and associ-ated NASA personnel for the production of the TRMM data used in this paper and are grateful to the Goddard Earth Sciences Data and Information Services Center (GES DISC) for making the data available. Finally, the authors thank three anonymous reviewers for their comments, which improved the clarity of this paper.
APPENDIX
Convection Initiation via the Sea Breeze
Figure A1shows visible satellite imagery over the Cape
York Peninsula for the afternoon of 18 December 2005. Cloud begins to form approximately 50 km inland of the
coast at 1300 UTC, which evolves into deep convective storms by 1600 LST. A convection-permitting, limited-area version of the MetUM was run for this case study period to demonstrate how rain forms over the region. The model was run with 4-km grid spacing, with the same configuration as the 4-km simulations described
in Birch et al. (2014b), and was initialized at 1200
UTC (2200 LST) 16 December 2005 and run for 2.5 days. The cooler temperatures (blue shading) and 925-hPa wind vectors inFig. A2illustrate the propa-gation of the sea breeze inland of the coast during the afternoon of 18 December 2005. Similar to the ob-servations, clouds form in the middle of the northern part of the peninsula in a convergence zone created by the collision of the west and east coast sea breezes. Farther south, a convergence zone forms just inland of the east coast and clouds form in the same region by mid-afternoon. By 1800 LST, the clouds in both regions have developed into deep convective storms.
REFERENCES
Ackerley, D., G. J. Berry, C. Jakob, and M. J. Reeder, 2014: The roles of diurnal forcing and large-scale moisture transport for initiating rain over northwest Australia in a GCM.Quart. J. Roy. Meteor. Soc.,140, 2515–2526, doi:10.1002/qj.2316. ——, G. L. Berry, C. Jakob, M. J. Reeder, and J. Schwendike, 2015:
Summertime precipitation over northern Australia in AMIP simulations from CMIP5.Quart. J. Roy. Meteor. Soc.,141, 1753–1768, doi:10.1002/qj.2476.
Best, M. J., and Coauthors, 2011: The Joint UK Land Environment Simulator (JULES), model description—Part 1: Energy and water fluxes. Geosci. Model Dev., 4, 677–699, doi:10.5194/ gmd-4-677-2011.
Birch, C. E., and M. J. Reeder, 2013: Wave-cloud lines over northwest Australia.Quart. J. Roy. Meteor. Soc.,139, 1311– 1326, doi:10.1002/qj.2043.
FIG. A2. The 925-hPa temperature (colored shading) and winds (vectors), and outgoing longwave radiation (white contours at 10 W m22intervals) at (a) 1500 LST and (b) 1800 LST 18 December 2005.
——, J. H. Marsham, D. J. Parker, and C. M. Taylor, 2014a: The scale dependence and structure of convergence fields preceding the initiation of deep convection.Geophys. Res. Lett.,41, 4769–4776, doi:10.1002/2014GL060493.
——, D. J. Parker, J. H. Marsham, D. Copsey, and L. Garcia-Carreras, 2014b: A seamless assessment of the role of convection in the water cycle of the West African Monsoon.J. Geophys. Res. Atmos.,119, 2890–2912, doi:10.1002/2013JD020887.
Boutle, I. A., J. E. J. Eyre, and A. P. Lock, 2014: Seamless strato-cumulus simulation across the turbulent gray zone.Mon. Wea. Rev.,142, 1655–1668, doi:10.1175/MWR-D-13-00229.1. Dai, A., 2006: Precipitation characteristics in eighteen coupled
cli-mate models.J. Climate,19, 4605–4630, doi:10.1175/JCLI3884.1. ——, X. Lin, and K.-L. Hsu, 2007: The frequency, intensity, and diurnal cycle of precipitation in surface and satellite obser-vations over low- and mid-latitudes.Climate Dyn.,29, 727– 744, doi:10.1007/s00382-007-0260-y.
Davies, T., M. J. P. Cullen, A. J. Malcolm, M. H. Mawson, A. Staniforth, A. A. White, and S. Wood, 2005: A new dy-namical core for the Met Office’s global and regional modelling of the atmosphere.Quart. J. Roy. Meteor. Soc.,131, 1759–1782, doi:10.1256/qj.04.101.
Donlon, C. J., M. Martin, J. D. Stark, J. Roberts-Jones, E. Fiedler, and W. Wimmer, 2012: The Operational Sea Surface Tem-perature and Sea Ice Analysis (OSTIA) system.Remote Sens. Environ.,116, 140–158, doi:10.1016/j.rse.2010.10.017. Essery, R. L. H., M. J. Best, and P. M. Cox, 2001: MOSES 2.2
technical documentation. Hadley Centre Tech. Note 30, 30 pp. [Available online athttp://www.metoffice.gov.uk/media/pdf/ 9/j/HCTN_30.pdf.]
Flato, G., and Coauthors, 2013: Evaluation of climate models.
Climate Change 2013: The Physical Science Basis, T. F. Stocker et al., Eds., Cambridge University Press, 741–866.
Garcia-Carreras, L., D. J. Parker, and J. H. Marsham, 2011: What is the mechanism for the modification of convective cloud dis-tributions by land surface–induced flows?J. Atmos. Sci.,68, 619–634, doi:10.1175/2010JAS3604.1.
Gille, S. T., S. G. Llewellyn Smith, and N. M. Statom, 2005: Global observations of the land breeze. Geophys. Res. Lett., 32, L05605, doi:10.1029/2004GL022139.
Goler, R. A., and M. J. Reeder, 2004: The generation of the morning glory. J. Atmos. Sci., 61, 1360–1376, doi:10.1175/ 1520-0469(2004)061,1360:TGOTMG.2.0.CO;2.
——, ——, R. K. Smith, S. Arnup, H. Richter, T. Keenan, and P. May, 2006: Low-level convergence lines over northeastern Australia. Part I: The north Australian cloud line.Mon. Wea. Rev.,134, 3092–3108, doi:10.1175/MWR3239.1.
Gregory, D., and P. R. Rowntree, 1990: A mass flux convec-tion scheme with representaconvec-tion of cloud ensemble char-acteristics and stability-dependent closure.Mon. Wea. Rev.,
118, 1483–1506, doi:10.1175/1520-0493(1990)118,1483: AMFCSW.2.0.CO;2.
Grose, M. R., and Coauthors, 2014: Assessment of the CMIP5 global climate model simulations of the western tropical Pa-cific climate system and comparison to CMIP3. Int. J. Climatol.,34, 3382–3399, doi:10.1002/joc.3916.
Habib, E., M. Elsaadani, and A. T. Haile, 2012: Climatology-focused evaluation of CMORPH and TMPA satellite rainfall products over the Nile basin.J. Appl. Meteor. Climatol.,51, 2105–2121, doi:10.1175/JAMC-D-11-0252.1.
Hendon, H. H., and B. Liebmann, 1990: A composite study of onset of the Australian summer monsoon.J. Atmos. Sci.,47, 2227–2240, doi:10.1175/1520-0469(1990)047,2227:ACSOOO.2.0.CO;2.
Holloway, C. E., S. J. Woolnough, and G. M. S. Lister, 2012: Pre-cipitation distributions for explicit versus parametrized con-vection in a large-domain high-resolution tropical case study.
Quart. J. Roy. Meteor. Soc., 138, 1692–1708, doi:10.1002/ qj.1903.
Huffman, G. J., and Coauthors, 2007: The TRMM Multisatellite Precipitation Analysis (TMPA): Quasi-global, multiyear, combined-sensor precipitation estimates at fine scales.
J. Hydrometeor.,8, 38–55, doi:10.1175/JHM560.1.
Irving, D. B., and Coauthors, 2011: Evaluating global climate models for the Pacific island region.Climate Res.,49, 169–187, doi:10.3354/cr01028.
Joyce, R., J. E. Janowiak, P. A. Arkin, and P. Xie, 2004: CMORPH: A method that produces global precipitation estimates from passive microwave and infrared data at high spatial and tem-poral resolution. J. Hydrometeor., 5, 487–503, doi:10.1175/ 1525-7541(2004)005,0487:CAMTPG.2.0.CO;2.
Kendon, E. L., N. M. Roberts, C. A. Senior, and M. J. Roberts, 2012: Realism of rainfall in a very high-resolution regional climate model. J. Climate, 25, 5791–5806, doi:10.1175/ JCLI-D-11-00562.1.
Kikuchi, K., and B. Wang, 2008: Diurnal precipitation regimes in the global tropics. J. Climate, 21, 2680–2696, doi:10.1175/ 2007JCLI2051.1.
Lawrence, B. N., V. Bennett, J. Churchill, M. Juckes, P. Kershaw, P. Oliver, M. Pritchard, and A. Stephens, 2012: The JASMIN super-data-cluster, 18 pp. [Available online athttp://arxiv.org/ abs/1204.3553.]
Lock, A. P., A. R. Brown, M. R. Bush, G. M. Martin, and R. N. B. Smith, 2000: A new boundary layer mixing scheme. Part I: Scheme description and single-column model tests.Mon. Wea. Rev.,128, 3187–3199, doi:10.1175/1520-0493(2000)128,3187: ANBLMS.2.0.CO;2.
Love, B. S., A. J. Matthews, and G. M. S. Lister, 2011: The diurnal cycle of precipitation over the Maritime Continent in a high-resolution atmospheric model. Quart. J. Roy. Meteor. Soc.,
137, 934–947, doi:10.1002/qj.809.
Marsham, J. H., N. Dixon, L. Garcia-Carreras, G. M. S. Lister, D. J. Parker, P. Knippertz, and C. Birch, 2013: The role of moist convection in the West African monsoon system: Insights from continental-scale convection-permitting simulations.
Geophys. Res. Lett.,40, 1843–1849, doi:10.1002/grl.50347. Martin, G. M., M. A. Ringer, V. D. Pope, A. Jones, C. Dearden,
and T. J. Hinton, 2006: The physical properties of the at-mosphere in the new Hadley Centre Global Environmen-tal Model (HadGEM1). Part I: Model description and global climatology.J. Climate,19, 1274–1301, doi:10.1175/ JCLI3636.1.
Martin, M., E. Fiedler, J. Roberts-Jones, and A. McLaren, 2015: Global ocean OSTIA sea surface temperature and sea ice analysis. Copernicus Marine Environment Monitoring Ser-vice, accessed 14 November 2012. [Available online athttp:// marine.copernicus.eu/web/69-interactive-catalogue.php? option5com_csw&view5details&product_id5SST_GLO_ SST_L4_NRT_OBSERVATIONS_010_001.]
Matthews, A. J., G. Pickup, S. C. Peatman, P. Clews, and J. Martin, 2013: The effect of the Madden–Julian Oscillation on station rainfall and river level in the Fly River system, Papua New Guinea.J. Geophys. Res. Atmos.,118, 10 926–10 935, doi:10.1002/ jgrd.50865.
Miller, S. T. K., B. D. Keim, R. W. Talbot, and H. Mao, 2003: Sea breeze: Structure, forecasting, and impacts.Rev. Geophys.,41, 1011, doi:10.1029/2003RG000124.
Mizielinski, M. S., and Coauthors, 2014: High resolution global climate modelling; the UPSCALE project, a large simulation campaign.
Geosci. Model Dev.,7, 563–591, doi:10.5194/gmdd-7-563-2014. Mori, S., and Coauthors, 2004: Diurnal land–sea rainfall peak
mi-gration over Sumatera Island, Indonesian Maritime Conti-nent, observed by TRMM satellite and intensive rawinsonde soundings. Mon. Wea. Rev., 132, 2021–2039, doi:10.1175/ 1520-0493(2004)132,2021:DLRPMO.2.0.CO;2.
NASA, 2015: Tropical Rainfall Measuring Mission 3B42 pre-cipitation product, version 7. Goddard Earth Sciences Data and Information Service Center, National Aeronautics and Space Administration, accessed 28 August 2014. [Available online athttp://disc.sci.gsfc.nasa.gov/precipitation/documentation/ TRMM_README/TRMM_3B42_readme.shtml.] Neale, R., and J. Slingo, 2003: The Maritime Continent and its role
in the global climate: A GCM study.J. Climate,16, 834–848, doi:10.1175/1520-0442(2003)016,0834:TMCAIR.2.0.CO;2. NOAA, 2015: CPC Morphing Technique precipitation product,
version 1. Climate Prediction Centre, National Oceanic and Atmospheric Administration/National Weather Service, ac-cessed 5 December 2013. [Available online athttp://www.cpc. ncep.noaa.gov/products/janowiak/cmorph_description.html.] Noonan, J. A., and R. K. Smith, 1986: Sea-breeze circulations over
Cape York Peninsula and the generation of Gulf of Carpen-taria cloud line disturbances.J. Atmos. Sci.,43, 1679–1693, doi:10.1175/1520-0469(1986)043,1679:SBCOCY.2.0.CO;2. Pearson, K. J., G. M. S. Lister, C. E. Birch, R. P. Allan, R. J. Hogan,
and S. T. Woolnough, 2014: Modelling the diurnal cycle of tropical convection across the ‘grey zone.’ Quart. J. Roy. Meteor. Soc.,140, 491–499, doi:10.1002/qj.2145.
Peatman, S. C., A. J. Matthews, and D. P. Stevens, 2014: Propagation of the Madden–Julian Oscillation through the Maritime Continent and scale interaction with the diurnal cycle of precipitation.Quart. J. Roy. Meteor. Soc.,140, 814–825, doi:10.1002/qj.2161.
Qian, J., 2008: Why precipitation is mostly concentrated over is-lands in the Maritime Continent.J. Atmos. Sci.,65, 1428–1441, doi:10.1175/2007JAS2422.1.
Ramage, C. S., 1968: Role of a tropical ‘‘Maritime Continent’’ in the atmospheric circulation. Mon. Wea. Rev., 96, 365–370, doi:10.1175/1520-0493(1968)096,0365:ROATMC.2.0.CO;2. Reeder, M. J., R. K. Smith, D. J. Low, S. J. Arnup, L. C. Muir, and G. Thomsen, 2013: Diurnally forced convergence lines in the Australian tropics. Quart. J. Roy. Meteor. Soc.,139, 1283– 1297, doi:10.1002/qj.2021.
Romilly, T. G., and M. Gebremichael, 2011: Evaluation of satellite rainfall estimates over Ethiopian river basins.Hydrol. Earth Syst. Sci.,15, 1505–1514, doi:10.5194/hess-15-1505-2011. Rybka, H., and H. Tost, 2014: Uncertainties in future climate
predictions due to convection parameterisations. Atmos. Chem. Phys.,14, 5561–5576, doi:10.5194/acp-14-5561-2014.
Saito, K., T. Keenan, G. Holland, and K. Puri, 2001: Numerical simulation of the diurnal evolution of tropical island convection over the Maritime Continent.Mon. Wea. Rev.,129, 378–400, doi:10.1175/1520-0493(2001)129,0378:NSOTDE.2.0.CO;2. Sato, T., H. Miura, M. Satoh, Y. Takayabu, and Y. Wang, 2009:
Diurnal cycle of precipitation in the tropics simulated in a global cloud-resolving model. J. Climate, 22, 4809–4826, doi:10.1175/2009JCLI2890.1.
Smith, R. K., M. J. Reeder, P. May, and H. Richter, 2006: Low-level convergence lines over northeastern Australia. Part II: Southerly disturbances. Mon. Wea. Rev., 134, 3109–3124, doi:10.1175/MWR3240.1.
Spengler, T., and R. K. Smith, 2008: The dynamics of heat lows over flat terrain.Quart. J. Roy. Meteor. Soc.,134, 2157–2172, doi:10.1002/qj.342.
Stephens, G. L., and Coauthors, 2010: Dreary state of precipitation in global models.J. Geophys. Res.,115, D24211, doi:10.1029/ 2010JD014532.
Sun, Y., S. Solomon, A. Dai, and R. W. Portmann, 2006: How often does it rain?J. Climate,19, 916–934, doi:10.1175/JCLI3672.1. Taylor, C. M., A. Gounou, F. Guichard, P. P. Harris, R. J. Ellis, F. Couvreux, and M. De Kauwe, 2011: Frequency of Sahelian storm initiation enhanced over mesoscale soil-moisture pat-terns.Nat. Geosci.,4, 430–433, doi:10.1038/ngeo1173. Tompkins, A. M., 2001: Organization of tropical convection in low
vertical wind shears: The role of cold pools.J. Atmos. Sci.,58, 1650– 1672, doi:10.1175/1520-0469(2001)058,1650:OOTCIL.2.0.CO;2. Walters, D. N., and Coauthors, 2014: The Met Office Unified Model Global Atmosphere 4.0 and JULES Global Land 4.0 configurations.Geosci. Model Dev.,7, 361–386, doi:10.5194/ gmd-7-361-2014.
Wapler, K., and T. Lane, 2012: A case of offshore convective initiation by interacting land breezes near Darwin, Australia. Meteor. Atmos. Phys.,115, 123–137, doi:10.1007/ s00703-011-0180-6.
Wilson, D. R., and S. P. Ballard, 1999: A microphysically based precipitation scheme for the UK meteorological office unified model.Quart. J. Roy. Meteor. Soc.,125, 1607–1636, doi:10.1002/ qj.49712555707.
——, A. C. Bushell, A. M. Kerr-Munslow, J. D. Price, and C. J. Morcrette, 2008a: PC2: A prognostic cloud fraction and con-densation scheme. I: Scheme description.Quart. J. Roy. Me-teor. Soc.,134, 2093–2107, doi:10.1002/qj.333.
——, ——, ——, ——, ——, and A. Bodas-Salcedo, 2008b: PC2: A prognostic cloud fraction and condensation scheme. II: Cli-mate model simulations.Quart. J. Roy. Meteor. Soc., 134, 2109–2125, doi:10.1002/qj.332.
Yang, G.-Y., and J. Slingo, 2001: The diurnal cycle in the tropics.Mon. Wea. Rev.,129, 784–801, doi:10.1175/1520-0493(2001)129,0784: TDCITT.2.0.CO;2.