80:6 (2018) 61–68 | www.jurnalteknologi.utm.my | eISSN 2180–3722 |
Jurnal
Teknologi
Full Paper
COMPARISON
BETWEEN
HYBRID
QUANTILE
REGRESSION
NEURAL
NETWORK
AND
AUTOREGRESSIVE
INTEGRATED
MOVING
AVERAGE
WITH EXOGENOUS VARIABLE FOR FORECASTING OF
CURRENCY
INFLOW AND
OUTFLOW IN
BANK
INDONESIA
Dedy Dwi Prastyo
a, Suhartono
a*, Agnes Ona Bliti Puka
b,
Muhammad Hisyam Lee
ca
Department of Statistics, Institut Teknologi Sepuluh
Nopember, Kampus ITS-Sukolilo, Surabaya 60111, Indonesia
b
Study Program of Mathematics Education, Institut Keguruan
dan Teknologi Larantuka, Larantuka Flores Timur 86212,
Indonesia
c
Mathematics Department, Universiti Teknologi Malaysia,
81310 UTM Johor Bahru, Johor, Malaysia
Article history Received
10 October 2017
Received in revised form
14 June 2018 Accepted 30 June 2018 Published online 5 October 2018
*Corresponding author
[email protected]
Graphical abstract
Abstract
Some problems arise in time series analysis are nonlinearity and heteroscedasticity. Methods that can be used to analyze such problems are neural network and quantile regression. There are a lot of studies and developments on both methods, but the study that focuses on the performances of combination of these two methods applied in real case are still limited. Therefore, this study performed a comparison between hybrid Quantile Regression Neural Network (QRNN) and Autoregressive Integrated Moving Average with Exogenous Variable (ARIMAX). Both methods were employed to model the currency inflow and outflow from Bank Indonesia in Nusa Tenggara Timur province. Based on the empirical result, the hybrid QRNN method provided better forecasting for currency outflow whereas the ARIMAX resulted in better forecasting for the inflow.
Keywords: ARIMAX, neural network, quantile regression, inflow, outflow
Abstrak
Sesetengah masalah timbul dalam analisis siri masa adalah tidak linear dan heteroscedasticity. Kaedah yang boleh digunakan untuk menganalisis masalah ialah neural network dan quantile regression. Terdapat banyak kajian dan perkembangan dalam kedua-dua kaedah, tetapi kajian yang menumpukan pada gabungan prestasi kedua-dua kaedah yang digunakan dalam kes sebenar masih terhad. Oleh itu, kajian ini menunjukkan perbandingan antara hybrid Quantile Regression Neural Network (QRNN) dan Autoregressive Moving Average dengan exogenous variable (ARIMAX). Kedua-dua kaedah ini digunakan untuk memodel aliran masuk dan keluar mata wang dari Bank Indonesia di wilayah Nusa Tenggara Timur. Berdasarkan hasil empirikal, kaedah hybrid QRNN memberikan ramalan yang lebih baik untuk aliran keluar sementara ARIMAX menghasilkan ramalan yang lebih baik untuk aliran masuk.
Kata kunci: ARIMAX, neural network, quantile regression, aliran masuk wang, aliran keluar © 2018 Penerbit UTM Press. All rights reserved
1.0 INTRODUCTION
Time series forecasting analyzes historical phenomena to build a model and produce forecasts for the future. Time series data consists of linear and nonlinear correlation structures [1]. In many researches, linear correlation between input and output can be overcome using Autoregressive Integrated Moving Average (ARIMA) model. The ARIMA is flexible enough but has limitations. It assumes a linear pattern within the data so nonlinear pattern cannot be captured by the model [1].
A research on calendar variations effect that modified ARIMA model by incorporating holiday information as a deterministic input has been done by Liu [2]. Later, the development of time series regression with calendars variation models for the sale of Muslim fashion products using ARIMA with exogenous variable (ARIMAX) was proposed by Lee et al. [3].
There are two types of forecasting, i.e. point forecasting and interval forecasting. Point forecasting often gives unsatisfactory results in decision making during an extreme and uncertain situations, for example when a disaster occurs or certain event happens. In such situations, the interval forecasts are better than point forecast because there are many errors in point forecasting [4] depicted by several point forecasts are far away from the real observation. To solve this problem, point forecasting is converted to interval forecasting. Chatfield [5] stated that intervals forecast are crucial in assessing future uncertainty, devising different strategies for possible outcomes, forecasting comparisons and exploring different scenarios based on different assumptions.
Interval forecasts of time series data require the assumption of constant residual’s variance over time. However in finance, typically the time series data has non constant variance over time so-called heteroscedasticity. The existence of heteroscedasticity is a major concern in the application of regression analysis including variance analysis since the test parameters with t-test statistics become invalid and tend to reject the hypothesis. In addition, the estimates for regression parameters tend to widen. The consequence of this heteroscedasticity is that the Ordinary Least Square (OLS) estimator becomes unbiased and consistent but inefficient. Therefore, Taylor and Bunn [6] use Quantiles Regression (QR) for intervals forecasting. The QR method is an approach in regression analysis introduced by Konker and Bassett [7] by dividing or splitting data into several groups that are suspected to have different estimation values on these quantities. Koenker and Hallock [8] suggested that QR is useful to model data that has an asymmetric conditional distribution pattern, data that have a solid density in the tail (top or bottom) and the cut splits. Several studies attempt to develop a method of quantitative regression in hybrid forecasting. Taylor [9] applied a new approach to estimate the distribution of conditional opportunities from stock data. The study used a quantitative regression approach to address the need for distribution assumptions and use neural
networks to estimate the strength of the nonlinear quantitative model. Arunraj and Ahrens [10] use the hybrid Seasonal ARIMAX (SARIMAX) and QR to model daily food sales forecasting. After performing comparisons with some forecasting methods such as naive forecasting, traditional SARIMA and Multilayer Perceptron Neural Network (MLPNN), it is said that the hybrid SARIMAX-QR provides better interval forecasting accuracy than other methods.
Indonesia is a developing country that has policy about money circulation done by Bank Indonesia whose authority is regulated in Act number 23 of 1999 concerning Bank Indonesia (BI). To manage future stocks of currencies, an accurate estimate of inflow and outflow is required. The phenomenon of inflow and outflow in Indonesia is closely related to the influence of time, where the historical data of inflow and outflow useful in forecasting the currency inflow and outflow circulating in Indonesia. In the case of inflow and outflow, local socio-cultural factors such as Eid al-Fitr celebrations, Chinese New Year celebrations, and Nyepi holidays have an important effect on modeling. Indonesia is a country with the majority of Muslim, which causes a lot of economic data tends to have a seasonal pattern influenced by two types of calendars, namely Christian calendar and the Islamic calendar. The effects of Christian calendar led to high or low inflow and outflow in certain months, while the Islamic calendar affected the fluctuation of inflow and outflow in the months around the Eid al-Fitr holiday. These effects are called holiday effects [2, 11, and 12] that cannot be identified as a seasonal effect because Eid al-Fitr holidays occur at various dates and months in the Christian calendar year after year. On monthly data, the effects of Eid al-Fitr vary depending on the date of Eid al-Fitr. To capture this effect, we need a dummy variable that represents each day to occur Eid al-Fitr. The dummy variable used is a weekly dummy, which is four weeks in a month. In addition to using dummy variable for weeks, it also requires to use dummy effects one week before and after Eid al-Fitr. This is supported by many previous studies stating that one week before and after the occurrence of Eid al-Fitr influenced the increase in currency inflow and outflow in BI [13, 14].
This study focused on the time series methods that could handle two special patterns in time series data, i.e. calendar variation and heteroscedasticity. In some cases, improper identification about calendar variation effect will be known as spurious nonlinearity. There are other nonlinear models such as Long Short-Term Memory (LSTM) and Self-Exciting Threshold Autoregressive (SETAR) in time series analysis. But, these two models could not handle heterocedasticity pattern. Therefore, this research focused on hybrid Quantile Regression Neural Network (QRNN) which is known as new nonlinear time series method that could handle both nonlinearity and heteroscedasticity. As the benchmark, the Autoregressive Integrated Moving Average with Exogenous Variable (ARIMAX) model was employed.
Hence, this study aims to model the monthly currency inflow and outflow data in Bank Indonesia by
using hybrid QRNN and ARIMAX approaches for both point and interval forecasting. Root Mean Squared Error (RMSE) and Median Absolute Error (MdAE) criterion are used to compare the accuracy of two models. This paper consists of 5 sections as follows. Section 1 gives an introduction to the method employed. Section 2 describes ARIMA model, ARIMAX model, Quantile Regression and hybrid model. Section 3 gives information about the methodology. Section 4 informs the results and discussion. Section 5 is devoted for a conclusion.
2.0 METHODOLOGY
The hybrid model used in the research is the combination of ARIMAX and QRNN. The hybrid QRNN method has following steps, (1) implementing time series regression modeling, (2) performing ARIMA modeling using Box-Jenkins procedure on residual of time series regression, (3) obtaining prediction value for ARIMAX model, and (4) forecasting hybrid QRNN by using prediction of ARIMAX as independent variables to obtain the final prediction of the hybrid QRNN model [10].
2.1 Time Series Regression
Time series regression includes several components such as trend, cycles, seasonal variations, and irregular fluctuations [11]. Trend refers to upward and downward movement in the event series at time t. Cycle refers to the repetitive movement up and down around the trend level. Seasonal variations refer to the periodic pattern in a period of time occurring within a year and repeated every year. Irregular refers to erratic motion in a period of time. The time series regression is formulated as follows:
𝑍𝑡= 𝑇𝑡+ 𝑆𝑡+ 𝜀𝑡 , (1)
where 𝑍𝑡 observation at time t, 𝑇𝑡 is trend at time t, 𝑆𝑡
represents seasonal factor at time t, and 𝜀𝑡 is error at
time t.
The seasonal pattern in Eq. (1) is modeled by using a dummy variable. Let L be the season (for example month) every year, then seasonal pattern 𝑆𝑡 and
dummy variables are formulated in Eq. (2) and Eq. (3) as follows:
𝑆𝑡= 𝛽𝑆1𝑋𝑠1,𝑡+ ⋯ + 𝛽𝑠(𝐿−1)𝑋𝑠(𝐿−1),𝑡 (2)
with
𝑋𝑠1,𝑡= {1 , if time 𝑡 is at first season0, otherwise
⋮ 𝑋𝑠(𝐿−1),𝑡 = {1 , if time 𝑡 is at (𝐿 − 1) season0, otherwise
(3)
2.2 ARIMAX Model
ARIMA was firstly introduced by Box and Jenkins in 1976. This model combines Autoregressive (AR) and Moving
Average (MA) processes. This model can be applied to seasonal or seasonal data and stationary or non-stationary data. The general form of the ARIMA model is defined in Eq. (4) as follows [11, 12]:
𝑍𝑡=
𝜃𝑞(𝐵) ΘQ(𝐵𝐿)
𝜙𝑝(𝐵)Φ𝑃(𝐵𝐿)(1−𝐵)𝑑(1−𝐵𝐿)𝐷 𝑎𝑡 , (4)
with 𝜙𝑝(𝐵) = (1 − 𝜙1𝐵 − ⋯ − 𝜙𝑝𝐵𝑝) is non-seasonal AR
component with order p and 𝜃𝑞(𝐵) = (1 − 𝜃1𝐵 − ⋯ −
𝜃𝑞𝐵𝑞) is non-seasonal MA component with order q. The
Φ𝑃(𝐵𝐿) and ΘQ(𝐵𝐿) are seasonal component for AR and
MA, respectively. The B is backshift operator, L is seasonal period, and 𝑎𝑡is white noise process with zero
mean and constant variance [11].
The ARIMA model with the addition of exogenous variables is called ARIMAX model [12]. The general form of the ARIMAX model with the effect of calendar variation is formulated in Eq. (5) as follows:
𝑍𝑡= 𝜇 𝑡 + ∑𝐽𝑗=1𝛽𝑗𝑉𝑗,𝑡+ ∑𝑆𝑖=1𝛿𝑖𝑀𝑖,𝑡+ 𝑁𝑡 (5)
where 𝑉𝑗,𝑡 is dummy variable representing calendar
variation, 𝑀𝑖,𝑡 is dummy variable representing seasonal
pattern, and 𝑁𝑡 is error that follows ARIMA model in Eq.
(4). The ARIMAX is widely applied in many cases, but in recent years it has been developed into two levels ARIMAX [13]. One level ARIMAX was employed in Prastyo et al. [14] to quantify risk associated with stock return using Value-at-Risk approach. Moreover, the currency inflow and outflow modeling with calendar variation effect has been done by Apriliadara et al. [15] using multivariate time series approach.
2.3 Quantile Regression
The QR method was firstly introduced by Koenker and Basset in 1978 as an expansion of the regression model on conditional quantile where the conditional quantified distribution of the response variable is expressed as a function of the observed covariates. This approach allows estimating the quantitative function of the conditional distribution of response at the various or any desired quantitative values of the researchers [6]. Estimation of parameters in QR can be done by several methods, such as direct approach, rank-score, and resampling [8].
Suppose that given data with t=1,2,3, ..., n is a set of randomly distributed pairs of random variables that are independently and not identical, with a quantile 𝜏 ∈
(0,1) and 𝐹𝑌 is cumulative distribution function (cdf), the
general form of inverse cdf is 𝐹𝑌−1(𝜏) = inf {𝑡 ∈ ℝ: 𝐹𝑌(𝑡) ≥
𝑡}. Suppose there is a linear model with a constant
parameter, an identical and independent error, the conditional quantile nature of the conditional distribution is defined in (6) as follows [6-10]:
𝑄𝜏(𝑌|𝑋) = 𝐹𝑌|𝑋−1(𝜏) = inf{𝑡 ∈ ℝ: 𝐹𝑌|𝑋(𝑡) ≥ 𝑡} (6)
The coefficients 𝛽(𝜏) of QR model, i.e. 𝑌(𝜏) = 𝑄𝜏(𝑌|𝑋) =
𝛽(𝜏)𝑋 + 𝜀, can be obtained by minimizing Eq. (7):
𝜌(𝜏) = (𝜏 ∑𝑛𝑖|𝑦𝑖≥𝑥𝑖𝑇𝛽|𝑒𝑖|+ (1 − 𝜏) ∑ |𝑒𝑖|
𝑛
where 𝑒𝑖= 𝑦𝑖− 𝑥𝑖𝑇𝛽.
The modeling using hybrid QRNN method was done by regressing observation data on prediction values obtained from ARIMAX as predictor [10] written as follows:
𝑌𝑡(𝜏) = 𝛽(𝜏) 𝑋̂𝑡+ 𝜀𝑡 , (8)
where 𝑋̂𝑡 is obtained from prediction using ARIMAX. The
estimation of QRNN is done using qrnn.fit function available in qrnn package in R software. The hidden layer employs hyperbolic tangent sigmoid function for nonlinear QRNN models whereas linear function is chosen for linear model [16].
2.4 Data Source and Variable
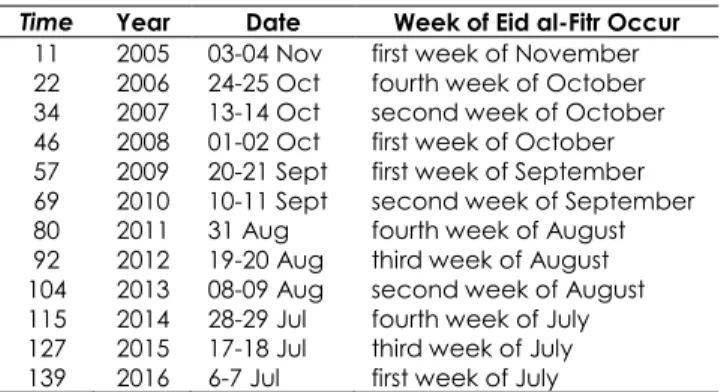
The data used in this study is secondary data with two variables, i.e. currency inflow and outflow, obtained from Bank Indonesia in Nusa Tenggara Timur (NTT) province. There are twelve years of monthly inflow and outflow (144 records for each). All series are divided into in-sample (training) and out-sample (testing) data. The in-sample data are spanning from January 2005 until December 2015. The out-sample data span from January to December 2016. The one year forecasting is a common practice in Bank Indonesia for monetary planning. In this work, the inflow and outflow series are treated as a univariate dependent variable. The modeling also involves dummy variables to capture the calendar variation effect of Eid al-Fitr. The notation used to symbolize these variables can be seen in Table 1. Information about the date when Eid al-Fitr occurs is shown in Table 2.
Table 1 Notation and Variable
Notation Variable
𝑌1,𝑡 Currency inflow at time t 𝑌2,𝑡 Currency outflow at time t
𝑡 Time
𝑀𝑖,𝑡 Dummy for month at time t, with i=1,..,12
𝑉𝑗,𝑡−1 Dummy for a month before Eid al-Fitr
𝑉𝑗,𝑡 Dummy for a month when Eid al-Fitr occurs
𝑉𝑗,𝑡+1 Dummy for a month after Eid al-Fitr
Table 2 The Occurrence of Eid Al-Fitr
Time Year Date Week of Eid al-Fitr Occur
11 2005 03-04 Nov first week of November 22 2006 24-25 Oct fourth week of October 34 2007 13-14 Oct second week of October 46 2008 01-02 Oct first week of October 57 2009 20-21 Sept first week of September 69 2010 10-11 Sept second week of September 80 2011 31 Aug fourth week of August 92 2012 19-20 Aug third week of August 104 2013 08-09 Aug second week of August 115 2014 28-29 Jul fourth week of July 127 2015 17-18 Jul third week of July 139 2016 6-7 Jul first week of July
Many measurements of forecast accuracy have been proposed in the past. Several authors have made recommendations about what should be used when comparing the accuracy of forecast methods applied to univariate time series data. Many of these proposed measures of forecast accuracy are not generally applicable, can be infinite or undefined, and can produce misleading results [17]. For this research, we use the common used accuracy measurements, i.e. RMSE and MdAE, whose scale depends on the scale of the data. These are useful when comparing different methods applied to the same data.
3.0 RESULTS AND DISCUSSION
3.1 Simulation Study
Before applying the hybrid QRNN to forecast currency inflow and outflow, the simulation study was done to prove that the proposed hybrid QRNN could handle some pattern in time series models well, i.e. trend, seasonality, calendar variation, and particularly both nonlinearity and heteroscedasticity patterns.
In this work, a simulation study is performed by generating data containing trend, seasonal (months), components for calendar variations (Eid al-Fitr holidays), and noise series. This simulation extends the simulation done by Suhartono et al. [18]. The generated sample size is 144 by replication 5. Components for trend patterns, seasonal or calendar variations (during and before Eid al-Fitr) are presented in separate plots in Figure 1. Trend components and effects of calendar variations give the biggest influence on Yt, where the Yt
increase significantly during Eid al Fitr holidays.
The simulation in this study involves two scenarios. Scenario one simulates the homogeneous seasonal pattern with residuals of time series regression follow the linear model. Scenario two simulates heterogeneous seasonal pattern with residuals of time series regression follow the nonlinear model. Each scenario is repeated five times by generating residual component of the time series regression process.
After obtaining data from each scenario in the first stage, the next step is to model the data from each scenario using ARIMAX and hybrid QRNN model. The study about procedure to choose input in Neural Network with application to currency inflow and outflow forecasting in Indonesia was done by Suhartono et al. [19]. The RMSE and MdAE criteria are used to determine the best model for predicting data in each scenario.
Table 3 informs that hybrid QRNN outperforms ARIMAX for out-sample forecasting based on both RMSE and MdAE. The bold number shows smaller performance measurement that indicate the best model. The results showed RMSE and MdAE from in-sample and out-in-sample give different best model or not consistent results for choosing the best forecasting model. The results at out-sample are frequently used for selecting the best model and this scenario known as cross-validation principle for choosing the best model.
Figure 1 Time Series Plot for Trend (a), Homogenous Seasonal (b), Heterogeneous Seasonal (c), Calendar Variation Effect (d), Linear Noise (e), and Nonlinear Noise (f)
Table 3 Comparison of RMSE and MdAE for Scenario 1 and 2
Model In- RMSE MdAE
sample sample Out- sample In- sample Out- Scenario 1 ARIMAX 1.045 1.789 0.654 1.393 Hybrid QRNN 0.931 1.776 0.599 1.194 Scenario 2 ARIMAX 3.619 3.891 3.336 4.461 Hybrid QRNN 4.622 4.755 2.894 3.519
3.2 Inflow and Outflow Modeling
The characteristics of currency inflow and outflow in NTT province can be seen in Figure 2. It shows that the currency inflow and outflow experienced an increase in certain months each year. It indicates that different months give different effects to currency inflow and outflow value in NTT. In addition, the celebration of Eid al-Fitr seems to have an effect on the currency inflow and outflow. Thus, months and Eid al-Fitr effects are included in ARIMAX modeling in the form of dummy variables.
The development of hybrid QRNN refers to time series regression modeling. The result produces residuals that are not white noise because all p-values are less than 5% until lag 36, therefore, significant lags based on ACF and PACF plots are added and re-estimation is performed. Based on ACF and PACF plots, the model for residual is ARIMA (1,0,0)(1,0,0)12 that has fulfilled independent assumption and normal distribution. Next, the ARIMAX model is formulated as a combination of
ARIMA model and time series regression model of calendar variation and re-estimated simultaneously.
Figure 2 Time Series Plot of Currency Inflow (a) and Outflow (b) in NTT Province
Furthermore, the normality of residual component was tested using Kolmogorov-Smirnov (KS) test. The residuals of ARIMAX model for currency inflow in NTT do not follow normal distribution. Abnormalities of residual are usually caused by an outlier. A reasonable approach to tackle this issue is by applying quantile regression modelling. The ARIMAX model for currency inflow and outflow that considers the effect of calendar variation as formulated in (9) and (10) have fulfilled the white noise assumptions.
𝑍̂1𝑡= 0.799 𝑡 + 𝑀̂𝑡+ 𝑉̂𝑡+ 𝑁̂𝑡 , (9)
where seasonal component is
𝑀̂𝑡= 415.963 𝑀1,𝑡+ 230.094 𝑀2,𝑡+ 186.016 𝑀3,𝑡+
128.420 𝑀4,𝑡+ 122.71 𝑀5,𝑡+ 119.189 𝑀6,𝑡+
165.439 𝑀7,𝑡+ 179.612 𝑀8,𝑡+ 131.128 𝑀9,𝑡+
114.063 𝑀10,𝑡+ 98.686 𝑀11,𝑡+ 106.736 𝑀12,𝑡,
the calendar variation component is
𝑉̂𝑡= 84.451 𝑉1,𝑡+ 60.469 𝑉2,𝑡+ 36.749 𝑉3,𝑡− 13.254 𝑉4,𝑡+
35.130 𝑉1,𝑡+1− 17.654 𝑉2,𝑡+1− 14.112 𝑉3,𝑡+1+
93.657 𝑉4,𝑡+1,
and the error component follows AR model as follows:
𝑁̂𝑡= 1
(1 − 0.360 𝐵)(1 − 0.695 𝐵12) 𝑎𝑡
and
𝑍̂2𝑡= 2.11 𝑡 + 𝑀̂𝑡+ 𝑉̂𝑡+ 𝑁̂𝑡 , (10)
𝑀̂𝑡= 169.45 𝑀1,𝑡+ 121.90 𝑀2,𝑡+ 197.48 𝑀3,𝑡+
164.40 𝑀4,𝑡+ 235.407 𝑀5,𝑡+ 284.589 𝑀6,𝑡+
280.298 𝑀7,𝑡+ 207.491 𝑀8,𝑡+ 310.046 𝑀9,𝑡+
8.406 𝑀10,𝑡+ 277.770 𝑀11,𝑡+ 412.398 𝑀12,𝑡,
the calendar variation component is
𝑉̂𝑡= −9.184 𝑉1,𝑡+ 143.587 𝑉2,𝑡+ 140.088 𝑉3,𝑡+
227.971 𝑉4,𝑡+ 356.431 𝑉1,𝑡+1+ 71.465 𝑉2,𝑡+1−
54.722 𝑉3,𝑡+1+ 1.980 𝑉4,𝑡+1,
and the error component follows AR model as follows:
𝑁̂𝑡=
1
(1 − 0.386 𝐵2)(1 − 0.998 𝐵12) 𝑎𝑡
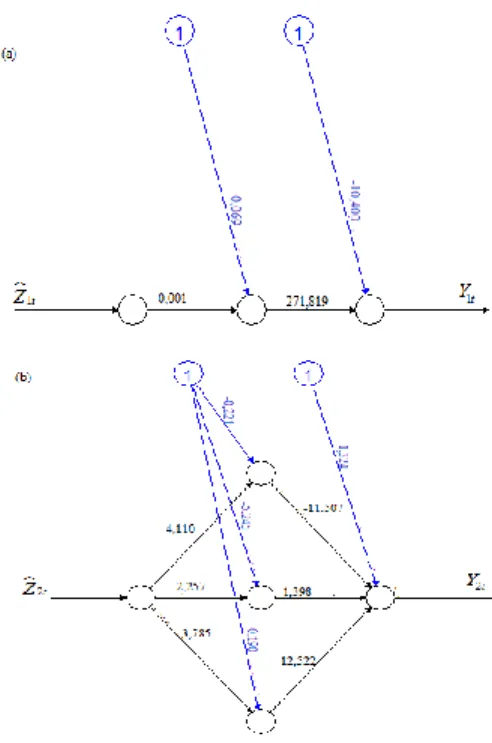
The prediction of inflow and outflow using ARIMAX in Eq. (9) and (10) are used as input in hybrid QRNN. The optimal number of hidden neuron is obtained using experimental combinations of 1,2,3,4,5,10 and 15 hidden neurons. The best models are selected based on smallest RMSE and MdAE criteria on each input and neuron. The hybrid QRNN models for inflow and outflow, for three quantile 2.5%, 50%, and 97.5%, are respectively obtained by imposing the prediction value from ARIMAX model as an independent variable as in Eq. (11) and (12) that are illustrated in Figure 3.
𝑌1𝑡(𝜏 = 0.025) = −10.4 + 271.819 tanh (0.5 × (0.069 + 0.001 𝑍̂1𝑡)) + 𝑎𝑡 (11a) 𝑌1𝑡(𝜏 = 0.50) = 1886.618 + 1889.325 tanh (0.5 × (−7.273 + 0.23 𝑍̂1𝑡)) + 𝑎𝑡 (11b) 𝑌1𝑡(𝜏 = 0.975) = −7.918 + 19.718 tanh (0.5 × (0.983 + 0.157 𝑍̂1𝑡)) + 𝑎𝑡 (11c)
where 𝑍̂1𝑡 is prediction from Eq. (9), and
𝑌2𝑡(𝜏 = 0.025) = 2.524 − 0.402 tanh (0.5 × (23.592 − 63.057 𝑍̂2𝑡)) + 1.414 tanh (0.5 × (−12.611 + 4.155 𝑍̂2𝑡)) + 9.167 tanh (0.5 × (−0.342 + 0.05 𝑍̂2𝑡)) + 𝑎𝑡 (12a) 𝑌2𝑡(𝜏 = 0.50) = 1.324 − 11.507 tanh (0.5 × (−0.221 + 4.110 𝑍̂2𝑡)) + 1.398 tanh (0.5 × (−5.245 + 2.257 𝑍̂2𝑡)) + 12.522 tanh (0.5 × (−0.190 + 3.785 𝑍̂2𝑡)) + 𝑎𝑡 (12b) 𝑌2𝑡(𝜏 = 0.975) = 2.438 − 0.655 tanh (0.5 × (−2.271 − 4.228 𝑍̂2𝑡)) + 1.711 tanh (0.5 × (−6.672 + 2.118 𝑍̂2𝑡)) + 0.567 tanh (0.5 × (−77.109 − 72.942 𝑍̂2𝑡)) + 𝑎𝑡 (12c)
Figure 3 Architecture of hybrid QRNN for Currency Inflow at quantile 2.5% (a) and Currency Outflow at quantile 50% (b) 3.3 Best Model and Interval Forecasting
The best models for currency inflow and outflow are chosen by comparing the value of RMSE calculated from in-sample data. The result of RMSE along with their standard deviation from in-sample data can be seen in Table 4.
Table 4 Comparison of RMSE and MdAE for In-sample
In-
sample Dev. Std.
RMSE MdAE
ARIMAX Hybrid QRNN ARIMAX Hybrid QRNN Inflow 146 79,349 66,442 37.288 38,628 Outflow 267.9 106.095 95,463 50.372 51,102
Table 5 Comparison of RMSE and MdAE for Out-sample
Out-
sample Dev. Std.
RMSE MdAE
ARIMAX Hybrid QRNN ARIMAX Hybrid QRNN Inflow 211 59.861 129.801 36.122 58.476 Outflow 376 112.309 99.009 96.006 83.414
The hybrid QRNN model produces the best prediction value based on the RMSE in currency inflow and outflow, meanwhile the ARIMAX model scores best based on the MdAE criterion. It indicates that the models which are built using these two approaches are appropriate for forecasting. Then, the performance of these two methods are compared based on out-sample forecasting presented in Table 5. The best model for currency inflow is ARIMAX while the best model for currency outflow is hybrid QRNN. The ARIMAX
model is appropriate with the characteristic of inflow data that contain homogenous and linear pattern. The hybrid QRNN method is suitable to model outflow data that contains heterogeneous and nonlinear pattern.
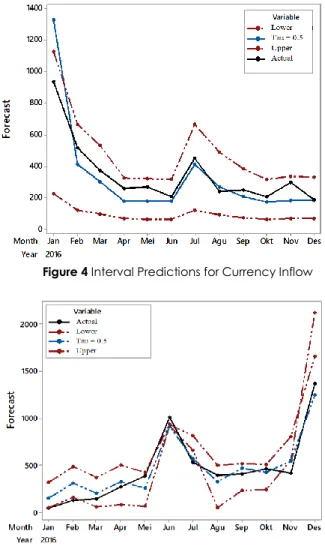
Figure 4 Interval Predictions for Currency Inflow
Figure 5 Interval Predictions for Currency Outflow
Interval forecasting at each month from January to December 2016 for currency inflow and outflow can be visually seen in Figure 4 and 5. Almost all patterns of forecast movement follow actual data pattern. It shows that hybrid QRNN model is not only looks like better in point forecast but also in interval forecast. It can be concluded that the interval prediction using hybrid QRNN can capture the effect of calendar variation.
4.0 CONCLUSION
Based on the empirical results, it can be concluded that the best model to forecast the currency inflow in NTT province is ARIMAX while the best model to forecast outflow is hybrid QRNN. The results of the forecast in 2016 show that the highest inflow of NTT province occurred in January amounted to 817.501 million rupiah. The highest outflow outlook occurred in December amounted to 1461.99 million rupiah.
Considering NTT is one of the provinces in Indonesia with the majority of the population of Christians, thus it causes the highest outflow in December caused by the Christmas and New Year holidays. The second highest outflow occurs in June amounted to 836.58 million rupiah. This is in line with the exploration of data informing that the variation of calendar especially Eid al-Fitr, where it occurs in the first week of July in 2016, is very influential on the currency inflow and outflow.
Acknowledgement
The third author is supported by LPDP scholarship from Indonesian government. The first two authors are supported by Indonesian Ministry of Research, Technology, and Higher Education, through DRPM research grant under “Penelitian Berbasis Kompetensi” scheme with contract number 532/PKS/ITS/2017 and number 851/PKS/ITS/2018. We are grateful to the reviewers for their comments to improve this paper.
References
[1] Zhang, G. P. 2003. Time Series Forecasting using a Hybrid ARIMA and Neural Network Model. Neurocomputing. 50: 159-175.
[2] Liu, L. M. 1986. Identification of Time Series Models in the Presence of Calendar Variation. International Journal of Forecasting. 2(3): 357-372.
[3] Lee, M. H., Suhartono and N. A. Hamzah. 2010. Calendar Variation Model Based on ARIMAX for Forecasting Sales Data with Ramadhan Effect. Regional Conference on Statistical Sciences (RCSS’10). Malaysia Institute of Statistics, Universiti Teknologi MARA. 349-361.
[4] Gardner, E. S. 1998. A Simple Method of Computing Prediction Intervals for Time Series Forecasts. Management Science. 34(4): 541-546.
[5] Chatfield, C. 2000. Time-Series Forecasting. London: CRC Press.
[6] Taylor, J. W. and D. W. Bunn. 1999. Investigating Improvements in the Accuracy of Prediction Interval for Combinations of Forecast: A Simulation Study. International Journal of Forecasting. 15: 325-339.
[7] Konker, R. and G. Bassett. 1982. Robust Test for Heteroscedasticity Based on Regression Quantile. Econometrica. 50(1): 43-61.
[8] Koenker, R. and K. F. Hallock. 2001. Quantile Regression: An Introduction. Journal of Economic Perspective. 15(4): 143-156.
[9] Taylor, J. W. 2000. A Quantile Regression Neural Network Approach to Estimating the Conditional Density of Multiperiod Returns. Journal of Forecasting. 19: 299-311. [10] Arunraj, N. S. and D. Ahrens. 2015. A Hybrid Seasonal
Autoregressive Integrated Moving Average and Quantile Regression for Daily Food Sales Forecasting. International Journal Production Economics. 170: 321-335.
[11] Bowerman, B. L. and R. T. O’Connell. 1993. Forecasting and Time Series: An Applied Approach. Third Edition. Belmont, CA: Duxbury Press.
[12] Cryer, J. D. and K. S. Chan. 2008. Time Series Analysis: With Applications in R. Second Edition. New York: Springer. [13] Suhartono, M. H. Lee, and D. D. Prastyo. 2015. Two Levels
ARIMAX and Regression Models for Forecasting Time Series Data with Calendar Variation Effects. Innovation and Analytics Conference and Exhibition (IACE 2015). Kedah,
Malaysia. 29 September - 1 October 2015. AIP Conference Proceedings, 1691(050026).
[14] Prastyo, D. D., D. Handayani, S. F. Fam, S. P. Rahayu, Suhartono, and N. L. P. S. P. Paramita. 2018. Risk Evaluation on Leading Companies in Property and Real Estate Subsector at IDX: A Value-at-Risk with ARMAX-GARCHX approach and duration test. The 2nd International Conference on Science (ICOS). Makassar, Indonesia. 2-3 November 2017. Journal of Physics: Conf. Series. 979 (012094). [15] Apriliadara, M., Suhartono and D. D. Prastyo. 2016. VARI-X Model for Currency Inflow and Outflow with Eid Fitr Effect in Indonesia. The 2016 Conference On Fundamental And Applied Science For Advanced Technology (CONFAST 2016). Yogyakarta, Indonesia. 25-26 January 2016. AIP Conference Proceedings, 1746(020041).
[16] Cannon, A. J. 2011. Quantile Regression Neural Network: Implementation in R and Application to Precipitation Downscaling. Computer and Geosciences. 37: 1277-1284.
[17] Hyndman, R. J. and A. B. Koehler. 2006. Another Look at Measures of Forecast Accuracy. International Journal of Forecasting. 22(4): 679-688.
[18] Suhartono, S. P. Rahayu, D. D. Prastyo, D. G. P. Wijayanti, and Juliyanto. 2017. Hybrid Model for Forecasting Time Series with Trend, Seasonal and Salendar Variation Patterns. 1st International Conference on Applied & Industrial Mathematics and Statistics 2017 (ICoAIMS 2017). Kuantan, Pahang, Malaysia. 8-10 Augustus 2017. Journal of Physics: Conf. Series. 890 (012160).
[19] Suhartono, P. D. Saputri, F. F. Amalia, D. D. Prastyo, B. S. S. Ulama. 2017. Model Selection in Feedforward Neural Network for Forecasting Inflow and Outflow in Indonesia. Communications in Computer and Information Science. 788: 95-105.