UC Berkeley
UC Berkeley Electronic Theses and Dissertations
TitleComparative genomics and chromosome evolution Permalink
https://escholarship.org/uc/item/1sp703wf Author
Mudd, Austin Beck Publication Date 2019
Comparative genomics and chromosome evolution
By
Austin Beck Mudd
A dissertation submitted in partial satisfaction of the requirements for the degree of
Doctor of Philosophy in
Molecular and Cell Biology in the
Graduate Division of the
University of California, Berkeley
Committee in charge: Professor Daniel Rokhsar, Chair
Professor Michael Eisen Professor Richard Harland
Professor Rasmus Nielsen
Comparative genomics and chromosome evolution by
Austin Beck Mudd
Doctor of Philosophy in Molecular and Cell Biology University of California, Berkeley
Professor Daniel Rokhsar, Chair
Viewed through the lens of comparative genomics, how have chromosomes and karyotypes evolved, particularly under extreme scenarios of rapid or torpid evolution? To examine this question, I produced and analyzed new high-quality, chromosome-scale genome assemblies, representing cases of extreme chromosome evolution. The interplay between convergent and divergent genomic architectures can further our understanding into the maintenance of chromosome structure and organization as well as the underlying biological mechanisms.
Despite their recent divergence, muntjac deer show striking karyotype differences. In Chapter 2, I produced new chromosome-scale genome assemblies for the Chinese and Indian muntjacs,
Muntiacus reevesi (2n=46) and Muntiacus muntjak (2n=6/7), and analyzed their evolution and architecture. I identified six fusion events shared by both species relative to the cervid ancestor and, therefore, present in the muntjac common ancestor, six fusion events unique to the M. reevesi lineage, and 26 fusion events unique to the M. muntjak lineage. One of these M. muntjak
fusions reversed an earlier fission in the cervid lineage. Although comparative Hi-C analysis uncovered differences in long-range genome contacts and A/B compartment structures, I discovered widespread conservation of local chromatin contacts between the muntjacs, even near the fusion sites. Analysis of the muntjac genomes revealed new insights into this unique case of rapid karyotype evolution and the resulting biological variation.
In contrast to muntjacs, frogs are a more phylogenetically ancient order, with two prominent species, Xenopus laevis and Xenopus tropicalis, being utilized as vertebrate cell and developmental model systems. In Chapter 3, I reported new chromosome-scale genome assemblies for three distantly related frogs: the common coquí (Eleutherodactylus coqui), the túngara frog (Engystomops pustulosus), and the Zaire dwarf clawed frog (Hymenochirus boettgeri). Through comparative sequence analysis of these and other frog genomes, I identified long-range and even chromosome-scale synteny, denoting the stability and pervasiveness of this type of genomic conservation across the frog phylogeny. These chromosome-scale comparisons also revealed the 13 ancestral chromosomes, with limited Robertsonian translocations and end-to-end fusions explaining the observed chromosome variations. These assemblies, encompassing over a billion years of evolutionary divergence, unmasked insights into torpid karyotype evolution in frogs.
To my mother and sister In loving memory of my father
Table of contents
Abstract ... 1
Dedication ... i
Table of contents ... ii
1 Introduction ... 1
2 Rapid chromosome evolution in muntjacs ... 4
2.1 Background ... 4
2.2 Results and discussion ... 5
2.3 Figures and tables ... 9
2.4 Methods ... 23
2.5 Notes ... 25
3 Torpid chromosome evolution in frogs ... 26
3.1 Background ... 26
3.2 Results and discussion ... 27
3.3 Figures and tables ... 30
3.4 Methods ... 42
3.5 Notes ... 49
4 Conclusion ... 50
1
Introduction
History. The field of genomics emerged with the pivotal papers from James Watson and Francis Crick in 1953 about the structure and function of DNA [1,2] along with the first sequencing publications — the amino acid sequence of insulin in the 1950s [3], the nucleic acid sequence of yeast alanine transfer RNA in 1965 [4], and the genome of bacteriophage φX174 in 1977 [5]. However, the field’s foundations stretch back to seminal discoveries in the 19th century including
the laws of Mendelian inheritance [6] and Darwin’s theory of evolution by natural selection [7], which were released 154 and 160 years ago, respectively. Similarly, chromosomes, or “chromatic nuclear figures”, were first described in 1873, with the term chromosome coined in 1888 [8]. The fields of comparative genomics and chromosome evolution originated in the early and mid-1900s, with the findings by Alfred Sturtevant, Theodosius Dobzhansky, H. J. Muller, and other Drosophila geneticists about conserved genic content between chromosomes of different Drosophila spp. and the standardization of chromosome arm nomenclature (see Figure 1 from [9] and Figure 3 from [10]) [11,12].
In the following decades, technological developments improved the ability to explore chromosome evolution, from advancements in chromosome preparation in the 1950s to the development of chromosome banding in the 1960s to the introduction of fluorescent in situ
hybridization in the 1970s. As a result, researchers were able to evaluate chromosome abnormalities in leukemia and Down’s syndrome, accurately identify the 46 human chromosomes, and explore genomic changes across evolutionary history [12–14]. The newest iteration of technological development is the proliferation of genome sequencing and the ability to undertake chromosome-scale scaffolding of genome assemblies using technologies ranging from optical mapping [15] to chromosome conformation capture [16], an advancement that, in fact, has enabled this dissertation work. These improvements have greatly increased our understanding of chromosome biology, from broadscale chromosome territories to A/B compartments to sub-megabase topologically associating domains (see Figure 1 from [17]) [17,18], with hypotheses like the correlation between chromatin organization and banding patterns tying together the history of the field [19].
Comparative genomics. With the aforementioned rapid development of novel sequencing technologies [20], there has also been an expansion in the use of comparative genomics to better understand genome content, evolution, and variation. In particular, advances in sequencing and informatics have enabled the prediction and identification of various genomic features — coding elements like protein-coding genes; non-coding elements including non-coding RNAs, repeats, and regulatory elements; and structural variations such as copy number variations and translocations — through comparison with related or otherwise well-annotated reference genome
thus ancestral biology, regulatory elements, and various other facets [40].
Chromosome evolution. Even with these technological innovations and new sources of data, however, the core question at the intersection of comparative genomics and chromosome evolution has remained the same: based on analysis of different species, populations, and individuals, what chromosome changes have occurred across evolutionary history? To this end, the observed variations fall into three categories: microstructural rearrangements with insertions, deletions, and duplications of segments or whole chromosomes; macrostructural rearrangements within and between chromosomes resulting in changes to chromosome morphology or number; and polyploidization events involving the entire genome [13,41]. As a few examples of these types of variations, studies have documented a variety of duplication, insertion, and deletion events leading to genetic disorders in humans and explored the potential detrimental effects caused by these types of chromosome abnormalities [42]. Case analyses in humans have also identified a variety of chromosome structural variations including Robertsonian translocations, reciprocal translocations, and chromosome inversions, enumerating any resulting phenotypic effects [43]. On a larger evolutionary scale (see Figure 5 from [44]), studies have described the end-to-end fusion of chromosome 2 in the human ancestor [45]; a whole genome duplication in the teleost ancestor [46]; whole genome duplication, fission, and fusion events in the vertebrate lineage [47,48]; and deep units of synteny across animals [49,50].
Rearrangements of chromosomes, however, must be evaluated in light of mitotic, meiotic, and related chromosome constraints [51] as well as the health and fecundity of individuals and populations. Chromosome rearrangement events can be deleterious or unable to be propagated, can result in a balanced polymorphism that is maintained in a population, or under select situations, can become fixed and potentially enable speciation [52]. Advantageous rearrangements are likely to become fixed in a population, although small population size, meiotic drive, epistatic interactions, and other factors can enable fixation of neutral or underdominant rearrangements [41,53]. Regarding constraints, chromosomes resulting from rearrangements must, in most eukaryotes, each retain a centromere and telomeres, fit within the nucleus and cell, and allow for proper mitotic recombination and segregation as well as other required cellular functions [52]. These mechanisms and constraints limit the means of viable chromosome evolution, with particular types of rearrangements therefore more probable than others [54].
Evolutionary rate. Over the past 160 years since Darwin’s theory of evolution by natural selection [7], there has been continued disagreement about the rate of evolutionary change, with some arguing that evolution is fast, others slow, and still others both fast and slow [55]. An analysis of 10,000 generations of Escherichia coli found rapid evolution during the initial 2,000 generations, slower evolution during the following 3,000 generations, and limited evolution during the remaining 5,000 generations [56], demonstrating that evolutionary rate can be dynamic. Given that any finite partially ordered set has a maximal element and a minimal element [57], evolutionary rates must similarly have a maximum and a minimum, with two models describing this phenomenon. The first model, proposed by George Simpson, suggests different rates for particular taxonomic groups and classifies the organisms into one of three categories depending on rate: (1) bradytely for slow evolution, (2) horotely for normal evolution,
proposes a singular set of rates that allows for variation, similar to a Gaussian distribution [59]. In either scenario, extreme rates of evolution exist, whether classified as bradytely and tachytely or present at the tails of the evolutionary rate distribution. When applied to karyotype evolution, terms such as karyotypic conservatism and karyotypic megaevolution [60] or chromosomal bradytely and chromosomal tachytely [61] have been coined.
Outline. Throughout this dissertation, I analyzed the evolution and architecture of inter-chromosome rearrangements between new and improved inter-chromosome-scale genome assemblies under extreme scenarios of rapid or torpid evolution, with the results of each examination formatted as a manuscript. The second chapter is an analysis of rapid karyotype evolution in the Indian and Chinese muntjacs, Muntiacus muntjak and Muntiacus reevesi, characterizing shared and lineage-specific fusion events as well as documenting underlying changes in the chromatin architecture. The third chapter is an analysis of torpid karyotype evolution between seven frog assemblies, characterizing the ancestral chromosome state, the mechanisms of karyotype change, and the vast synteny across the frog phylogeny. These chapters are bounded by an introduction and a conclusion, providing the necessary context for the work as well as future directions.
2
Rapid chromosome evolution in muntjacs
This chapter is an update of the bioRxiv preprint [62], of which I am the first author. This work is included with permission from the authors below.
Authors' contributions. Austin B. Mudd assembled and annotated the genomes, completed the bioinformatic analyses, and wrote the manuscript. Jessen V. Bredeson assisted with the bioinformatic analyses and script development. Rachel Baum prepared the Hi-C libraries. Dirk Hockemeyer coordinated the cell line acquisitions, extracted the DNA, and prepared the Hi-C libraries. Dirk Hockemeyer and Daniel S. Rokhsar provided scientific leadership of the project and wrote the manuscript.
2.1
Background
Rapid karyotype evolution, also known as karyotypic megaevolution [60] or chromosomal tachytely [61], has been found in various species, such as rodents [63], bears [64], and gibbons [65], and as a byproduct of chromosome instability in cancer [66]. Perhaps the most spectacular example of rapid karyotype evolution is found in muntjacs, a genus of small deer with karyotypes ranging from 2n=46 for Muntiacus reevesi to 2n=6/7 for female/male Muntiacus muntjak, respectively, with M. muntjak having the smallest chromosome number of any mammal [67]. Cytogenetic analysis showed that muntjac karyotype diversity arose primarily through centromere-telomere (head-tail) tandem fusions and, to a lesser extent, centromere-centromere (head-head) tandem fusions [68,69], i.e., Robertsonian translocations [70]. Importantly, independent fusions occurred in each lineage after divergence from their common ancestor, such that the 2n=46 M. reevesi karyotype does not represent an intermediate stage between the ancestral 2n=70 cervid karyotype and the highly reduced M. muntjak karyotype [71,72].
Understanding the variation of genomic architectures in muntjacs has the potential to reveal new insights into chromosome evolution [48]. We therefore set out to explore karyotype changes in muntjacs by determining the number, distribution, and timing of shared and lineage-specific fusion events. To this end, we described the first chromosome-scale assemblies of M. muntjak
and M. reevesi, with contiguity metrics that surpass those of earlier draft assemblies [73,74]. To infer the series of karyotype changes in muntjac, we leveraged existing assemblies of Bos taurus
(cow) [75], Cervus elaphus (red deer) [76], and Rangifer tarandus (reindeer) [77]. In total, we characterized 38 muntjac fusion events, six of which are shared by M. muntjak and M. reevesi. The rate of 26 unique fusion events in the M. muntjak lineage over 4.9 million years represents more than an order of magnitude increase relative to the mammalian average [78]. Although the molecular mechanism driving these karyotype changes is unknown, we found that one fusion event in the M. muntjak lineage reversed a chromosome fission that occurred earlier in the cervid lineage. In another case, we found that a pair of ancestral cervid chromosomes likely fused independently in the M. muntjac and M. reevesi lineages. As such, some chromosomes may be more prone to karyotype changes than others, and care should be taken when applying the parsimony principle due to the possibility of convergent change.
three-dimensional genome architecture that accompany chromosome fusions. While karyotype changes disrupted long-range three-dimensional genome structure, including A/B compartments, we found few changes at the local level. These analyses explored features of chromosome structure derived from the unique evolutionary history of these two karyotypically divergent species.
2.2
Results and discussion
Assembly and annotation. To investigate the tempo and mode of muntjac chromosome evolution, we generated high-quality, chromosome-scale genome assemblies for M. muntjak and
M. reevesi (Table 2.1) using a combination of linked reads (10X Genomics Chromium Genome) and chromatin conformation capture (Dovetail Genomics Hi-C; Table 2.2, Methods). The resulting assemblies each contained 2.5 gigabases (Gb) of contig sequence with contig N50 lengths over 200 kilobases (kb). In both assemblies, over 92% of contig sequence was anchored to chromosomes. Compared with the publicly available assemblies [73,74], the assemblies described here represented a hundredfold improvement in scaffold N50 length and severalfold improvement in contig N50 length. As typical for short-read assemblies, our muntjac assemblies were largely complete with respect to genic sequences (see below) but were likely to underrepresent repetitive sequences such as pericentromeric heterochromatin and repetitive subtelomeric regions.
The assembled chromosome numbers recapitulated the karyotypes reported in the literature (2n=6 for female M. muntjak [79] and 2n=46 for M. reevesi [80]). M. reevesi chromosomes were validated against previously published chromosome painting data [81]. For M. muntjak, we aligned 377 previously sequenced bacterial artificial chromosomes (BACs) [82–84] and, based on corresponding fluorescent in situ hybridization (FISH) location data, found that 360 (95%) of BACs aligned to the expected chromosomes. Of the 17 BACs that aligned to a different chromosome than expected by FISH, 16 were well aligned to our assembly in regions of conserved collinearity among cow, red deer, and muntjac chromosomes, which suggested that the FISH-based chromosome assignments of these BACs were likely incorrect. Only one of these 17 BACs aligned to two of our assembled M. muntjak chromosomes, indicating a possible local misassembly or BAC construction error.
For each muntjac genome, we annotated ~26,000 protein-coding genes based on homology with
B. taurus [75], Ovis aries (sheep) [85], and Homo sapiens (human) [86]. Over 98% of the resulting genes were functionally annotated by InterProScan (v5.34-73.0) [87]. We identified 19,649 one-to-one gene orthologs between the two muntjac species as well as 7,953 one-to-one gene orthologs present in the two muntjacs, B. taurus [75], C. elaphus [76], and R. tarandus [77].
muntjac assemblies to each other and to B. taurus [75] as well as B. taurus to C. elaphus [76] and
R. tarandus [77]. The pairwise alignment of the muntjac genomes contained 2.45 Gb of contig sequence, or over 97% of the assembled contig sequence lengths, with an average identity of 98.5% excluding indels. This reflected the degree of sequence conservation between the two species and their recent divergence. In comparison, alignments of red deer, reindeer, and muntjacs to B. taurus contained 1.80 to 2.21 Gb of contig sequences with 92.7% to 93.2% average identity. Sequence alignments were merged into runs of collinearity, and analysis of these runs revealed the timing of fission and fusion events in each lineage (Figures 2.1A–B and 2.3).
Chromosome evolution. We assessed chromosome evolution in muntjacs using B. taurus (BTA) and C. elaphus (CEL) as outgroups. For convenience, we referred to chromosome regions primarily by their BTA chromosome identifiers. We corroborated prior reports in literature [81] that:
1. In the last common ancestor of cow and deer, segments corresponding to the two cow chromosomes BTA26 and BTA28 were present as a single chromosome in the last common ancestor of cervids and B. taurus. This ancestral state, corresponding to BTA26_28, was retained in C. elaphus and the muntjacs.
2. Twelve chromosomes of the cervid ancestor arose by fission of chromosomes represented by six cow chromosomes (BTA1 => CEL19 and CEL31; BTA2 => CEL8 and CEL33; BTA5 => CEL3 and CEL22; BTA6 => CEL6 and CEL17; BTA8 => CEL16 and CEL29; and BTA9 => CEL26 and CEL28).
3. Although chromosomes homologous to BTA17 and BTA19 were fused in the C. elaphus
lineage as CEL5, this fusion was unique to the C. elaphus lineage, and these cow chromosomes corresponded to distinct ancestral cervid chromosomes.
In the muntjacs, we found six fusions shared by M. muntjak and M. reevesi (BTA7/BTA3, BTA5prox/BTA22, BTA2dist/BTA11, BTA18/BTA25/BTA26_28 (the fusion of three ancestral chromosomes were counted as two fusion events), and BTA27/BTA8dist; Figure 2.4). All six of these fusions shared by M. muntjak and M. reevesi were also corroborated in previous BAC-FISH analyses of Muntiacus crinifrons, Muntiacus feae, and Muntiacus gongshanensis [88,89]. After the divergence of M. muntjak and M. reevesi, each lineage experienced additional fusions. In the M. reevesi lineage, there were six fusions (BTA7_3/BTA5dist, BTA18_25_26_28/BTA13, BTA2prox/BTA9dist/BTA2dist_11, BTA5prox_22/BTA24, and BTA29/BTA16). In the M. muntjak lineage, the three chromosomes arose via 26 lineage-specific fusions:
• M. muntjak chromosome 1: BTA7_3/BTA5prox_22/BTA17/BTA2prox/BTA1dist/ BTA29/BTA8prox/BTA9dist/BTA19/ BTA24/BTA23/BTA14/BTA2dist_11,
• M. muntjak chromosome 2: BTA15/BTA13/BTA18_25_26_28/BTA9prox/BTA20/ BTA21/BTA27_8dist/BTA5dist, and
• M. muntjak chromosome 3: BTAX/BTA1prox/BTA4/BTA16/BTA12/BTA6prox/ BTA6dist/BTA10.
While both M. muntjak and M. reevesi karyotypes included chromosomes that arose by fusion of BTA13 and BTA18_25_26_28, these events likely occurred independently. Consistent with our analysis, published BAC FISH mapping of M. reevesi against M. crinifrons, M. feae, and M.
muntjac species [88,89], which supported our finding that these were independent, lineage-specific fusion events.
In total, we found 38 fusion events and no fissions in the muntjac lineage (Figure 2.1A). All 12 of the M. reevesi fusions identified by our comparative analysis were substantiated by BAC-FISH [81], and 17 of the M. muntjak fusions were corroborated [90]. Our results were also consistent with the BAC-FISH findings of Chi et al. [69]. The rates of karyotype changes based on fission and fusion events in muntjacs were higher than the mammalian average of 0.4 changes per million years [78]. The M. muntjak lineage, with six fission events and 32 fusion events over the past 22.8 million years since the cervid ancestor, averaged 1.7 events per million years. In the 4.9 million years since the divergence from M. reevesi, this rate increased to 5.3 fusion events per million years, an order of magnitude greater than the mammalian average. The M. reevesi
lineage, on the other hand, averaged 0.8 events per million years over the past 22.8 million years, with an accelerated rate of 1.2 events per million years over the past 4.9 million years. Although the calculated nucleotide divergence and time between the two muntjac species (Figure 2.1A and 2.1C, Table 2.3) mirrored the evolutionary distance between humans and chimpanzees [91,92], this number of fusion events since the muntjac last common ancestor far exceeded the rate in the chimpanzee and human lineages since their respective last common ancestor, i.e., a single fusion on the human lineage [45].
Reversal of a cervid-specific fission in M. muntjak. While analyzing the fission and fusion events, we discovered a fusion in M. muntjak that reversed, to the resolution of our assembly, the cervid-specific fission of the ancestral chromosome corresponding to BTA6 (Figure 2.5). To estimate the probability of such a reversion occurring by chance given the high rate of fusion in
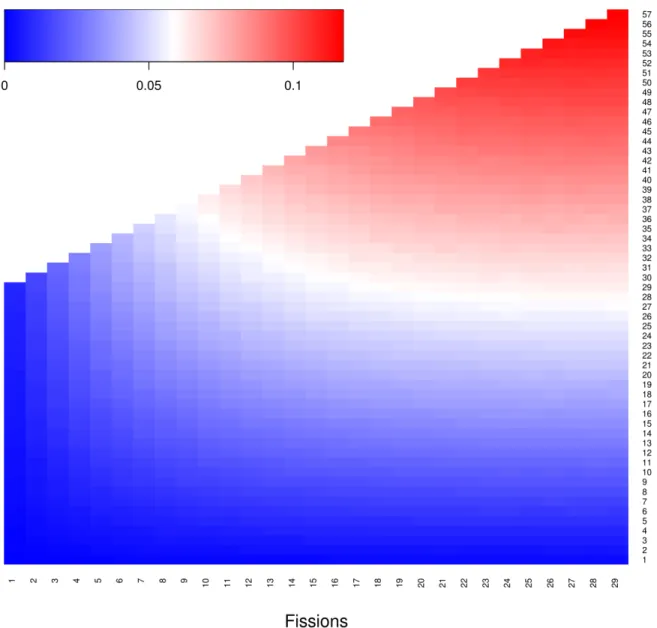
M. muntjak, we simulated a simplified model for karyotype change with four rules: (1) only one fission was allowed per chromosome; (2) all fissions occurred first, followed by all fusions; (3) for each fission, a chromosome was chosen at random; and (4) for each fusion, chromosomes and orientations were chosen at random. From a starting karyotype of n=29, representing the last common ancestor of cervids and B. taurus [81], we simulated the model of fissions and fusions to 1 million iterations per fission-fusion combination (Figure 2.6). The M. muntjak lineage, with six fissions and 32 fusions, had a 4.1% probability of at least one fusion reversing a prior fission. In comparison, the C. elaphus lineage, with six fissions and one fusion, had only a 0.13% probability of reversal by chance, and the M. reevesi lineage, with six fissions and 12 fusions, had a 1.5% chance of reversal. Even with the large number of fusions in muntjacs, the probability of a chance reversal of a previous fission was small. However, the reversal could have been aided by unmodeled effects of differential chromosome fusion probability arising, for example, by chromosome proximity in the nucleus. This analysis pointed to the importance of having multiple outgroups, here both B. taurus and C. elaphus, in phylogenetic analyses of karyotypes.
sites (Tables 2.4–2.7), we noted the maintenance of distinct Hi-C boundaries in several examples, such as the junction between M. muntjak chromosome segments X and 3 at 133 Mb on chromosome 3_X. Other fusion sites, however, showed no notable difference compared with the rest of the genome in M. muntjak. As expected, M. reevesi showed a clear distinction between intra- and inter-chromosome contacts, including across fusion sites in M. muntjak (Figure 2.7). To quantify the chromatin changes at these fusion sites, we divided the genomes into one Mb bins and compared normalized inter-bin Hi-C contacts between bins five Mb apart in the two species, using the M. muntjak assembly as the backbone for comparison (Figure 2.8). Supporting the initial visual analysis, we found that most bins containing a fusion site had fewer long-range chromatin contacts in M. reevesi, averaging 0.16 ± 0.09 normalized contacts per bin, compared with M. muntjak, averaging 0.62 ± 0.35 normalized contacts per bin, although we identified bins with few contacts in both species (Figure 2.8).
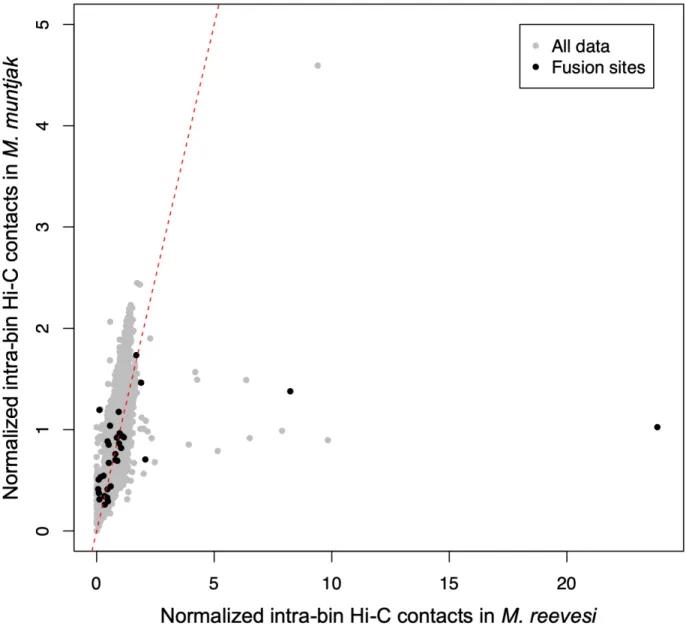
In order to test whether differences were present at a more local level, we next compared normalized one Mb intra-bin Hi-C contacts between the two species, again using the M. muntjak
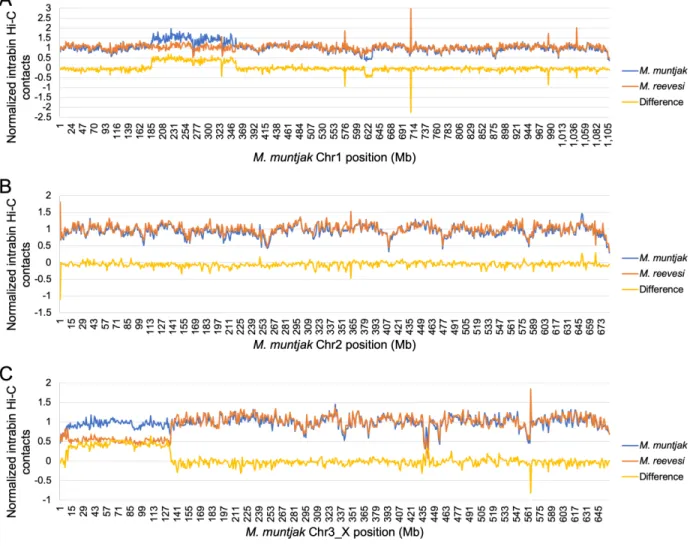
assembly as the backbone for comparison. We found that most of the chromatin contacts were consistent between the two muntjacs, including all but three of the bins containing fusion sites (Figures 2.9A and 2.10). Several regions, however, showed distinctive variation in chromatin contacts between the two species: the X chromosome and two regions on M. muntjak
chromosome 1 (186–355 and 615–630 Mb). Since our sequenced M. reevesi sample was male [71] while the sequenced M. muntjak sample was female [93], we expected a difference in chromatin contacts on the X chromosome, a finding that was further supported by analysis of copy number across the genome using the 10X Genomics linked reads (Figure 2.9B). From this copy number analysis, we also hypothesized that the two regions on M. muntjak chromosome 1 (186–355 and 615–630 Mb) were a haplotype-specific duplication and a haplotype-specific deletion, respectively, explaining the difference in chromatin signal between the two muntjacs (Figure 2.9C–D). Although the inter-bin analysis identified long-range chromatin changes between sites five Mb apart, our quantitative comparison of one Mb intra-bin chromatin contacts found substantial chromatin conservation between the genome assemblies, including nearly all of the fusion sites. This conclusion was further supported by intra-bin analysis with 100 kb bins (Figure 2.11).
On a multi-megabase length scale, mammalian chromosomes can be subdivided into alternating A/B compartments based on intra-chromosome contacts. These compartments correspond to open and closed chromatin, respectively, and differ in gene density and GC content [94]. To test whether these compartments were conserved or disrupted by fusions, we computed the A/B chromatin compartment structures for M. muntjak and M. reevesi from the Hi-C data, again using the M. muntjak assembly as the backbone for comparison. We found that, in general, compartment boundaries were not well conserved between the muntjacs (Figure 2.12). Specifically, for A/B compartments larger than three Mb, only 17 compartments were completely conserved between the two species, out of 221 A/B compartments analyzed in M. muntjak and 161 in M. reevesi. We found that many of the compartments in M. reevesi were subdivided into multiple compartments in M. muntjak. Combining our analysis of A/B compartments and chromatin contacts, we found that the extensive set of fusions in the M. muntjac lineage altered the three-dimensional genome structure at the multi-megabase scale
have only limited effects on the underlying gene expression, since the two muntjac species can produce sterile hybrid offspring [95]. Similar uncoupling between genome topology and gene expression has been observed in Drosophila melanogaster [96].
Conclusions. We presented here new chromosome-scale assemblies of two muntjac deer that differ dramatically in karyotype, despite only limited sequence change, after ~4.9 million years of divergence. Analysis of these new assemblies revealed multiple changes in the underlying chromosome structure, including variation in the A/B compartments, despite maintenance of sub-megabase, three-dimensional genome contacts. One of the chromosome fusions reversed an earlier chromosome fission to the resolution of our assemblies, with the two events being separated by more than eight million years. Future studies will use these assemblies to resolve the nature of the fusion sites and to better understand the biological mechanisms related to chromosome fissions and fusions in muntjac.
2.3
Figures and tables
Figure 2.1. [A] The phylogenetic tree of the five analyzed species, calculated from fourfold degenerate sites and divergence time confidence intervals, was visualized with FigTree (commit 901211e; https://github.com/rambaut/figtree). The ancestral karyotype at each node and the six branches with fission and fusion events relative to the ancestral karyotype were labeled on the tree. The lack of fissions or fusions on the R. tarandus-specific branch as well as the timings of the cervid-specific and B. taurus-specific fissions were derived from literature [81]. [B] The alignment plot was generated with jcvi.graphics.karyotype (v0.8.12;
Figure 2.2. [A] Venn diagram of gene homology between the two muntjac annotations, B. taurus
(Ensembl release 94 September 2011 genebuild of GCA_000003055.3) [75,99], C. elaphus
(publication genebuild of GCA_002197005.1) [76], and R. tarandus [77,100] annotations analyzed with OrthoVenn [101] and [B] the occurrence table of gene homology clusters between these species reanalyzed with OrthoVenn2 [102] for visualization purposes. In the occurrence table, the green and grey ovals represent the presence or absence, respectively, of that species in the OrthoVenn2 clustering. The number of clusters and proteins were provided for all species combinations.
Figure 2.3. Circos (v0.69-6) [103] plots with runs of collinearity containing at least 25 kb of aligned sequence between [A] B. taurus (left, Bt) and C. elaphus (right, Ce), [B] B. taurus (left, Bt) and M. muntjak (right, Mm), [C] B. taurus (left, Bt) and M. reevesi (right, Mr), and [D] M. reevesi (left, Mr) and M. muntjak (right, Mm).
Figure 2.4. Circos (v0.69-6) [103] plots using runs of collinearity containing at least 25 kb of aligned sequence between [A] B. taurus (left, Bt) and M. muntjak (right, Mm) and [B] B. taurus
(left, Bt) and M. reevesi (right, Mr) specifying the six shared muntjac fusions: BTA7/BTA3 (purple), BTA5prox/BTA22 (red), BTA2dist/BTA11 (green), BTA18/BTA25/BTA26_28 (blue), and BTA27/BTA8dist (orange).
Figure 2.5. Circos (v0.69-6) [103] plots using runs of collinearity containing at least 25 kb of aligned sequence between [A] B. taurus (left, Bt) and C. elaphus (right, Ce) with the fission of BTA6 in purple; [B] B. taurus (left, Bt) and M. muntjak (right, Mm) with the fission-fusion reversal of BTA6 in orange; and [C] B. taurus (left, Bt) and M. reevesi (right, Mr) with the fission of BTA6 in green.
Figure 2.6. Heatmap of probabilities where at least one fusion reversed a prior fission modeled to 1 million iterations for each possible scenario from a starting karyotype of n=29, using custom script run_fission_fusion.sh (v1.0).
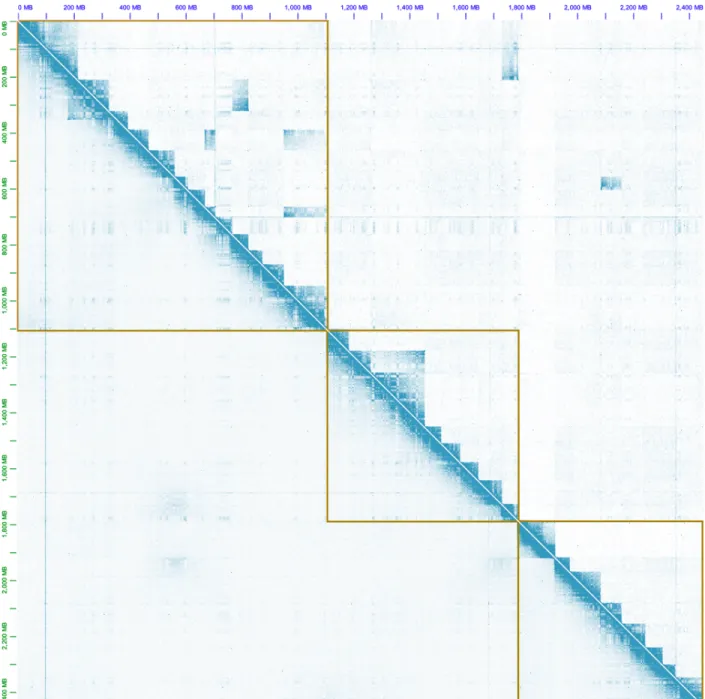
Figure 2.7. Visualization of the M. muntjak chromosomes’ Hi-C contact map (bottom left) and the M. reevesi chromosomes’ Hi-C contact map (top right) using the M. muntjak assembly as the reference in Juicebox (v1.11.08) [104]. The golden lines demarcate the boundaries of the three M. muntjak chromosomes.
Figure 2.8. Normalized one Mb inter-bin Hi-C contacts between bins five Mb apart for M. muntjak (y axis) vs. M. reevesi (x axis) with the inter-bin contacts that span across but do not include the M. muntjak lineage-specific fusion sites (Table S6) colored black. The expected result of conserved Hi-C contacts was represented with a dashed red line.
reevesi (x axis) with the bins containing the M. muntjak lineage-specific fusion sites (Table S6), chromosome ends, the X chromosome, the potential M. muntjak haplotype-specific duplication, and the potential M. muntjak haplotype-specific deletion colored. The expected result of conserved Hi-C contacts was represented with a dashed red line. For fusion site ranges spanning two bins, the bin containing the majority of the fusion site range was deemed to be the fusion site bin. [B–D] Copy number was calculated from normalized coverage of adapter-trimmed 10X Genomics linked reads for three regions with variation in the chromatin contacts: [B] the X. chromosome, [C] the potential M. muntjak haplotype-specific duplication, and [D] the potential
M. muntjak haplotype-specific deletion, with the copy number of M. muntjak in blue and M. reevesi in orange.
Figure 2.10. Using a bin size of one Mb and the M. muntjak assembly as the reference, normalized intra-bin Hi-C contacts for M. muntjak (blue) and M. reevesi (orange) at each position on [A] chromosome 1, [B] chromosome 2, and [C] chromosome 3_X. The difference of
Figure 2.11. Normalized 100 kb intra-bin Hi-C contacts for M. muntjak (y axis) vs. M. reevesi (x axis) with the bins containing the M. muntjak lineage-specific fusion sites (Table S6) colored black. The expected result of conserved Hi-C contacts was represented with a dashed red line. For fusion site ranges spanning two bins, the bin containing the majority of the fusion site range was deemed to be the fusion site bin. For fusion site ranges spanning three or more bins, the middle 100 kb bin(s) was deemed to be the fusion site bin(s).
Figure 2.12. Using the M. muntjak assembly as the reference, identification of A/B compartment boundaries for M. muntjak (blue) and M. reevesi (orange) based on principle component analysis (PCA) eigenvalues from call-compartments.R (https://bitbucket.org/bredeson/artisanal).
Table 2.1. Summary of genome assemblies. Statistics were calculated using assemblathon_stats.pl (commit d1f044b) [105] and GenomeTools (v1.5.9) [106].
Genomic feature M. muntjak M. reevesi
Total scaffold length, bp 2,573,529,099 2,579,575,442
Number of scaffolds 25,651 29,705
Scaffold N50 length, bp 682,452,208 94,101,870 Total contig length, bp 2,518,738,577 2,514,747,046
Number of contigs 49,270 53,090
Contig N50 length, bp 215,534 225,142
Contigs sequence in chromosomes, % 95.06 92.93
Contig GC content, % 41.59 41.59
Masked contig repeat sequence, % 40.33 40.06
Number of genes 25,753 26,054
Genes with functional annotation, % 98.11 98.15 Average number of exons per gene 7.83 7.77
Median exon size, bp 124 124
Median intron size, bp 921 911
Table 2.2. DNA sequencing generated for the genome assemblies, excluding index reads.
Species Library type Total number of reads Total bases sequenced
M. muntjak (NCBI BioProject
PRJNA542135)
10X Genomics
Chromium Genome 768,921,264 115,338,189,600 Dovetail Genomics Hi-C 521,749,568 78,784,184,768
M. reevesi (NCBI BioProject PRJNA542137) 10X Genomics Chromium Genome 696,864,964 104,529,744,600 Dovetail Genomics Hi-C 530,002,086 80,030,314,986
Table 2.3. Pairwise nucleotide divergence in substitutions per site based on fourfold degeneracy between the examined species extracted from the RAxML (v8.2.11) [97] phylogenetic tree using Newick utilities (v1.6) [98].
Species B. taurus C. elaphus M. muntjak M. reevesi
C. elaphus 0.0550 – – –
M. muntjak 0.0606 0.0267 – –
M. reevesi 0.0599 0.0259 0.0130 –
R. tarandus 0.0592 0.0298 0.0355 0.0347
Table 2.4. Locations of six cervid-specific fissions relative to the B. taurus genome assembly.
B. taurus
chromosome
Using runs of collinearity from C. elaphus
Using runs of collinearity from M. muntjak
Using runs of collinearity from M. reevesi
BTA1 58,941,477 – 58,978,602 57,645,593 – 57,778,258 57,645,547 – 57,746,127 BTA2 93,282,776 – 93,424,724 79,668,309 – 79,719,766 79,668,935 – 79,719,765 BTA5 70,623,938 – 70,699,763 57,880,818 – 58,822,584 57,880,818 – 60,196,482 BTA6 63,301,740 – 63,370,450 Fusion reversal 68,435,554 – 68,455,313 BTA8 64,071,291 – 64,114,095 67,266,180 – 67,499,444 67,369,805 – 67,497,566 BTA9 63,670,677 – 64,013,115 64,824,832 – 65,087,945 64,824,832 – 65,087,945 Table 2.5. Locations of shared fusion events in the M. muntjak and M. reevesi genome assemblies using runs of collinearity from B. taurus.
B. taurus fused
chromosomes M. muntjak M. reevesi
BTA7/BTA3 Chr1: 103,142,901 – 103,201,151 Chr1: 103,650,999 – 103,852,521 BTA5prox/BTA22 Chr1: 267,859,762 – 267,926,350 Chr4: 52,627,734 – 52,781,577
from one-to-one orthologs between M. muntjak and M. reevesi and then refined using runs of collinearity from B. taurus and M. reevesi against M. muntjak.
M. muntjak chromosome M. muntjak start M. muntjak end
Chromosome 1 215,667,096 215,740,550 Chromosome 1 326,596,489 326,664,606 Chromosome 1 394,376,597 394,423,120 Chromosome 1 468,279,958 468,421,169 Chromosome 1 562,054,424 562,154,407 Chromosome 1 609,147,303 609,442,186 Chromosome 1 669,798,392 669,917,570 Chromosome 1 707,332,274 707,411,696 Chromosome 1 767,481,614 767,858,594 Chromosome 1 825,563,679 825,664,460 Chromosome 1 875,352,976 875,473,556 Chromosome 1 952,277,739 952,439,995 Chromosome 2 76,554,689 76,587,068 Chromosome 2 155,096,035 155,468,627 Chromosome 2 348,208,540 348,522,144 Chromosome 2 407,305,863 407,476,405 Chromosome 2 474,891,789 475,146,554 Chromosome 2 540,052,390 540,055,842 Chromosome 2 624,503,504 624,522,918 Chromosome 3_X 133,000,163 133,001,250 Chromosome 3_X 184,069,851 184,122,591 Chromosome 3_X 295,103,485 295,251,858 Chromosome 3_X 370,301,578 370,307,164 Chromosome 3_X 454,989,747 454,992,643 Chromosome 3_X 516,012,504 516,138,154 Chromosome 3_X 562,995,659 563,046,092
Table 2.7. Locations of six unique fusion events in the M. reevesi genome assembly derived from one-to-one orthologs between M. muntjak and M. reevesi and then refined using runs of collinearity from B. taurus and M. muntjak against M. reevesi.
M. reevesi chromosome M. reevesi start M. reevesi end
Chromosome 1 216,558,007 216,594,231 Chromosome 2 78,441,940 78,562,328 Chromosome 3 154,290,838 154,298,872 Chromosome 3 191,988,183 192,099,419 Chromosome 4 111,704,918 111,709,617 Chromosome 5 47,104,391 47,224,935
2.4
Methods
DNA extraction and sequencing. High molecular weight DNA was extracted, as previously described [107], from fibroblast cell lines obtained from the University of Texas Southwestern Medical Center for M. muntjak (female) [93] and the University of Cambridge for M. reevesi
(male) [71]. A 10X Genomics Chromium Genome library [108] was prepared for each species by the DNA Technologies and Expression Analysis Cores at the University of California Davis Genome Center and sequenced on the Illumina HiSeq X by Novogene Corporation. A Hi-C chromatin conformation capture library was also prepared for each species using the Dovetail Genomics Hi-C library preparation kit and sequenced on the Illumina HiSeq 4000 by the Vincent J. Coates Genomics Sequencing Laboratory at the University of California Berkeley.
Shotgun assembly. 10X Genomics linked reads were assembled with Supernova (v2.0.1) [108]. Putative archaeal, bacterial, viral, and vector contamination was identified and removed by querying the assemblies using BLAST+ (v2.6.0) [109] against the respective RefSeq and UniVec databases and removing sequences with at least 95% identity, E-value less than 1E-10, and hits aligning to more than half the scaffold size or 200 bases, using custom script general_decon.sh (v1.0). Putative mitochondrial sequence was also identified and removed by querying the assemblies using BLAST+ (v2.6.0) [109] against their respective mitochondrial assemblies (NCBI NC_004563.1 [110] and NC_004069.1 [111]) and removing sequences with at least 99% identity and E-value less than 1E-10, using custom script mt_decon.sh (v1.0). The decontamination removed 71 scaffolds totaling 836 kb from the M. muntjak assembly and 36 scaffolds totaling nine kb from the M. reevesi assembly.
Chromosome assembly. Hi-C reads were aligned to each assembly with Juicer (commit d3ee11b) [112]. A preliminary round of Hi-C-based scaffolding was performed with 3D-DNA (commit 745779b) [113], and residual redundancy due to split haplotypes was manually filtered through visualization of the Hi-C contact map in Juicebox (v1.9.0) [104], removing the smaller of any pair of duplicate scaffolds. This process removed 1.04 Gb of sequence from the M. muntjak assembly and 25 Mb of sequence from the M. reevesi assembly. The remaining scaffolds were organized into chromosomes by realigning the Hi-C reads to the deduplicated assembly with Juicer (commit d3ee11b) [112], ordering and orienting scaffolds into chromosomes with 3D-DNA (commit 745779b) [113], and then manually correcting using Juicebox (v1.9.0) [104]. After correction, gaps in the assembly were filled with adapter-trimmed 10X Genomics data using custom script trim_10X.py (v1.0) and Platanus (v1.2.1) [114].
Final assembly release and validation. Scaffolds smaller than one kb in the gap-filled assembly were removed with seqtk seq (v1.3-r106; https://github.com/lh3/seqtk), and chromosomes and scaffolds were numbered in order of size using SeqKit (v0.7.2-dev) [115]. X chromosomes were later renamed based on alignment with B. taurus [75]. Chromosomes in both species were
(v0.7.17-r1188) [116], and primary alignments were checked against the corresponding FISH locations, excluding unaligned BACs or those aligned to unplaced scaffolds.
Annotation and homology analysis. Repetitive elements were identified and classified with RepeatModeler (v1.0.11) [117] and combined for each species with ancestral Cetartiodactyla repeats from RepBase (downloaded November 8, 2018) [118]. The assemblies were then soft masked with RepeatMasker (v4.0.7) [119]. The assemblies were annotated using Gene Model Mapper (v1.5.3) [120] and BLAST+ (v2.6.0) [109] with the following assemblies and annotations from Ensembl release 94 [99] as input evidence: B. taurus (September 2011 genebuild of GCA_000003055.3) [75], H. sapiens (July 2018 genebuild of GCA_000001405.27) [86], and O. aries (May 2015 genebuild of GCA_000298735.1) [85]. Coding nucleotide and peptide sequences were extracted using gff3ToGenePred and genePredToProt from the UCSC Genomics Institute (binaries downloaded March 5, 2019) [121] with custom script postGeMoMa.py (v1.0), and functional annotation was run with InterProScan (v5.34-73.0) [87]. Pairwise gene homology of the two muntjac annotations as well as total gene homology of the two muntjac, B. taurus (Ensembl release 94 September 2011 genebuild of GCA_000003055.3) [75,99], C. elaphus (publication genebuild of GCA_002197005.1) [76], and R. tarandus [77,100] annotations were analyzed with OrthoVenn [101] using an E-value of 1E-5 and an inflation value of 1.5.
Comparative analysis. The two muntjac assemblies were aligned to each other with cactus (commit e4d0859) [122]. After removing any ambiguous sequence with seqtk randbase (v1.3-r106; https://github.com/lh3/seqtk), the muntjac assemblies, C. elaphus (GCA_002197005.1) [76], and R. tarandus [77,100] were each aligned pairwise against B. taurus (GCA_000003055.3) [75] with cactus (commit e4d0859) [122]. Using custom script cactus_filter.py (v1.0), all pairwise output HAL alignment files were converted into PSL format with halLiftover (commit f7287c8) [123]. Using tools from the UCSC Genomics Institute (binaries downloaded March 5, 2019) [121] unless noted otherwise, the PSL files were filtered and converted with pslMap, axtChain, chainPreNet, chainCleaner (commit aacca59) [124], chainNet, netSyntenic, netToAxt, axtSort, and axtToMaf. Runs of collinearity were extracted from each pairwise MAF file by linking together local alignment blocks where the locations of species one and species two, correspondingly, were in the same orientation and were neighboring in their respective genomes without intervening aligned sequence from elsewhere in the genomes. The pairwise MAF files from the alignments against B. taurus were also merged with ROAST/MULTIZ (v012109) [125], using the phylogenetic topology extracted with Newick utilities (v1.6) [98] from a consensus tree of the species from 10kTrees [126], and sorted with last (v912) [127].
Phylogeny. From the one-to-one orthologous genes of all five species identified by OrthoVenn, codons with potential fourfold degeneracy were extracted from the B. taurus Ensembl release 94 September 2011 genebuild, excluding codons spanning introns, using custom script 4Dextract.py (v1.0). Using the ROAST-merged MAF file with B. taurus as reference, the corresponding codons were identified in the other four species, checking for amino acid conservation and excluding any codons that span two alignment blocks in the MAF file. The output FASTA file containing fourfold degenerate bases was converted into PHYLIP format with BeforePhylo
(v8.2.11) [97] using the GTR+Gamma model of substitution with outgroup B. taurus. As previously described [128], the divergence time confidence intervals from TimeTree [129] for all nodes except the outgroup B. taurus node were input into MEGA7 (v7.0.26) [130], using the Reltime method [131] and the GTR+Gamma model to create a time tree.
Chromatin conformation analysis. Hi-C reads from both species were aligned to the M. muntjak assembly with Juicer (commit d3ee11b) [112], and KR normalized intra-chromosome Hi-C contact matrices were extracted with Juicer Tools (commit d3ee11b) [112] at one Mb resolution. A sliding window-based localized PCA was used to call A/B compartment structure with custom script call-compartments.R (https://bitbucket.org/bredeson/artisanal). Localization of PCA 1 along the diagonal of the Pearson correlation matrix (40 windows of one Mb each with a step size of 20) amplifies compartment signal and mitigates confounding signal from large-scale, intra-chromosome and inter-arm contacts.
Hi-C contacts from the Juicer (commit d3ee11b) [112] merged_nodups.txt output file were split into one Mb and 100 kb bins using custom scripts HiCbins_1Mb.py and HiCbins_100kb.py, respectively. Intra-bin and inter-bin Hi-C contacts were extracted and normalized based on the average number of contacts per bin for each species.
Copy number analysis. To explore the three regions with variation in chromatin contacts, adapter-trimmed 10X Genomics data for each species was aligned to the M. muntjak assembly with BWA (v0.7.17-r1188) [116]. Alignment depth was extracted with SAMtools (v1.6) [132], and copy number was calculated from the average alignment depth per one Mb bin for each species.
2.5
Notes
Availability of data and materials. The assemblies, annotations, and raw data for M. muntjak
and M. reevesi were deposited at NCBI under BioProjects PRJNA542135 and PRJNA542137, respectively. Supporting files for the repeat and gene annotations are available at https://doi.org/10.6078/D1KT16. Unless stated otherwise, custom code used in this study is available at https://github.com/abmudd/Assembly.
Acknowledgements. We thank Jerry Shay and Woody Wright for providing the M. muntjak cell line; Malcolm Ferguson-Smith and Fengtang Yang for providing the M. reevesi cell line; Karen Lundy and the Functional Genomics Laboratory at the University of California Berkeley for running quality control on the extracted DNA; Dovetail Genomics for providing the Hi-C library preparation kit and running quality control on the Hi-C libraries; Shana McDevitt and the
3
Torpid chromosome evolution in frogs
This chapter is an update of an unpublished manuscript, of which I am a co-first author. This work is included with permission from the authors below.
Authors' contributions. Austin B. Mudd extracted DNA and RNA, prepared RNA libraries for
E. pustulosus, assembled and annotated the genomes, completed the bioinformatic analyses, and wrote the manuscript. Jessen V. Bredeson provided the X. tropicalis genome assembly, identified the pericentromeric regions based on Hi-C, and supported the bioinformatic analyses. Sofia Medina Ruiz provided the X. tropicalis genome annotation, curated the repeat library, and completed the repeat analysis. Kelly E. Miller completed the metaphase chromosome spreads in
H. boettgeri and extracted H. boettgeri RNA for sequencing. Dirk Hockemeyer prepared Hi-C libraries. Richard M. Harland and Daniel S. Rokhsar provided scientific leadership of the project and wrote the manuscript.
3.1
Background
For the past century, Drosophila geneticists have explored the content and organization of fruit fly genomes [133]. The identification of Muller elements, or means of classifying chromosome arms in Drosophila melanogaster, gave rise to the study of synteny [11]. The categorization of Muller elements and the corresponding concept of syntenic block conservation has been analyzed in other fruit flies [10,134,135] and extended across the order Diptera and beyond [136,137]. In fact, Sved et al. [135] hypothesized that this conserved syntenic relationship and karyotype stability found in Diptera was unique and may be derived from facets of chromosome organization and structure, with particular emphasis on D. melanogaster’s lack of telomerase and inclusion of telomeric retrotransposons [138]. Although this hypothesis [135] was driven by comparison against taxa with large chromosome variation, such as mammals [139,140], estrildid finches [141], and cichlid fish [142], some vertebrate taxa with torpid karyotype evolution, also known as karyotypic conservatism [60] or chromosomal bradytely [61], have been described, such as cetaceans [143] and frogs [144]. This, therefore, questions whether the presence of long-range or even chromosome-scale conserved syntenic blocks, similar to Muller elements, can be found in species with decreased inter-chromosome variation.
Given the evolutionary significance of finding conserved synteny across disparate branches of the tree of life, we set out to explore karyotype relationships within the frog lineage, classify inter-chromosome variations, and discern syntenic blocks as well as the ancestral chromosome state. To this end, we leveraged new chromosome-scale assemblies of Eleutherodactylus coqui,
Engystomops pustulosus, and Hymenochirus boettgeri; improved assemblies of Leptobrachium (Vibrissaphora) ailaonicum [145], Pyxicephalus adspersus [146], and Xenopus tropicalis; and published assemblies of Ambystoma mexicanum [147,148] and Xenopus laevis [149]. In total, we identified 17 fission, fusion, inter-chromosome translocation, and duplication events, which, based on the total analyzed branch length of 1.05 billion years, resulted in a rate of a single karyotype change every 62 million years. Given the limited chromosome variation, we also
orthologs maintained in the same syntenic block.
3.2
Results and discussion
Assembly. To address the nature of karyotype evolution in frogs, we generated high-quality, chromosome-scale genome assemblies for three new frogs: the Zaire dwarf clawed frog H. boettgeri, a member of the family Pipidae along with Xenopus spp., as well as the common coquí
E. coqui and the túngara frog E. pustulosus, two neobatrachians from the families Eleutherodactylidae and Leptodactylidae, respectively (Table 3.1). These chromosome-scale assemblies were produced with chromatin conformation capture (Dovetail Genomics Hi-C) along with combinations of short reads (short-insert paired-ends and mate pairs), linked reads (10X Genomics Chromium Genome), and long reads (Pacific Biosciences SMRT; Figure 3.1, Table 3.2, Methods).
The assembled chromosome numbers recapitulated the karyotypes described in the literature (2n=26 for E. coqui [150] and 2n=22 for E. pustulosus [151]). Although the literature for H. boettgeri reported a karyotype of 2n=20–24 [152,153], our assembly contained fewer chromosomes, resulting in a karyotype of 2n=18. We confirmed the accuracy of our assembly’s karyotype by performing chromosome spreads (n=75) from H. boettgeri samples, which exhibited both a mode and an average of 2n=18 (Figure 3.2). This karyotype discrepancy with the published literature may have resulted from cryptic sub-populations within H. boettgeri. To augment our newly sequenced frog genomes and expand the phylogenetic scope of our study, we also included revised assemblies of two recently published frogs genomes in our analyses: the African bullfrog P. adspersus, a neobatrachian from the family Pyxicephalidae [146], and the Yunnan moustache toad L. ailaonicum from the family Megophryidae [145]. The assemblies were revised based on manual curation of Hi-C data using Juicebox (v1.9.0) [104], resulting in local and global rearrangements of the published assemblies (Methods). Notably, these curated revisions were carried out independently for each genome, without presuming conserved synteny with the other frogs.
Annotation and homology. For each species except L. ailaonicum, we annotated protein-coding genes based on RNA sequencing (Tables 3.2 and 3.3) and peptide homology with X. tropicalis
(Methods), with the majority of resulting genes annotated by homology and/or domain content (Table 3.4). Gene set comparisons (Figure 3.3A–B) showed that the vast majority of protein-coding genes were conserved among all five frogs, supporting the completeness and accuracy of these assemblies in genic regions, although individual species differed in their completeness with regard to this metric. As expected from the inclusion of deep long-read sequencing and more
ailaonicum [145,154] and the L and S subgenomes of allotetraploid X. laevis (v9) [149]. The special treatment of these three (sub)genomes was due to the lower quality of the L. ailaonicum
annotation and the known propensity for evolutionary gene loss in paleotetraploids. For analyses of synteny, we further restricted our attention to the 7,292 one-to-one gene orthologs that were only present on chromosomes, as opposed to unlinked scaffolds, in the core genomes E. coqui, E. pustulosus, H. boettgeri, P. adspersus, and X. tropicalis (Figure 3.4).
Synteny and ancestral state. Despite divergence times of up to 200 million years, the six frog genomes were readily aligned to X. tropicalis. We also aligned the greatly expanded and more deeply diverged axolotl A. mexicanum assembly (GCA_002915635.2) [147,148] to X. tropicalis. These sequence alignments were merged into runs of collinearity (Figures 3.5 and 3.6).
Analysis of these alignments revealed the timing of fission and fusion events in each lineage as well as the ancestral karyotype states (Figure 3.4B). From this, we identified the presence of 13 syntenic blocks, which we classified as elements A to M, in the examined frog species. Over 95% (6,952 of 7,292) of chromosome one-to-one gene orthologs were maintained in the same element among the five main frog species, similar to the 95% ortholog localization to Muller elements in
Drosophila spp. (Figure 3.4B) [10], despite a total nucleotide divergence based on fourfold degeneracy between all examined frog species of 2.58 substitutions per site (Table 3.5). We noted no significant size variation between these elements or deviation in gene or repeat count across these five species (Figure 3.7; Table 3.6). We found that element A had the largest gene count in all examined species and that element H had the smallest gene count (Figure 3.7B). Although the number and boundaries of these elements may change as more chromosome-scale frog assemblies are analyzed in the future [155], this finding suggested a principle of long-range, and even chromosome-scale, synteny across multiple branches of the tree of life and could enable future chromosome naming in frogs based on these elements, similar to Muller elements in Drosophila spp. [10].
We also found that these 13 elements reflected the 13 chromosomes in the pipanuran ancestor, defined in the sense of Cannatella and Ford [156], which agreed with the prior assertion of 26 basal chromosomes in frogs [157]. This ancestral karyotype, however, may not apply to species phylogenetically basal to the analyzed species, such as those in superfamilies Leiopelmatoidea and Discoglossoidea. This delineation of ancestral karyotype may have phylogenetic relevance, given the historical use of karyotype to differentiate suborders Neobatrachia and Archaeobatrachia [157]. In order to identify the ancestral karyotype of all frogs, more data, particularly from superfamilies Leiopelmatoidea and Discoglossoidea, is needed.
Chromosome evolution. Using the runs of collinearity (Figures 3.5 and 3.6), chromosome one-to-one gene orthologs (Figure 3.4B), and Hi-C-based estimates of the pericentromeric locations (Methods), we assessed chromosome evolution and conservation between the aforementioned frog assemblies. For convenience, we referred to chromosome regions by their ancestral chromosome identifiers. Overall, we found broad pericentromeric conservation between the identified species (Figures 3.4B and 3.8), with some movement of the pericentromeric region across the frog lineage. Using the repeat landscape as a proxy for the state of the historic sequence, we identified several examples of centromere inactivation resulting from likely
events, in addition to the previously reported end-to-end fusion of L/M and the whole-genome duplication in X. laevis [149], we identified a potential reciprocal chromosome arm translocation of A/M in P. adspersus, a potential Robertsonian fusion of I/M and an end-to-end fusion of D/K in E. pustulosus, and an end-to-end fusion of J_K/M in H. boettgeri. In E. coqui, we found two Robertsonian fissions of A and G, a potentially Robertsonian fusion of I/K, and a significant series of Robertsonian rearrangements involving B, E, F, and H that resulted in Bprox/H, Bdist/Fdist, and E/Fprox.
In the pipid lineage, we also found three ancestral fusions: two end-to-end fusions of D/E and J/K as well as a potentially Robertsonian fusion of H/I. We corroborated the separation of ancestral chromosomes D/E, H/I, and J/K in Ascaphus truei (unpublished). We additionally analyzed the state of these three ancestral chromosomes in A. mexicanum (Figure 3.5A), which supported the separation of J/K but did not support the separation of D/E and H/I. Our hypothesis that the three fusions occurred in the pipid common ancestor instead of fissions in the acosmanuran ancestor will be further tested with future chromosome-scale genome assemblies of frogs phylogenetically basal to the analyzed species [155]. Nonetheless, maintenance of the described collinearity must have biological significance, such as the role of recombination, chromosome territories, and aspects of three-dimensional chromosome structures like Rabl. Divergence from collinearity in frogs, much like in Drosophila spp. [11], may be nonrandom. The long-range and, in most cases, chromosome-scale collinearity among the examined frog species, despite a total branch length of 1.05 billion years (Table 3.7), paralleled the synteny observed in birds [158] and reptiles [159] and differed from the significant chromosome variation found in mammals [139,140]. Assuming the rearrangement in E. coqui resulted from two Robertsonian fissions of B and F, followed by three Robertsonian fusions, we calculated a total of 17 fission, fusion, translocation, and duplication events, excluding intra-chromosome variations, resulting in a karyotype change every 62 million years (Figure 3.4B). This rate was slightly faster than the chromosome number change every 70 to 90 million years reported in literature [144,160] but still slower than karyotype change rates for mammals [78] and many reptiles [161]. Of course, the present rate calculation was limited, based on only seven species, and the rate may vary depending on the analyzed species. Some frog taxa will have a higher rate of karyotype change, such as Eleutherodactylus spp. (2n=16–32) or Pristimantis spp. (2n=22–38) [150]. On the other hand, some species may have had no significant inter-chromosome changes over the past 205 million years, such as Rana temporaria [162] or L. ailaonicum (Figure 3.4B). Nonetheless, this analysis of chromosome variation across the frog lineage suggested a slow rate of karyotype evolution.
Conclusions. Analysis of these new chromosome-scale assemblies identified the presence of syntenic blocks in frogs, denoting the existence of chromosome stability in multiple branches of
3.3
Figures and tables
Figure 3.1. Visualization of chromosomes’ Hi-C contact maps for [A] E. coqui, [B] E. pustulosus, [C] H. boettgeri, [D] L. ailaonicum, and [E] P. adspersus in Juicebox (v1.11.08) [104] with a minimum MAPping Quality (MAPQ) of zero or greater below the diagonal and MAPQ ≥ 30 above the diagonal. The golden lines demarcate the boundaries of the chromosomes.
Figure 3.3. Analyzed with OrthoVenn2 [102], [A] the occurrence table of gene homology clusters containing three or more species between the five frog annotations completed in this analysis, [B] Venn diagram of gene homology between these five species and [C] the occurrence table of gene homology clusters containing six or more species between all seven chromosome-scale frog species. In the occurrence tables, the green and grey ovals represent the presence or absence, respectively, of that species in the OrthoVenn2 clustering.
Figure 3.4. [A] Pairwise distances in substitutions per fourfold degenerate site extracted from the RAxML (v8.2.11) [97] phylogenetic tree using Newick utilities (v1.6) [98] were shown relative to the reference genome X. tropicalis. [B] Phylogenetic tree and gene ortholog alignment. The phylogenetic tree of the seven analyzed species, calculated from fourfold degenerate sites and divergence time confidence intervals, was visualized with FigTree (commit 901211e; https://github.com/rambaut/figtree). The ancestral karyotype at each node was labeled on the tree. The alignment plot was generated with jcvi.graphics.karyotype (v0.8.12; https://github.com/tanghaibao/jcvi) using the 7,292 described chromosome one-to-one gene orthologs from OrthoVenn2 [102], followed by visual filtering of single stray orthologs. The pericentromeric region based on Hi-C inference was represented with a black circle on each chromosome. The ancestral chromosomes (A to M) were labeled at the top of the alignment based on the corresponding region in P. adspersus. The alignments for each ancestral chromosome were colored uniquely, with those upstream and downstream of the X. tropicalis
centromeric satellite repeat shaded with a light versus dark shade of the ancestral chromosome color. Chromosomes labeled with an asterisk were reverse complemented in this image relative to the orientation in the assembly.
Figure 3.5. Circos (v0.69-6) [103] plots with runs of collinearity containing at least five kilobases (kb) of aligned sequence between [A] X. tropicalis (left, Xt) and A. mexicanum (right, Am), [B] X. tropicalis (left, Xt) and E. coqui (right, Ec), [C] X. tropicalis (left, Xt) and E. pustulosus (right, Ep), [D] X. tropicalis (left, Xt) and H. boettgeri (right, Hb), [E] X. tropicalis
Figure 3.6. The alignment plot was generated with jcvi.graphics.karyotype (v0.8.12; https://github.com/tanghaibao/jcvi) using runs of collinearity containing at least one kb of aligned sequence between the species, extracted from the ROAST-merged MAF file. The ancestral chromosomes (A to M) were labeled at the top of the alignment based on the corresponding region in P. adspersus. Chromosomes labeled with an asterisk were reverse complemented in this image relative to the orientation in the assembly.
![Figure 2.1. [A] The phylogenetic tree of the five analyzed species, calculated from fourfold degenerate sites and divergence time confidence intervals, was visualized with FigTree (commit 901211e; https://github.com/rambaut/figtree)](https://thumb-us.123doks.com/thumbv2/123dok_us/11073058.2993720/15.918.114.804.470.760/phylogenetic-analyzed-calculated-degenerate-divergence-confidence-intervals-visualized.webp)
![Figure 2.2. [A] Venn diagram of gene homology between the two muntjac annotations, B. taurus (Ensembl release 94 September 2011 genebuild of GCA_000003055.3) [75,99], C](https://thumb-us.123doks.com/thumbv2/123dok_us/11073058.2993720/16.918.110.807.109.525/figure-diagram-homology-muntjac-annotations-ensembl-september-genebuild.webp)
![Figure 2.3. Circos (v0.69-6) [103] plots with runs of collinearity containing at least 25 kb of aligned sequence between [A] B](https://thumb-us.123doks.com/thumbv2/123dok_us/11073058.2993720/17.918.111.810.107.806/figure-circos-plots-runs-collinearity-containing-aligned-sequence.webp)
![Figure 2.4. Circos (v0.69-6) [103] plots using runs of collinearity containing at least 25 kb of aligned sequence between [A] B](https://thumb-us.123doks.com/thumbv2/123dok_us/11073058.2993720/18.918.248.673.115.955/figure-circos-plots-using-collinearity-containing-aligned-sequence.webp)
![Figure 2.5. Circos (v0.69-6) [103] plots using runs of collinearity containing at least 25 kb of aligned sequence between [A] B](https://thumb-us.123doks.com/thumbv2/123dok_us/11073058.2993720/19.918.112.816.93.804/figure-circos-plots-using-collinearity-containing-aligned-sequence.webp)