Performance Core Information Collection Model for Cloud Environment
1Wang Zhijian,
2Chen Bin,
3Wang Yu,
4Mu Zhongping
1
Computer & Information Engineering College of HoHai University, [email protected]
2Computer & Information Engineering College of HoHai University,
[email protected]
3
Computer & Information Engineering College of HoHai University, [email protected]
4Nanjing Panda Electronics Co., Ltd., [email protected]
Abstract
Cloud Computing has become another buzzword in recent years. Follow the popular research and use of the cloud system the performance become the bottleneck of the Newborn. More and more researches are turning their attention to analyze the performance of the cloud services. However, it is hard to extract accurate information from the different type of the cloud components such as datacenter, host, Virtual Machines (VM) in the cloud. Thus, it is significant to collect sufficient row data of the Cloud systems for the performance analysis. In this paper, we described an analysis framework to evaluate comprehensive performance guideline of cloud computing center. The analysis architecture is built based on the performance agent and server interface method (PASI), which consists of performance client (PMC), performance agent (PMA) and performance server (PMS), and we put forward a mathematical model based on the PASI information and queuing theory to forecast the idle rate and availability of the cloud environment. It is proved that the PASI architecture is correctly and effectively evaluates the performance of the cloud component and whole cloud environment.
Keywords
: Cloud Computing, Performance Core Information, Performance Analysis, Information Collection Model1. Introduction
The introduction of cloud computing has become a popular computing paradigm in which virtualized and scalable resources are provided as services over the internet. The service models that support the Cloud service architecture include Software as a Service (SaaS), Platform as a Service (PaaS), and Infrastructure as a Service (IaaS), PaaS cloud systems provide a software execution environment that application services can run on. The environment is not just a pre-installed operating system but is also integrated with a programming-language-level platform, which users can be used to develop and build applications for the web applications platform. Various cloud computing products and projects have been tremendously beneficial to network applications, such as Amazon EC2, IBM Blue Cloud, etc. In a scenario where the organization is utilizing the services of Cloud, these devices also need a dedicated connection which connects them to the providers of these services. Organizations emphasize greatly on maintaining connectivity, no matter the devices are located on the same network supported by the organization or some other external network. In a situation like this the concept of IP mobility comes into picture.
As there is little consensus on how to define the cloud, there are still a few common key points in the definition. This new cloud computing software model is a shift from the traditional single tenant approach to software development to that of a scalable, multi-tenant, multi-platform, multi-network, and global [1]. Above all, cloud computing is a specialized distributed computing paradigm. It differs from traditional ones in that 1) it is massively scalable, 2) can be encapsulated as an abstract entity that delivers different levels of services to customers outside the Cloud, 3) it is driven by economies of scale, and 4) the services can be dynamically configured (via virtualization or other approaches) and
1) The key technologies research of information metadata applications of the project based on volunteer computing supported by NSFC [Supported by NSFC NO. (61103017)]
2) The Internet of things in Jiangsu Province demonstration "The intelligent environment monitoring of water and emergency treatment demonstration project and standardization construction" 2011.12-2013.1(Su property industry NO.[2011]209) 3) The natural science foundation of Jiangsu Province in 2012 "The data in the cloud environment safe recovery of applied
research"
Journal of Convergence Information Technology(JCIT) Volume8, Number6,Mar 2013
delivered on demand[2]. As Cloud defined on services, it should be provided stable and smoothly service, and avoid prompt execution caused by request message task exceed the response capacity of the cloud center.
As the descriptions mentioned above, providing enough performance information of cloud component is essential, and build high-quality cloud services obviously becomes an important and necessary research category. Mutual information is exploited to quantify the relevance and redundancy among the large number of performance metrics [3]. However, continuous monitoring and large system scale lead to the overwhelming volume of data collected by health monitoring tools. So collect exactly on sufficient and valid data for performance analysis is necessary. It means that, appropriate selection method and collection frequency of working data is very important for the effect and exactitude of the performance analysis.
As a cloud application typically consists of multiple cloud components communicating with each other over application programming interfaces [4], In this paper, we propose a system performance collection framework construct on client and server mode. We obtain reference parameter from performance agent (PMA) deployed on the different cloud component performance client (PMC), and recycle the data to the performance server (PMS) deployed on the cloud task queue management cluster.
The rest of this paper is organized as follows: Section II describes the related work about performance analysis of the cloud computing center. Section III presents the PASI model for cloud computing on IAAS in detail. Section IV provides the modeling and analysis. Section V discusses the numerical illustration and Section VI concludes the paper while give the perspective about the future work.
2. Related work
Performance analysis has become one of the most important research directions in cloud computing field in recent years. The research works on the performance analysis of cloud can be almost divided into three categories by the arrange layer of the objects: Performance analysis on cloud center, Performance analysis on cloud application, and Performance analysis on cloud components. And can be recognized as two aspects in Forecast granularity: prediction and real time status [5].
Performance of cloud center was described in a new approximate analytical model, and analyzed under burst arrival and total rejection policy [6]. In the paper model the cloud environment as an M[x]/G/m/m +r queuing system. As a result The number of facility nodes is m and the capacity of system is equal to m+r.
It was proposed a typical cloud environment comprises thousands of clouds servers (physical machines) and each of them can be segmented into a number of independent or interconnected VMs (Virtual Machines) [7], and services can be distributed across different VMs as well as physical machines within a cloud as well as distributed clouds. And the paper focuses on the measurement of the performance analysis of cloud application. Porting a scientific application like the SN factory pipeline to the Amazon EC2 framework requires the development of some infrastructure and significant planning and testing [8].
The Inter cloud is the ultimate vision behind the unprecedented success of the cloud paradigm. It is the cloud, service in any cloud system in the web gets discovered and utilized for creating bigger and better applications that are people-aware and aligned. All kinds of differences (technology, protocol, platform etc.) get simply vanished in the Inter cloud setup so that all kinds of interactions among clouds are fully automated. The performance information of the Inter cloud can be gathered in the central information Collector.
According to Gartner’s report, there is a huge market value for cloud brokerage services (CBS) in the years to come. With the surging popularity of cloud computing, a number of unique cloud service providers (CSPs) (small, medium and large) have put their shops and serving up specific as well as generic sets of users. Fig.1 shows the different cloud brokerage services. As the official studies the huge value of CBS is weaken recently while the performance level is not perfectly arriving the expected level. The group of CBS researcher is putting in more energy in the efficiency now.
As analysis aspect discussed above is more macroscopically, expound a special performance analysis method towards cloud applications and components. As computational grids process large, computationally intensive problems on small data sets [9], it shows the implementation of the
complicated functions by combing several abstract tasks. Each task can selects an optimal cloud component from a set of functionally equivalent component candidates. The cloud application is implemented for task execution by composing the selected components, which candidates are distributed in different locations, and invoked through communication links. The paper proposed a collector and predictor model for performance monitor, which monitored the user-side real-time performance of cloud components. All of them aim to gain more accurate analysis result of the performance of the cloud.
In this paper, we focus on the collection of related performance data on PASI model. Compare the integrality and validity of the performance data collected by the model and before, we prove the usability of the model.
3. PASI Model for cloud computing
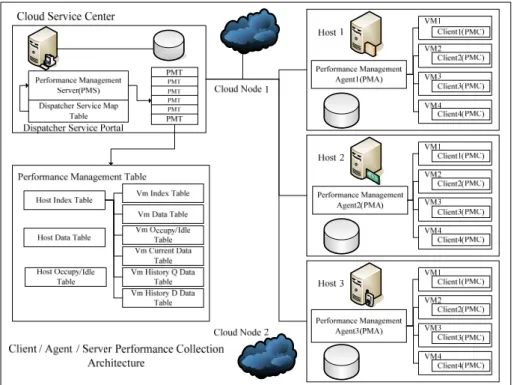
The architecture of performance client, agent and server collection model established on the deployed of application on the portal, host and VMs of the cloud. The PMS application embedded on the portal of the cloud, it is consist by the map of host queue, which include the performance information of the hosts and the VMs run on them. Consumers need to make prediction on quality of unused web services before selecting. Usually, this prediction is based on other consumers’ experiences [10]. The performance data is collect from the agent application deployed on the hosts, and the data of the agent comes from the client application deployed on the VMs. Because all the available cloud components from user-side for evaluation purpose is expensive and impractical [11], the performance management table on PMS including host index table, host data table, host occupy/idle table, and the crucial information placed in the host index table contain VM index table, VM data table, VM occupy/idle table, VM current data table, VM history quarter data table, and VM history day data table. The key data lingering on the performance table include: 1. Request times in the period. 2. Vacant times in the period. 3. Average request time in the period. 4. Average failure rate for quest in the period. And the granularity of the data consists by current quarter, current day, history quarter queue, and history day queue. Performance data report from the PMC running on the VM, and received by PMA deployed in the host. The PMA compute the data during the setup collect period, and synchronize to the PMS when the time arrives. The performance data transmitted to the PMS will be put together and generate ultimate statistic information by queuing theory modeling as a result. All PMC embedded in the different VM, which distributed on either a single cloud node or multiple cloud nodes that the PMA run on. Successful provision of infrastructure-as-a-service (IaaS) and, consequently, widespread adoption of cloud computing necessitates accurate performance evaluation that allows service providers to dimension their resources in order to fulfill the service level agreements with their customers [12].
Figure 1.
Architecture of performance client, agent and server collection model
As insisted and indicated elsewhere, performance in a cloud context is a serious issue not to be side stepped easily. Cloud performance is always a key factor for the envisioned success of clouds. Poor performance causes CSPs to lose their customers and thereby the brand value too. Because application performance can vary significantly based on its production environment and the delivery infrastructure, businesses must make certain that the performance facet of new-generation applications is fully geared and optimized when building for deployment on a cloud [13]. Similarly when legacy applications are appropriately modernized and moved from traditional data centers to a cloud centre, the performance criterion has to be given utmost consideration to be effective in their outlooks, offerings, and outputs.Performance of a node is first of all characterized by its (current) utilization, defined as fraction of time during which the node is busy with serving incoming requests. Other performance indicators are message rates and network traffic processed by the node. These properties are covered by the metrics at different levels. Atomic Service Level utilization of nodes constitutes from fractions of time used to serve individual requests. That is, the time used to execute certain functionalities in response to incoming messages. In the network throughput context, each of the service functionality is characterized by sizes of input and output messages. Composite Service Level service under consideration is composite, and then the invocation of its functionalities implies a number of cascading calls to subordinate services. These calls cause additional utilization of corresponding nodes. To have an exact picture of the influence of an invocation upon utilizations of all N nodes of the system, each VM should be analyzed instead of the consideration of the single node. Process Level Processes and workflows represent the greatest abstraction of the service interactions and collaborations towards the efficient accomplishment of business goals and needs [14]. So the PASI architecture can be embedded in the different level node division mentioned above.
4. Modeling and analysis
We consider the performance data collect from VMs, the cloud component response time is meaning the time from arrival the VM to the ending of response, the time recode by the PMC and relevant information such as average CPU and memory occupancy rate. The PMA receive the data transmit from PMC, then process for statistics. When a quarter arrive, the PMA will packet the total
data of the period, and transfer to the PMS. The information includes the each fragment of PMC response, and handle by the PMA, which includes such as: request times in the period, vacant times in the period, average request time in the period, average failure rate for quest in the period of each corresponding PMC. After the PMS obtain the data from PMA, the data will be accumulated to current day record and synchronized to the history quarter and history day queue if the condition reaches. Of course the common response of user request will be handled real-time. The steady-state probability distributions and the expected number of customers in the system are derived, which are used to construct a cost function [15].
We adopt queuing theory as the abstract model for get the result of average running time of the VM in the period. In order to gain maximum net profit, the threshold values of queue length at which servers are made available one by one, are determined [16]. It is very important to place requested applications into available computing servers regarding to energy consumption [17]. And we use an approximate embedded Markovian process for analyzing the result of the steady VM queue size and the average number of client request in the system with designated transactor. We assume the request arrive VM is abide by Poisson distribution with λ, and is subordinated to the exponent of μ. If the request number is i, the service complete rate µi:
(1 ); ( )
i i i M M M i N
(1) According to queuing theory, VM service intensity is δ=λ/μ, the probability for coexists of pi:
0(1 ); 0( ) ! ! i i i i M p p i M p M i N i M M (2) 1 1 0 0 0 ( ) ( 0); ! ! (1 ); ( ) ! ! i i M N i i M i i M i i i M p i i M M p i M p M i N i M M
(3) 01
N m i i iT
p
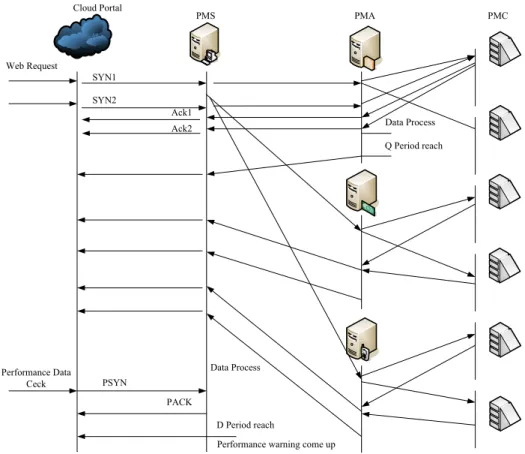
(4)Web Request SYN1 SYN2 Cloud Portal PMS PMA PMC Ack1
Ack2 Data Process
Q Period reach Data Process D Period reach PSYN PACK Performance Data Ceck
Performance warning come up
Figure 2. Web request distribution and performance information organization in CAS
The result of Tm is the degree of load during the specified period. Then we will research on the length of the request queue transmit to PMC and ultimately feedback to PMS. We assume the requests are random and exponential distribution with mean arrival rate σ, and mean service rate θi for ith(1≤i≤y) PMC. Mi means the specific level of PMC available. We define Sx as the stable probability of the x external requests on the y PMC processing system. The equations for the CAS system with y PMC are as follows: 0 1 1 1 1 1 1 1
(
)
1
2
x x xS
S
S
S
S
x
M
(5) 1 2 1 1(
)
1
1,
i i i i M M i M i i j jS
S
S
i
y
(6) 1 1 1(
)
2
1,
2
i x x i x i iS
S
S
i
y
M
x
M
(7) 1 1 1(
)
1
i x x y x yS
S
S
M
x
K
(8)1
y
S
KS
K
(9)From the relationship between stable probability Sx multiple with service rate θi and arrive rate σ, we can get the stable length of the requests queue by (7)-(9) as:
0 1 0
,1
11
/
x j jS
S
x
M
(10) 1 1 1 1 0 1 12,3,...,
1,
1
j j i i M M x M x j i j i iS
S
i
y
M
x
M
(11) 1 1 1 1 0 1 1 j j y y M M x M x j y j yS
S
M
x
K
(12) 1 1 1 1 1 1 1 1 1 1 1 0 0 1 1 1 1 2 1 1 1 1 1 1 1 1 1 1 1 1 j j y j j i i y i i M M y K j j j j j i M j M M M M y j j M M i j j i j K M y y M M i y i y S S S S
(13)The ith(1≤i≤y) PMC running in the system can be description by:
1 1 1 1 0 1( ) Pr
1
1
1
i i j j i i M M i M M i i j iS r
ob M
x
M
S
(14)So we can derive that y PMC are running in the cloud
1 1 1 1 1 0 1( ) Pr
1
1
y j j y K M y M M y y j yS y
ob M
x
K
S
(15)That ith(1≤i≤y) PMC keep in working state probability is:
( )
( )
y E j iS i
S j
(16)We can obtain the average load degree of the cloud center as (4)+(12): / /
*
( )
Q D m E cloud Q DT
S i
D
P
(17)Finally, cloud center portal system can adjust VM resource automatically by relevant method, and produce the overload warning to controller system when the Dcloud is beyond the threshold.
5. Numerical illustration
In this section, we will demonstrate the mathematical model loading time in HPL, which is called high performance Link pack standard, and reckoning of the probability of the x external requests on the y PMC processing system by different configurations. In config1 the PMC receive the request in the rate as θj=1, and in config2 as θj=1+ (j+1)*Pr, Pr is the deployment coefficient.
We give the Tm as the degree of load during the specified period, numerical results of SE (i) and
D
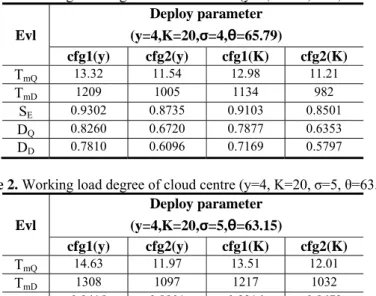
cloudQ D/ for CAS system in Table 1. We deploy the different parameter as the condition of the experiment.Table 1. Working load degree of cloud centre (y=4, K=20, σ=4, θ=65.79)
Evl Deploy parameter (y=4,K=20,σ=4,θ=65.79) cfg1(y) cfg2(y) cfg1(K) cfg2(K) TmQ 13.32 11.54 12.98 11.21 TmD 1209 1005 1134 982 SE 0.9302 0.8735 0.9103 0.8501 DQ 0.8260 0.6720 0.7877 0.6353 DD 0.7810 0.6096 0.7169 0.5797 Table 2. Working load degree of cloud centre (y=4, K=20, σ=5, θ=63.15)
Evl Deploy parameter (y=4,K=20,σ=5,θ=63.15) cfg1(y) cfg2(y) cfg1(K) cfg2(K) TmQ 14.63 11.97 13.51 12.01 TmD 1308 1097 1217 1032 SE 0.9415 0.8801 0.9216 0.8673 DQ 0.9183 0.7023 0.8301 0.6944 DD 0.8552 0.6705 0.7789 0.6216 Table 3. Working load degree of cloud centre (y=5, K=30, σ=4, θ=66.12)
Evl Deploy parameter (y=5,K=30,σ=4,θ=66.12) cfg1(y) cfg2(y) cfg1(K) cfg2(K) TmQ 12.17 10.01 11.54 9.93 TmD 1132 961 1028 913 SE 0.9023 0.8311 0.8958 0.8383 DQ 0.7321 0.5546 0.6892 0.5550 DD 0.7093 0.5546 0.6395 0.5315
Table 4. Working load degree of cloud centre (y=6, K=30, σ=5, θ=64.07) Evl Deploy parameter (y=6,K=30,σ=5,θ=64.07) cfg1(y) cfg2(y) cfg1(K) cfg2(K) TmQ 11.65 11.92 12.70 11.03 TmD 1056 1063 1089 977 SE 0.9396 0.8743 0.9088 0.8485 DQ 0.7250 0.6948 0.7695 0.6239 DD 0.6904 0.6454 0.6877 0.5757
In summary, we can argue the case of relationship between TM, SE and DQ/D effectively. Given the latent feature vectors of users and components in time slices, the latent feature vectors in time slice can be predicted by precisely modeling the trends of features. Intuitively, older features are less correlated with a component’s current status or a user’s current characteristics. To characterize the latent features at time slice, the prediction calculation should rely more on the information collected in the latest time slices than that collected in older time slices. In order to integrate the information from different time slices, we therefore employ the temporal relevance function to gain the result.
Where k is the amount of time that has passed since the corresponding information was collected. f(k) measures the relevance of information collected from different time slices for making prediction on latent features at time slices [18]. Note that f(k) decreases with k. By employing the temporal relevance function f(k), we can assign a weight for each latent feature vector depending on the collecting time when making the prediction. In the temporal relevance function, α controls the decaying rate. By setting α to 0, the evolutionary nature of the information is ignored. A constant temporal relevance value of 1 is assigned to latent feature vectors in all the time slices, which means latent feature vectors in time slice are predicted simply by averaging the vectors before time slice.
By analyzing the collected performance information, we ultimately obtain two important observations: 1) the working load degree SE is come down follow the decrease of the deploy parameter, on the contrary, the working load degree SE is come up follow the increase of the deploy parameter. 2) the most important impact factor of the deploy parameter is the agent number deployed in the virtual machine. As the experimental data, we can describe the relationship by the different following charts:
DQ TmQ 11 11.5 12 12.5 13 13.5 14 14.5 15 cfg2 cfg1 0.60 0.65 0.70 0.75 0.80 0.85 0.90 0.95 1.00 DD TmD 900 950 1000 1050 1100 1150 1200 1250 1300 cfg2 cfg1 0.60 0.65 0.70 0.75 0.80 0.85 0.90 0.95 1.00
Figure 5. Result of RS (DQ, TmQ, cfg) Figure 6. Result of RS (DD, TmD, cfg)
From the Table1-Table4, we can get the conclusion that the change of y, K, θ, σ obviously impact the result of TmQ/D, and the result of TmQ/D will cause the change of the DQ/D.
6. Conclusions
In this paper, we have described a performance collection model for cloud environment with performance client, performance agent and performance server interface on IAAS mode. In this model, we can gather performance information from client to agent than to server, and obtain the average load degree of the cloud center ultimately by them. The cloud center system can adjust the cloud component composition by the portal.
For future work, we will concentrate on the enhancement of the efficiency of the cloud environment, which in use of the PASI architecture. Safe guarantee is necessary to be considered.
7. References
[1] “Twenty Experts Define Cloud Computing”, SYS-CON Media Inc, http://cloudcomputing.sys-con.com/read/612375_p.htm, 2008.
[2] Ian Foster,Yong Zhao,Ioan Raicu,et al.Cloud Computing and Grid Computing 360-Degree Compared[C]//Proceedings of IEEE Grid Computing Environments workshop (CCE08).USA:IEEE Computer Society,2008:1-10.
[3] Song Fu, "Performance Metric Selection for Autonomic Anomaly Detection on Cloud Computing Systems", This full text paper was peer reviewed at the direction of IEEE Communications Society subject matter experts for publication in the IEEE Globecom 2011 proceedings.
[4] Yilei Zhang, Zibin Zheng, Michael R. Lyu, "Real-Time Performance Prediction for Cloud Components", 2012 IEEE 15th International Symposium on Object/Component/Service-Oriented Real-Time Distributed Computing Workshops
[5] V. Goswami, S. S. Patra, G. B. Mund , “Performance Analysis of Cloud with Queue-Dependent Virtual Machines”, 1st Int’l Conf. on Recent Advances in Information Technology | RAIT-2012 [6] Hamzeh Khazaei, Jelena Miˇsi´, Vojislav B. Miˇsi´c , “Performance Analysis of Cloud Centers
under Burst Arrivals and Total Rejection Policy”, This full text paper was peer reviewed at the direction of IEEE Communications Society subject matter experts for publication in the IEEE Globecom 2011 proceedings.
[7] RajaRaajeswari, Selvarani, Pethuru Raj , “A Performance Analysis Method for Service-Oriented Cloud Applications (SOCAs)”, 2012 International Conference on Computer Communication and Informatics (ICCCI -2012), Jan. 10 – 12, 2012, Coimbatore, INDIA.
[8] Keith R. Jackson, Krishna Muriki, Lavanya Ramakrishnan, Karl J. Runge, Rollin C. Thomas, "Performance and cost analysis of the Supernova factory on the Amazon AWS cloud",Scientific Programming 19 (2011) 107–119, DOI 10.3233/SPR-2011-0324, IOS Press, Lawrence Berkeley National Lab, Berkeley, CA, USA, 2011.
[9] W. Bell, D. Cameron, L. Capozza, P. Millar, K. Stockinger, F. Zini. “Simulation of dynamic Grid replication strategies in OptorSim”, Proceedings of the 3rd International Workshop on Grid Computing (Grid 2002), Baltimore, U.S.A. IEEE CS Press: Los Alamitos, CA, U.S.A., November 18, 2002.
[10]L. Shao, J. Zhang, Y. Wei, J. Zhao, B. Xie, and H. Mei, “Personalized QoS Prediction for Web Services via Collaborative Filtering” in Proc. of ICWS’07, 2007, pp. 439–446
[11]Y. Zhang, Z. Zheng, and M. Lyu, “Exploring latent features for memory-based qos prediction in cloud computing” in Proc. of SRDS’11, 2011.
[12]H. Khazaei, J. Miˇsi´c, and V. B. Miˇsi´c, “Modelling of cloud computing centers using M/G/m queues” in The first international workshop on Data Center Performance, Minneapolis, MN, Mar. 2011.
[13]Dung-Hai Liang, Peirchyi Lii, Dong-Shong Liang, "Risk Management of Land Use on Cloud Computing", JCIT: Journal of Convergence Information Technology, Vol. 7, No. 1, pp. 122 ~ 129, 2012.
[14]J. B. Ke, J. C. Ke, and C. H. Lin, “Cost optimization of an M/M/r queueing system with queue-dependent servers: Genetic algorithm” in Proc. 5th International Conference on Queueing Theory and Network Applications (QTNA’10), 2010, pp. 82–86.
[15]Jain, M. (2005). Finite capacity M/M/r queueing system with queue-dependent servers, Computers and Mathematics with Applications. 50, 187-199.
[16]Jianfeng Zhao, Wenhua Zeng, Miu Liu,Guangming Li, "A model of Virtual Resource Scheduling in Cloud Computing and Its Solution using EDAs", JDCTA: International Journal of Digital Content Technology and its Applications, Vol. 6, No. 4, pp. 102 ~ 113, 2012
[17]B. Li, J. Li, J. Huai, T. Wo, Q. Li, and L. Zhong, “Enacloud: An energy saving application live placement approach for cloud computing environments” in Proc. IEEE International Conference on Cloud Computing (CLOUD’09), 2009, pp. 17–24.
[18]Liu Hai, He Chaobo,Tang Yong, Huang ShiPing, "Research and Applicatoin of Service-Oriented Scholar Cloud Platform", JCIT: Journal of Convergence Information Technology, Vol. 7, No. 5, pp. 333 ~ 339, 2012