Wayne State University Dissertations
1-1-2014
Building A Scalable And High-Performance
Key-Value Store System
Yuehai Xu
Wayne State University,
Follow this and additional works at:http://digitalcommons.wayne.edu/oa_dissertations
Part of theComputer Engineering Commons, and theComputer Sciences Commons
This Open Access Dissertation is brought to you for free and open access by DigitalCommons@WayneState. It has been accepted for inclusion in Wayne State University Dissertations by an authorized administrator of DigitalCommons@WayneState.
Recommended Citation
Xu, Yuehai, "Building A Scalable And High-Performance Key-Value Store System" (2014).Wayne State University Dissertations.Paper 1060.
KEY-VALUE STORE SYSTEM by
YUEHAI XU DISSERTATION
Submitted to the Graduate School of Wayne State University,
Detroit, Michigan
in partial fulfillment of the requirements for the degree of
DOCTOR OF PHILOSOPHY 2014 MAJOR: COMPUTER ENGINEERING Approved by: Advisor Date
One of my most major life decisions was to pursue a PhD program in the US. Without the help of so many people in various ways, this dissertation would never have been written. First and for formost, I would like to express deepest grateful to my advisor, Dr. Song Jiang, for his invaluable guidance, support and encouragement via this work. His critical thinking and spirit of innovation are always my irreplaceable assets that guide me in my daily life and work.
I would like to thank Dr. Eitan Frachtenberg, my mentor when I was an intern at Facebook. I still feel excited for the work we have done, that delivered meaningful impaction on production systems. In addition, A thank you to Berk Atikoglu and Mike Paleczny who introduced me the Memcached system, and shared me with their system knowledge.
I would also like to thank Dr. Cheng-Zhong Xu, Dr. Weisong Shi, and Dr. Nabil J. Sarhan for being my committee members and their insightful suggestions on this work.
Thank you to all of my dear friends with whom I shared interesting ideas, and sleepless nights of hacking. They are Xuechen Zhang, Yizhe Wang, Jia Rao, Kun Wang, Jianqiang Ou, Xingbo Wu, Wenbo Qiao, Hao Zhou and so many others.
Finally, this thesis would not be possible without the unconditional support from my parents Pingxiu Liang and Jisheng Xu. And my wife, Dan Ao. They are forever my driving force that propels me forward.
Acknowledgements . . . ii
List of Figures . . . vi
List of Tables . . . viii
Chapter 1 Introduction . . . 1
1.1 Motivation . . . 2
1.1.1 Demand on Study of Workloads’ Characteristics . . . 2
1.1.2 KV Cache: A CPU-demanding Application . . . 3
1.2 Thesis Contributions . . . 8
1.2.1 Characterizing Facebook’s Memcached Workload . . . 8
1.2.2 Hippos: A Light-weight and Energy-efficient Appliance . . . . 9
1.3 Dissertation Organization . . . 10
Chapter 2 Characterizing Facebook’s Memcached Workload . . . 12
2.1 Introduction . . . 12
2.1.1 Software Architecture . . . 13
2.1.2 Deployment . . . 14
2.2 Request Rates and Composition . . . 15
2.2.1 Request Rates . . . 15
2.2.2 Request Size . . . 16
2.2.3 Request Composition . . . 17
2.2.4 Discussion . . . 19
2.3.1 Sources of Misses . . . 21
2.3.2 Temporal Locality Measures . . . 23
2.4 Related Work . . . 26
2.4.1 Cache Replacement Policies . . . 26
2.4.2 Web Cache . . . 27
2.4.3 KV Stores . . . 27
Chapter 3 Building a Key-value Cache to be Energy-efficient . . . . 29
3.1 Introduction . . . 29
3.2 The Design ofHippos . . . 32
3.2.1 Targeted Workloads . . . 32
3.2.2 Locating the Position to Hook Hippos in . . . 33
3.2.3 Removal of the Second Bottleneck . . . 38
3.2.4 Handling TCP packets . . . 40
3.2.5 Distribution of workload among cores . . . 41
3.2.6 Reuse of sk buff . . . 42
3.3 Effectiveness of Hippos . . . 42
3.3.1 Identifying Peak Throughput . . . 44
3.3.2 Reducing Memory Operations . . . 45
3.3.3 Mixing GETs with SETs . . . 47
3.3.4 Replaying Facebook’s Traces . . . 48
3.4 Related Work . . . 51
3.4.1 Optimization of Memcached . . . 52
3.4.2 Moving Applications into the kernel . . . 53
3.4.4 Netfilterhooks . . . 54
3.4.5 Reuse of sk buff . . . 55
Chapter 4 Conclusions and Future Work . . . 56
4.1 Conclusions . . . 56 4.2 Future Directions . . . 58 References . . . 60 Abstract . . . 69 Autobiographical Statement. . . 71 v
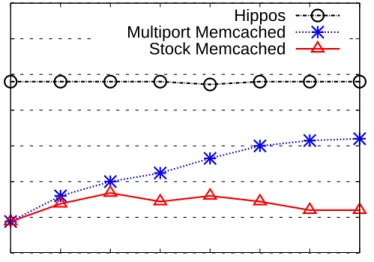
Figure 1.1 Peak throughput of Memcacheds in terms of requests per second with different number of enabled cores. In the figure,Stock Mem-cached refers to the open-source Memcached running as an ap-plication on Linux; Multiport Memcached refers to the optimized
Memcached with multiport support. Hipposrefers to the proposed in-kernel KV-cache implementation. . . 5
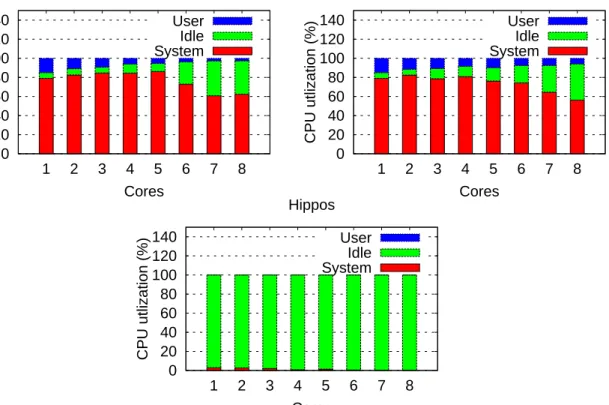
Figure 1.2 CPU time distribution on user-level code, kernel (system) code and being idle when one of three Memcached’ implementations runs with various number of cores at their respective peak through-out. . . 6
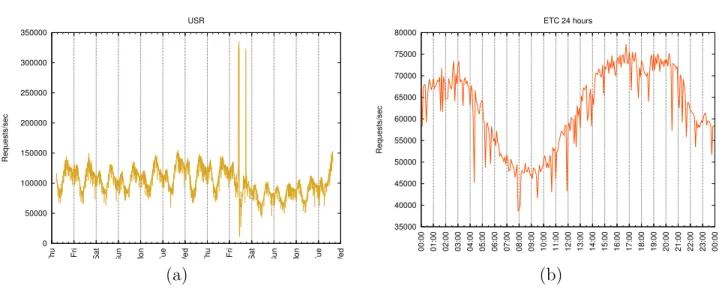
Figure 2.1 (a) Request rates at different days (USR) and (b) times of day (ETC, Coordinated Universal Time—UTC). Each data point counts the total number of requests in the preceding second. . . 16
Figure 2.2 Key and value size distributions for all traces. The leftmost cumu-lative distribution function (CDF) shows the sizes of keys, up to
Memcached’s limit of 250B (not shown). The center plot similarly shows how value sizes distribute. The rightmost CDF aggregates value sizes by the total amount of data they use in the cache, so for example, values under 320B or so in SM use virtually no space in the cache; 320B values weigh around 8% of the data, and values close to 500B take up nearly 80% of the entire cache’s allocation for values. . . 18
Figure 2.3 Distribution of request types per pool, over exactly 7 days. UP-DATE commands aggregate all non-DELETE writing operations. 18
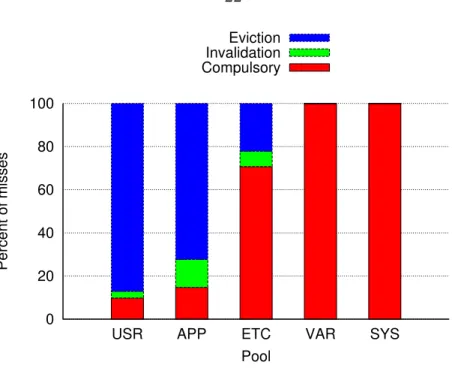
Figure 2.4 Distribution of cache miss causes per pool. . . 22
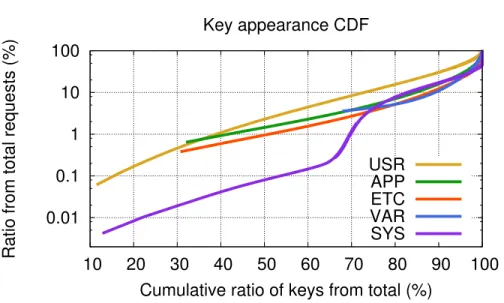
Figure 2.5 CDF of key appearances, depicting how many keys account for how many requests, in relative terms. Keys are sorted from least popular to most popular. . . 24
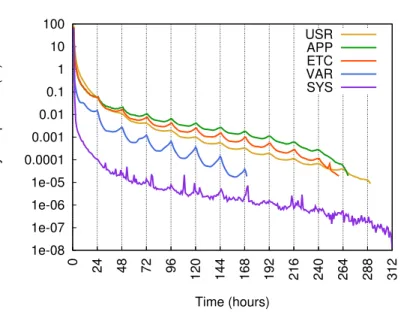
keys that were first requestednhours after their latest appearance. Keys can add counts to multiple bins if they occur more than twice. 25
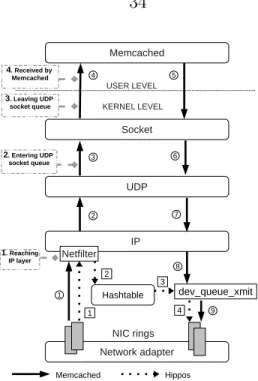
Figure 3.1 The paths for a UDP GET request to travel in the network stack and Memcached (or respectively Hippos). . . 34
Figure 3.2 Latency observed at various observation positions in the network stack with different request arrival rates and one core in use. The latency of a packet is measured as the duration between when it is received (netif receive skb()) and when it reaches a particular observation position. Note that the Y axis is on the logarithmic scale. . . 36
Figure 3.3 CPU utilization at various observation positions in the network stack with different request arrival rates when one core is in use. 37
Figure 3.4 Memcached throughput (number of GETs processed per second) under various GET request arrival rates. The GET requests ar-rive either in the one-request-in-a-packet format (GET) or in the multiple-requests-in-a-packet format (MGET). For MGET, the packet arrival rate is 320K packets per second, and we change the number of requests in a packet. The lock may be applied (LOCK) or not (NOLOCK). . . 38
Figure 3.5 Request latencies for Memcached and Hippos with increasing re-quest arrival rate in the 1Gbps network (a) and in the 10Gbps net-work (b). For each system, latencies for a low-cost setup (LOW-COST) are also reported, in which requests are for non-existent keys in a hash table not protected by locks. . . 44
Figure 3.6 Request latencies for Hippos with and without using the sk buff
reuse optimization when the request arrival rate increases. . . . 46
Figure 3.7 Latencies for workloads with different mixes of GETs and SETs and different request rates. . . 46
Figure 3.8 Peak throughput received by Memcached and Hippos for each of the five Facebbok’s traces. The throughput is collected under the condition
that the corresponding average request latency does not exceed 1ms. 50
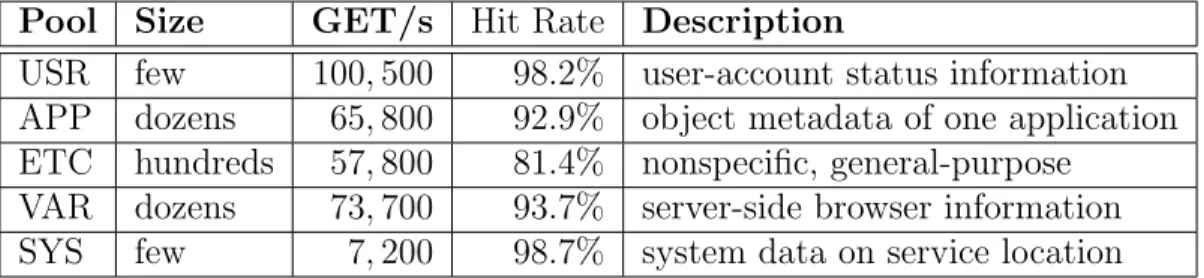
Table 2.1 Memcached pools sampled (in one cluster), including their typical deployment sizes, read request rates, and average hit rates. The pool names do not match their UNIX namesakes, but are used for illustrative purposes here instead of their internal names. . . 14
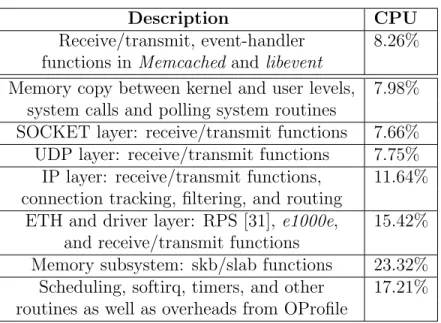
Table 3.1 Distribution of the CPU cycles in different categories of functions at the user level (first row) and at the kernel level (other rows) during the execution ofMultiport Memcached. . . 30
Table 3.2 The observation positions . . . 35
Table 3.3 Distribution of request types in the Facebook traces: GET, UP-DATE, and DELETE. SET belongs to the UPDATE category, which also includes REPLACE and other non-DELETE writing operations. . . 48
Table 3.4 Average request latency and power consumption of Memcached, and respective changes made byHippos in percentage for the five traces with the 1Gbps and 10Gbps networks (only 10Gbps ex-plicitly indicated). Latency larger than 1ms is denoted by ”-”. If Memcached’s latency is denoted as ”-”, Hippos’s counterpart is represented by its actual latency value, instead of a change in percentage. . . 49
Chapter 1: Introduction
Contemporary large-scale websites have to store and process very large amounts of data. To provide timely service to their users, many Internet products have adopted a simple but effective caching infrastructure atop the conventional databases that store these data, called key-value (KV) stores. Examples include Voldermort [57] at LinkedIn, Cassandra [27] at Apache, and Memcached [1, 52] at Facebook. A common use case for these systems is that they store and supply information that is cheaper or faster to cache than to re-obtain, such as commonly accessed results of database queries or the results of complex computations that require temporary storage and distribution [52]. In a KV cache system, data are organized in ordered (key, value) pairs, in which value is the data that are stored by user and key is the unique identification for user to operate data correspondingly. The KV cache interface usually provides primitives similar to those for a regular hash table, such as insertion (SET), retrieval (GET), and deletion (DEL). Clients use consistent hashing [19] on a key to locate the server that owns the requested data.
As an essential component in a datacenter’s infrastructure, the KV cache is care-fully designed for low response times, high hit rate, and low power consumption. To be effective, these efforts require a detailed understanding of realistic KV workloads on which the performance of KV caches are highly dependent. This dissertation first presents a workload study of a large-scale KV cache that runs at Facebook, revealing access patterns from various perspectives in detail. Our study also shows that current KV cache implementations grow increasingly CPU-bound, leading to under-utlization
of network bandwidth and poor energy efficiency. Based on this study, we propose a high-throughput, low-latency, and energy-efficient KV cache implementation, which moves the KV cache into the operating system’s kernel and thus removes most of the overhead associated with network stack and system calls.
In this chapter, we describe the motivation of this dissertation and present its contributions.
1.1
Motivation
Key-value (KV) stores play a critical role of caching in the improvement of service quality and user experience in many large-scale websites [1, 52, 27]. Be a high-throughput distributed cache layer, KV caches have received significant research and industry attention recently [52, 65]. In a KV cache, the data is usually cached in the DRAM memory of a server and is retrieved in response to network requests for it. Often, there are a large number of servers deployed to form a single memory pool, allowing a cache for a large data set with high request rate. One example is Facebook, which uses a very large number of Memcached servers supplying many terabytes of memory to the clients over the network [10, 52].
1.1.1
Demand on Study of Workloads’ Characteristics
Because many data requests exhibit some form of locality, allowing a popular subset of data to be identified and predicted, a substantial amount of database oper-ations can be replaced by quick in-memory lookups, for significantly reduced response time. To provide this performance boost, KV caches are carefully tuned to minimize response times and maximize the probability of caching request data (or hit rate). But like all caching heuristics, a KV-cache’s performance is highly dependent on its
workload. It is therefore essential to understand the workload’s characteristics in order to understand and improve the cache’s design.
In addition, analyzing such workloads can: offer insights into the role and effec-tiveness of memory-based caching in distributed website infrastructure; expose the underlying patterns of user behavior; and provide difficult-to-obtain data for future studies. But many such workloads are proprietary and hard to access, especially those of very large-scale. Such analyses are therefore rare and the workload characteristics are usually assumed in academic research and system design without substantial sup-port from empirical evidence. This dissertation work aims to provide this supsup-port. To this end, we have collected detailed traces from Facebook’sMemcached [1] deploy-ment, arguably the world’s largest. The analysis details many characteristics of the caching workload, it also reveals a number of surprises: a GET/SET ratio of 30:1 that is higher than assumed in the literature; some applications behave more like persistent storage than a cache; and strong locality metrics, such as keys accessed many millions of times a day.
1.1.2
KV Cache: A CPU-demanding Application
KV caches are designed to trade off DRAM capacity for reduced computation time, and are used as a distributed hash table to store (key, value) pairs. Intuitively, only minimal computation, or a minimum number of CPU cycles, should be required to look up and possibly modify a hash table datum. In that case, a low-power processor with a few cores, combined with large DRAM memory, could suffice to service a heavy request load with low latency. As such, the acquisition and energy costs of the CPU in a KV-cache server in a cluster specialized for in-memory data caching could be significantly lower than that of a general-purpose cluster [14].
To investigate whether the KV cache is indeed bottlenecked by its CPU, we chose
Memcached as an experimental representative, as its variants are used in major web-sites, including Facebook, Twitter, Youtube, and Wikipedia. We used a request pattern similar to what we observed at Facebook, one of the world’s largest Mem-cacheddeployments [10]. As reported in Chapter 2, the ratio of GET to SET requests can be very high, sometimes exceeding 30:1. The key size is typically smaller than 30 Bytes, and more than half of the value sizes can be smaller than 20 Bytes in some traces. Additionally, Our examination of the Facebook traces indicates that GET re-quests use the faster UDP protocol instead of TCP, consistent with what is reported on optimization efforts onMemcached at Facebook [52]. To evaluate CPU usage, we set up eight hosts, each running four Memcached clients that continually sent asyn-chronous UDP GET requests to oneMemcachedserver, using 64-Byte request packets on the 1Gbps network. All machines used an Intel 8-core Xeon processor (more sys-tem details in Section 3.3). As in the rest of the dissertation, peak throughput is reported as the highest throughput observed while the corresponding mean request latency is kept under 1ms, where a request’s latency is measured by the client as total round-trip time.
We use the latest open-sourceMemcachedversion [1], which is referred to asStock Memcachedhereafter, to investigate whetherMemcached is CPU demanding and how the CPU cycles are spent. We also made efforts within the application to minimize the chance forMemcachedto be a CPU-demanding one. We disabled the lock on the hash table∗and replaced the LRU algorithm with the lock-free CLOCK replacement policy. As it is well known that having multiple threads to access one UDP socket can cause
∗Because we send only GET requests in this experiment, removal of the lock does not compromise
serious socket lock contention [52], possibly rendering the application CPU-bound, we modified Memcached so that each of its threads listens exclusively on its own UDP port to alleviate this contention, much like the optimization done at Facebook [52]. This improved Memcached is referred to as Multiport Memcached, which shares the same benefits as of running multiple Memcached instances, each on a separate core and on its exclusive network port [15].
0 100 200 300 400 500 600 700 1 2 3 4 5 6 7 8
Peak throughput (Requests/sec x 1000)
Cores
Hippos Multiport Memcached Stock Memcached
Figure 1.1: Peak throughput of Memcacheds in terms of requests per second with different number of enabled cores. In the figure,Stock Memcached refers to the open-source Memcached running as an application on Linux; Multiport Memcached refers to the optimized Memcached with multiport support. Hippos refers to the proposed in-kernel KV-cache implementation.
Figure 1.1 shows measured peak throughput, in terms of number of requests per second, with various number of cores. When the core count increases from one to three, both Stock Memcached and Multiport Memcached increase their throughput. This suggests thatMemcached’s performance is probably constrained by the CPU; in
other words,Memcachedrequires more CPU cores to unlock its performance potential. When the CPU core count increases beyond three, Stock Memcached’s throughput begins to plateau and even drops off due to lock contention within the kernel network stack. In contrast, with multiple sockets Multiport Memcached sees its throughput still climbing, albeit at a slower rate. This observation may lead to the conclusion that Multiport Memcached is scalable on multicore CPUs without major changes to the kernel [15]. However, this may also demonstrate that the demand on CPU cores does not saturate 1Gbps network card even with all eight cores enabled.
0 20 40 60 80 100 120 140 1 2 3 4 5 6 7 8 CPU utlization (%) Cores Stock Memcached User Idle System 0 20 40 60 80 100 120 140 1 2 3 4 5 6 7 8 CPU utlization (%) Cores Multiport Memcached User Idle System 0 20 40 60 80 100 120 140 1 2 3 4 5 6 7 8 CPU utlization (%) Cores Hippos User Idle System
Figure 1.2: CPU time distribution on user-level code, kernel (system) code and being idle when one of three Memcached’ implementations runs with various number of cores at their respective peak throughout.
kernel-level (system) functions, or when the CPU is idle. We can see that most of CPU time is spent in the kernel for bothStock Memcachedand Multiport Memcached. This is expected as the computation within the application is indeed minimal. With the increase in core count, the user-time percentage forStock Memcachedis reduced more significantly than that for Multiport Memcached. This is consistent with Multiport Memcached’s higher peak throughput at higher core count. Accompanied with the reduction of user time is the increase of idle time. In the experiments for obtaining peak throughput, we did not push the throughput to its limit and allow idle CPU time so that the latency is maintained below the 1ms threshold. Figure 1.2 shows that system time accounts for significant percentage of CPU time, from 55% to 85%, depending on core count. This time is mostly spent on the Linux network stack. In Linux, a spinlock is used for exclusive access of the socket buffer queue(s). With only one queue, Stock Memcachedcontends heavily for the lock, resulting in wasted CPU cycles. By having multiple socket queues, fewer CPU cycles are used for spinning, leading to more productive packet processing and higher peak throughput inMultiport Memcached.
Considering the percentages of CPU times used in both user and system levels,
Memcached turns out to be a CPU-demanding application. As such, a KV cache can have increased request latency and limited peak throughput if the CPU is not sufficiently powerful. It is also prone to creating bottlenecks on the request processing path, such as contention on various queue locks in the network stack. Yet another consequence is high power consumption, which can be a critical issue in data centers.
1.2
Thesis Contributions
1.2.1
Characterizing Facebook’s
Memcached
Workload
This dissertation discusses five workloads from Facebook’s Memcached deploy-ment. Aside from the sheer scale of the site and data (over 284 billion requests over a period of 7 sample days), this case study also provides a description of several different usage scenarios for KV caches. This variability serves to explore the rela-tionship between the cache and various data domains: where overall site patterns are adequately handled by a generalized caching infrastructure, and where specialization would help. In addition, this work offers the following key contributions and findings:
1. A workload decomposition of the traces that shows how different applications of Memcached can have extreme variations in terms of read/write mix, request sizes and rates, and usage patterns.
2. An analysis of the caching characteristics of the traces and the factors that determine hit rates. We found that different Memcached pools can vary signifi-antly in their locality metrics, but surprisingly, the best predictor of hit rates is actually the pool’s size.
3. An examination of various performance metricsre over time, showing diurnal and weekly patterns and their correlation to social networking. For example, we found that some load spikes (up to 10% hit rate change) can improve key locality and hit rate if the requested content is limited and static, thus helping to absorb the higher request rate. On the other hand, load spikes on varied keys or keys that are invalidated frequently actually hurt cache performance.
4. An exposition of a Memcached deployment that can shed light on real-world, large-scale production usage of KV-stores.
1.2.2
Hippos
: A Light-weight and Energy-efficient Appliance
A KV cache uses dedicated servers, each configured with large memory and often a low-power processor, to form a large memory pool. It typically runs in a controlled environment (e.g., data centers) and its sole purpose is to provide caching service to other application servers. The objective of this dissertation is to build the KV cache as a data-center appliance with high performance and high energy efficiency. The method is to move it into the kernel in a position close to the NIC, so that it can directly take IP packets for the KV cache and process themin situ. Without concern of impacting other applications or any components in the network stack, this approach can remove most time-consuming network operations out of the KV-cache’s critical processing path, including acquisition of exclusive access to UDP socket queues, data copies, scheduling and context switching associated with event notification.
We describeHippos, a KV cache that uses a hook provided in the Netfilter frame-work [2] to directly unpack a completeMemcached UDP request before it is inserted into its corresponding socket’s receive buffer queue. Subsequently, the request is im-mediately processed and the response is sent back to the device driver. Thus,Hippos
can provide clients with a single UDP port without even setting up a UDP socket. Accordingly, the overhead for system calls, event notifications (via libevent), socket locks, and most of the overheads in the UDP and IP layers are eliminated.
In summary we make the following contributions in this dissertation:
1. We show that a KV cache running at the user level is CPU-demanding, spending significant portion of its processing time in the kernel.
2. We propose Hippos to bypass most of the operations for a UDP-based request on its path from the NIC to the user-level Memcached and for the correspond-ing reply request to reach the NIC. With this bypasscorrespond-ing, the bottleneck on the network stack is removed. Such removal exposes another bottleneck, namely the one caused by the lock contention within Memcached. Accordingly, we ap-plied the Read-Copy-Update (RCU) lock [67] and the lock-free CLOCK cache replacement algorithm inHippos to substantially alleviate the performance im-pact of this lock contention.
3. We have implementedHipposas a loadable Linux kernel module and extensively evaluated it on a recent Linux Kernel with micro-benchmarks and request traces taken from production systems at Facebook. The results show thatHippos can achieve 20–200% throughput improvements on a 1Gbps network (up to 590% improvements on a 10Gbps network) and 5–20% energy saving.
4. This work demonstrates that in the context of improving the performance and energy efficiency of data-center infrastructure, migrating network-intensive ap-plications to the right positions in the kernel and running them as appliances is a viable and promising approach. Many prior projects on migrating applica-tions into the kernel (see Section 3.4) faced challenges such as system security, reliability, and engineering efforts. Nevertheless, our experience shows that in the era of cloud computing, this approach can meet these challenges and gain significant advantages by turning a KV service into an appliance on the network.
1.3
Dissertation Organization
In Chapter 2, we begin with describingMemcached’s software architecture and its deployment at Facebook. Then we present the workload characteristics in terms of request rates, request size, and request composition. We also discuss cache effective-ness from the perspectives of sources of misses and temporal locality measures. We summarize the related work of workload analysis in the last section.
In Chapter 3, we first overview existing approaches that could improve the per-formance of Memcached. Then we give an extensive examination on CPU cycles consumption of Memcached under Facebook’s workloads, and expose the appropri-ate positon in the kernel where we can build a high-performance KV cache system without involving additional modifications to the existing system. We demonstrate design details of Hippos, and evaluate it against Memcached by using various micro-benchmarks and workloads from Facebook’s production system.
Chapter 2: Characterizing Facebook’s
Mem-cached
Workload
2.1
Introduction
Many Web services such as social networks, email, maps, and retailers must store large amounts of data and retrieve specific items on demand very quickly. Facebook, for example, stores basic profile information for each of its users, as well as content they post, individual privacy settings, etc. When a user logs in to Facebook’s main page and is presented with a newsfeed of their connections and interests, hundreds or thousands of such data items must be retrieved, aggregated, filtered, ranked, and presented in a very short time. The total amount of potential data to retrieve for all users is so large that it is impractical to store an entire copy locally on each web server that takes user requests. Instead, we must rely on a distributed storage scheme, wherein multiple storage servers are shared among all Web servers
The persistent storage itself takes place in the form of multiple shards and copies of a relational database, such as MySQL. MySQL has been carefully tuned to maximize throughput and lower latency for high loads, but its performance can be limited by the underlying storage layer, typically hard drives or flash. The solution is caching— the selective and temporary storage of a subset of data on faster RAM. Caching works when some items are much more likely to be requested than others. By provi-sioning enough RAM to cache the desired amount of popular items, we can create a customizable blend of performance and resource tradeoffs.
largest KV deployments. We look at server-side performance, request composition, caching efficacy, and key locality. These observations lead to several design insights and new research directions for KV caches, such as the relative inadequacy of the least-recently-used replacement policy. But first, we describe how a KV cache such as Memcached is used in practice.
2.1.1
Software Architecture
Memcached is an open-source software package that exposes data in RAM to clients over the network. As data size grows in the application, more RAM can be added to a server, or more servers can be added to the network. Additional servers generally only communicate with clients. Clients use consistent hashing [19] to select a unique server perkey, requiring only the knowledge of the total number of servers and their IP addresses. This technique presents the entire aggregate data in the servers as a unified distributed hash table, keeps servers completely independent, and facilitates scaling as data size grows.
Memcached’s interface provides the basic primitives that hash tables provide, as well as more complex operations built atop them. The two basic operations areGET, to fetch the value of a given key, andSET to cache a value for a given key (typically after a previous GET failure, since Memcached is used as a look-aside, demand-filled cache). Another common operation for data backed by persistent storage is to
DELETE a KV pair as a way to invalidate the key if it was modified in persistent storage. To make room for new items after the cache fills up, older items are evicted using the least-recently-used (LRU) algorithm [13].
Pool Size GET/s Hit Rate Description
USR few 100,500 98.2% user-account status information APP dozens 65,800 92.9% object metadata of one application ETC hundreds 57,800 81.4% nonspecific, general-purpose
VAR dozens 73,700 93.7% server-side browser information SYS few 7,200 98.7% system data on service location
Table 2.1: Memcached pools sampled (in one cluster), including their typical deploy-ment sizes, read request rates, and average hit rates. The pool names do not match their UNIX namesakes, but are used for illustrative purposes here instead of their internal names.
2.1.2
Deployment
Physically, Facebook deploys front-end servers in multiple datacenters, each con-taining one or more clusters of varying sizes. Front-end clusters consist of both Web servers and caching servers, including Memcached. These servers are further sub-divided based on the concept of pools. A pool defines a class of Memcached keys. Pools are used to separate the total possible key space into buckets, allowing better efficiency by grouping keys of a single application, with similar access patterns and data requirements. Any given key will be uniquely mapped to a single pool by the key’s prefix, which identifies an application.
We analyzed one trace each from five separate pools. These pools represent a varied spectrum of application domains and cache usage characteristics (Table 2.1). We traced allMemcached packets on these servers using a custom kernel module [10] and collected between 3T B to 7T B of trace data from each server, representing at least a week’s worth of consecutive samples. All five Memcached instances ran on identical hardware.
2.2
Request Rates and Composition
2.2.1
Request Rates
Many companies rely on Memcached to serve terabytes of data in aggregate ev-ery day, over many millions of requests. Average sustained request rates can reach 100,000+ requests per second, as shown in Table 2.1. These request rates repre-sent relatively modest network bandwidth. But Memcached’s performance capacity must accommodate significantly more headroom than mean sustained rates. Fig-ure 2.1(a) shows that in extreme cases for USR, the transient request rate can more than triple the sustained rate. These outliers stem from a variety of sources, including high transient interest in specific events, highly popular keys on individual servers, and operational issues. Consequently, when analyzing Memcached’s performance, we focus on sustained end-to-end latency and maximum sustained request rate (while meeting latency constraints), and not on network bandwidth [13].
Figure 2.1 also reveals howMemcached’s load varies normally over time. USR’s 13-day trace shows a recurring daily pattern, as well as a weekly pattern that exhibits a somewhat lower load approaching the weekend. All other traces exhibit similar daily patterns, but with different values and amplitudes. If we zoom in on one day for ETC for example (righthand figure), we notice that request rates bottom out around 08:00 UTC and have two peaks around 17:00 and 03:00. Although different traces (and sometimes even different days in the same trace) differ in which of the two peaks is higher, the entire period between them, representing the Western Hemisphere daytime, exhibits the highest traffic volume.
0 50000 100000 150000 200000 250000 300000 350000
Thu Fri Sat Sun Mon Tue Wed Thu Fri Sat Sun Mon Tue Wed
Requests/sec USR 35000 40000 45000 50000 55000 60000 65000 70000 75000 80000 00:00 01:00 02:00 03:00 04:00 05:00 06:00 07:00 08:00 09:00 10:00 11:00 12:00 13:00 14:00 15:00 16:00 17:00 18:00 19:00 20:00 21:00 22:00 23:00 00:00 Requests/sec ETC 24 hours (a) (b)
Figure 2.1: (a) Request rates at different days (USR) and (b) times of day (ETC, Coordinated Universal Time—UTC). Each data point counts the total number of requests in the preceding second.
2.2.2
Request Size
Next, we turn our attention to the sizes of keys and values in each pool ( Figure 2.2) for SET requests (GET requests have identical sizes for hits, and zero data size for misses). All distributions show strong modalities. For example, over 90% of APP’s keys are 31 bytes long, and values sizes around 270B show up in more than 30% of SET requests. USR is the most extreme: it only has two key size values (16B and 21B) and virtually just one value size (2B). Even in ETC, the most heterogeneous of the pools, requests with 2-, 3-, or 11-byte values add up to 40% of the total requests. On the other hand, it also has a few very large values (around 1M B) that skew the weight distribution (rightmost plot in Figure 2.2), leaving less caching space for smaller values. Small values dominate all workloads, not just in count, but especially in overall weight. Except for ETC, 90% of allMemcached’s data space is allocated to
values of less than 500B.
2.2.3
Request Composition
Last, we look at the composition of basic request types that comprise the workload ( Figure 2.3) and make the following observations:
USR handles significantly more GET requests than any of the other pools (at an approximately 30 : 1 ratio). GET operations comprise over 99.8% of this pool’s workload. One reason for this is that the pool is sized large enough to maximize hit rates, so refreshing values is rarely necessary. These values are also updated at a slower rate than some of the other pools. The overall effect is that USR is used more like RAM-based persistent storage than a cache.
APP has high absolute and relative GET rates too—owing to the popularity of this application. But also has a large number of DELETE operations, which occur when a cached database entry is modified (but not required to be set again in the cache). SET operations occur when the Web servers add a value to the cache. The relatively high number of DELETE operations show that this pool represents database-backed values that are affected by frequent user modifications.
ETC has similar characteristics to APP, but with a higher fraction of DELETE requests (of which not all are currently cached, and therefore miss). ETC is the largest and least specific of the pools, so its workloads might be the most representative to emulate.
VAR is the only pool of the five that is write-dominated. It stores short-term val-ues such as browser-window size for opportunistic latency reduction. As such,
0 0.2 0.4 0.6 0.8 1 0 20 40 60 80 100
Key size (bytes) Key size CDF by appearance
USR APP ETC VAR SYS 0 0.2 0.4 0.6 0.8 1 1 10 100 1000 10000 100000 1e+06 Value size (bytes)
Value Size CDF by appearance
USR APP ETC VAR SYS 0 0.2 0.4 0.6 0.8 1 1 10 100 1000 10000 100000 1e+06 Value size (bytes)
Value size CDF by total weight
USR APP ETC VAR SYS
Figure 2.2: Key and value size distributions for all traces. The leftmost cumulative distribution function (CDF) shows the sizes of keys, up to Memcached’s limit of 250B (not shown). The center plot similarly shows how value sizes distribute. The rightmost CDF aggregates value sizes by the total amount of data they use in the cache, so for example, values under 320B or so in SM use virtually no space in the cache; 320B values weigh around 8% of the data, and values close to 500B take up nearly 80% of the entire cache’s allocation for values.
USR n = 60.7 B GET UPDATE DELETE APP n = 39.5 B GET UPDATE DELETE ETC n = 30.0 B GET UPDATE DELETE VAR n = 44.6 B GET UPDATE SYS n = 4.4 B GET UPDATE
Figure 2.3: Distribution of request types per pool, over exactly 7 days. UPDATE commands aggregate all non-DELETE writing operations.
these values are not backed by a database (hence, no invalidating DELETEs are required). But they change frequently, accounting for the high number of UPDATEs.
SYS is used to locate servers and services, not user data. As such, the number of requests scales with the number of servers, not the number of user requests, which is much larger. This explains why the total number of SYS requests is much smaller than the other pools’.
2.2.4
Discussion
We found that Memcached requests exhibit clear modality in request sizes, with a strong bias for small values. We also observed temporal patterns in request rates that are mostly predictable and require low bandwidth, but can still experience very significant outliers of transient high load. There are several implications for cache design and system optimizations from these data:
1. Network overhead in the processing of multiple small packets can be substantial relative to payload, which explains why Facebook coalesces as many requests as possible in as few packets as possible [13].
2. Memcached allocates memory for KV values in slabs of fixed size units. The strong modality of each workload implies that different Memcached pools can optimize memory allocation by modifying the slab size constants to fit each distribution. In practice, this is an unmanageable and unscalable solution, so instead Memcached uses 44 different slab classes with exponentially growing sizes to reduce allocation waste, especially for small sizes. This does, however, result in some memory fragmentation.
3. The ratio of GETs to UPDATEs in ETC can be very high—significantly higher in fact than most synthetic workloads typically assume. For demand-filled caches where each miss is followed by an UPDATE, the ratios of GET to UP-DATE operations mentioned above are related to hit rate in general and the relative size of the cache to the data in particular. So in theory, one could jus-tify any synthetic GET to UPDATE mix by controlling the cache size. But in practice, not all caches or keys are demand-filled, and these caches are already sized to fit a real-world workload in a way that successfully trades off hit rates to cost.
These observations on the nature of the cache lead naturally to the next question (and section): how effective is Memcached at servicing its GET workload—itsraison d’ˆetre.
2.3
Cache Effectiveness
Understanding cache effectiveness can be broken down to the following questions: how well does Memcached service GET requests for the various workloads? What factors affect good cache performance? What characterizes poor cache performance, and what can we do to improve it?
The main metric used in evaluating cache efficacy is hit rate: the percentage of GET requests that return a value. Hit rate is determined by three factors: available storage (which is fixed, in our discussion); the patterns of the underlying workload and their predictability; and how well the cache policies utilize the available space and match these patterns to store items with a high probability of recall. Understanding the sources of misses will then offer insights into why and when the cache wasn’t able
to predict a future item. We then look deeper into the workload’s statistical properties to understand how amenable it is to this prediction in the first place. The overall hit rate of each server, as derived from the traces and verified with Memcached’s own statistics, are shown in Table 2.1.
SYS and USR exhibit very high hit rates. Recall from that same table that these are also the smallest pools, so the entire keyspace can be stored with relatively few resources, thus eliminating all space constraints from hit rates. Next down in hit-rate ranking are APP and VAR, which are larger pools, and finally, ETC, the largest pool, also exhibits the lowest hit rate. So can pool size completely explain hit rates? Is there anything we could do to increase hit rates except buy more memory? To answer these questions, we take a deeper dive into workload patterns and composition.
2.3.1
Sources of Misses
To understand hit rate, it is instructive to analyze its complement, miss rate, and specifically to try to understand the sources for cache misses. These sources can tell us if there are any latent hits that can still be exploited, and possibly even how.
We distinguish three types of misses:
• Compulsory misses are caused by keys that have never been requested before (or at least not in a very long time). In a demand-filled cache with no prefetching like Memcached, no keys populate the cache until they have been requested at least once, so as long as the workload introduce new keys, there is not much we can do about these misses.
• Invalidation misses occur when a requested value had been in the cache before,
0 20 40 60 80 100
USR APP ETC VAR SYS
Percent of misses
Pool Eviction Invalidation Compulsory
Figure 2.4: Distribution of cache miss causes per pool.
• Eviction (capacity) misses represent keys that had been in the cache, but were
evicted by the replacement policy before the next access. If most misses are of this kind, then indeed the combination of pool size and storage size can explain hit rates.
Several interesting observations can be made. The first is that VAR and SYS have virtually 100% compulsory misses. Invalidation misses are absent because these pools are not database-backed, and eviction misses are nearly non-existent because of ample space provisioning. Therefore, keys are invariably missed only upon the first request, or when new keys are added.
On the opposite end, about 87% of USR’s misses are caused by evictions. This is puzzling, since USR is the smallest of pools, enabling sufficient RAM provisioning to cover the entire key space. This larger percentage of eviction misses originates from service jobs that request sections of the key space with little discernible locality, such
as data validation or migration to a new format. So the cache replacement policy has little effect in predicting future key accesses to these keys and preventing eviction misses.
At last we come to ETC and APP, the two largest pools, with 22% and 72% eviction misses, respectively. One straightforward measure to improve hit rates in these two pools would be to increase the total amount of memory in their server pool, permitting fewer keys to be evicted. But this solution obviously costs more money and will help little if the replacement policy continues to accumulate rarely used keys. A better solution would be to improve the replacement policy to keep valuable items longer, and quickly evict items that are less likely to be recalled soon. To understand whether alternative replacement policies would better serve the workload patterns, we next examine these patterns in terms of their key reuse over time, also known as temporal locality.
2.3.2
Temporal Locality Measures
We start by looking at how skewed is the key popularity distribution, measured as a ratio of each key’s GET requests from the total ( Figure 2.5). All workloads exhibit long-tailed popularity distributions. For example, 50% of ETC’s keys (and 40% of APP’s) occur in no more than 1% of all requests, meaning they do not repeat many times, while a few popular keys repeat in millions of requests per day. This high concentration of repeating keys is what makes caching economical in the first place. SYS is the exception to the rule, as its values are cached locally by clients, which could explain why some 65% of its keys hardly repeat at all.
We can conceivably use these skewed distributions to improve the replacement policy: By evicting unpopular keys sooner, instead of letting them linger in memory
0.01 0.1 1 10 100 10 20 30 40 50 60 70 80 90 100
Ratio from total requests (%)
Cumulative ratio of keys from total (%) Key appearance CDF USR APP ETC VAR SYS
Figure 2.5: CDF of key appearances, depicting how many keys account for how many requests, in relative terms. Keys are sorted from least popular to most popular.
until expired by LRU, a full cycle of insertions later, we could leave room for more popular keys, thus increasing hit rate. For example, about a fifth of all of APP’s and ETC’s keys are only requested at most once in any given hour. The challenge is telling the two classes of keys apart, when we don’t have a-priori knowledge of their popularity.
One clue to key popularity can be measured in reuse period—the time between consecutive accesses to the key. Figure 2.6 counts all key accesses and bins them according to the time duration from the previous access to each key. Unique keys (those that do not repeat at all within the trace period) are excluded from this count. The figure shows that key repeatability is highly localized and bursty, with some daily patterns (likely corresponding to some users always logging in at the same time of
1e-08 1e-07 1e-06 1e-05 0.0001 0.001 0.01 0.1 1 10 100 0 24 48 72 96 120 144 168 192 216 240 264 288 312
Total keys requested (%)
Time (hours) USR APP ETC VAR SYS
Figure 2.6: Reuse period histogram per pool. Each hour-long bin n counts keys that were first requested n hours after their latest appearance. Keys can add counts to multiple bins if they occur more than twice.
day). For the ETC trace, for example, 88.5% of the keys are reused within an hour, but only 4% more within two, and within six hours 96.4% of all non-unique keys have already repeated. The main takeaway from this chart is that reuse period decays at an exponential rate. This implies diminishing returns to a strategy of increasing memory resources beyond a certain point, because if we can already cache most keys appearing in a given time windows, and double it with twice the memory capacity, only a shrinking fraction of the keys that would have otherwise been evicted would repeat again in the new, larger time window.
As before, the SYS pool stands out. It doesn’t show the same 24-hour periodicity as the other pools, because its keys relate to servers and services, not users. It also decays faster than the others. Again, since its data are cached locally by clients, it is likely that most of SYS’s GET requests represent data that are newly available, updated, or expired from the client cache; these are then requested by many clients
concurrently. This would explain why 99.9% of GET requests are repeated within an hour of the first key access. Later, such keys would be cached locally and accessed rarely, perhaps when a newly added client needs to fill its own cache.
2.4
Related Work
To the best of our knowledge, this is the first details description of a large-scale KV-store workload. Nevertheless, there are a number of related studies on traditional storage system, other caching systems and KV Stores that can shed light on the relevance of this work and its methodology.
2.4.1
Cache Replacement Policies
A core element of any caching system is its replacement algorithm. By analyzing the workloads’ locality, source of misses, and request sizes, our original paper [10] suggested areas where an optimized replacement strategy could help. In fact, some of these optimizations have since been reportedly implemented [52], including an adap-tive allocator to periodically rebalance the slab allocator, and the use of expiration time associated data items for early eviction of some short-lived keys.
Caching as a general research topic has been extensively studied. The LRU al-gorithm [68], which is adopted in Memcached, has been shown to have several weak-nesses, and a number of algorithms have been proposed to improve it. The 2Q algorithm was proposed to evict cold data earlier from the cache so that relatively warm data can stay longer [34]. The LRFU algorithm introduced access frequency into the LRU algorithm, to improve its replacement decisions on data with distinct access frequencies [37]. These weaknesses of LRU also show in this workload study. To address both weaknesses with an efficient implementation, Jiang and Zhang
pro-posed the LIRS algorithm to explicitly use reuse distance—in principle equivalent to the reuse period measured in this dissertation—to quantify locality and choose eviction victims [33]. The LRU algorithm requires a lock to maintain the integrity of its data structure, which can lead to a performance bottleneck in a highly contended environment such asMemcached’s. In contrast, the CLOCK algorithm [56] eliminates this need while maintaining similar performance to that of LRU. The CLOCK-Pro algorithm, which also removes this lock, has a performance as good as that LIRS’ [32].
2.4.2
Web Cache
Web caches are another area of active research. In a study of requests received by Web servers, Arlitt and Williamson found that 80% of requested documents are smaller than ≈10KB. However, requests to these documents generate only 26% of data bytes retrieved from the server [9]. This finding is consistent with the distribution we describe in [10].
2.4.3
KV Stores
KV stores are also receiving ample attention in the literature, covering aspects such as performance, energy efficiency, and cost effectiveness [13, 69, 29, 21, 22, 8, 11, 6, 20, 25]. Absent well-publicized workload traces, in particular large-scale production traces, many works used hypothetical or synthetic workloads [69]. For example, to evaluate SILT, a KV-cache design that constructs a three-level store hierarchy for storage on flash memory with a memory based index, the authors assumed a workload of 10% SET and 90% GET requests using 20B keys and 100B values, as well as a workload of 50% SET and 50% GET requests for 64B KV pairs [43]. In the evaluation of CLAM, a KV-cache design that places both hash table and data items on flash,
the authors used synthetic workloads that generate keys from a random distribution and a number of artificial workload mixes [7].
Chapter 3: Building a Key-value Cache to
be Energy-efficient
3.1
Introduction
In section 1.1.2, we presented that Memcached, which is one of the most common KV store implementation that has been wildly used in industry, is highly CPU de-manding. Figure 1.2 shows that Memcached spends most of its time in the kernel, in particular on the network stack. Due to the relevant role it plays, this suboptimal implementation leads to the performance bottlenecks on the request processing path, resulting in high service latency and high power consumption.
To investigate the distribution of CPU consumptions, we examined Multiport Memcached∗ with OProfile [5] to see how the CPU cycles are used across the network stack. Table 3.1 shows distribution of the CPU cycles among eight categories of 289 functions, which span all networking layers of the system. Among the functions, the highest percentage of cycles consumed by a single function is 3.89% and there are only 20 functions consuming more than 1% of the cycles. The CPU time is distributed more or less evenly across the user layer, SOCKET layer, UDP layer, IP layer, and ETH and device driver layers. This flat profile defeats any cost-effective attempts to pinpoint specific functions or layers to optimize. In addition, among the func-tion categories, the memory subsystem has the highest CPU percentage, and most of its functions are related to sk buff, a fundamental data structure for describing the control information used in packet handling. Since the operations on the data
Description CPU
Receive/transmit, event-handler 8.26% functions in Memcached and libevent
Memory copy between kernel and user levels, 7.98% system calls and polling system routines
SOCKET layer: receive/transmit functions 7.66% UDP layer: receive/transmit functions 7.75% IP layer: receive/transmit functions, 11.64% connection tracking, filtering, and routing
ETH and driver layer: RPS [31], e1000e, 15.42% and receive/transmit functions
Memory subsystem: skb/slab functions 23.32% Scheduling, softirq, timers, and other 17.21% routines as well as overheads from OProfile
Table 3.1: Distribution of the CPU cycles in different categories of functions at the user level (first row) and at the kernel level (other rows) during the execution of
Multiport Memcached.
structure—such as memory allocation/deallocation and modification—are required in each layer of the network stack, it is challenging to improve its performance at one layer without negative impact on other layers. Meanwhile, much effort has been spent on applications’ in-kernel implementations using the kernel TCP/UDP sockets simply to remove overhead associated with the user-kernel border [3, 44, 51, 65]. However this approach may not suffice, at least for Memcached. As shown in the table, the total percentage for the user-level functions, including libevent, is only 8.26%, and kernel functions directly related to the user level, including memory copy, system calls, and the polling routines, consume only 7.89% of the total cycles.
Although there exist many studies on the optimization of the network stack via parallelization on multicore system, such as distributing packets among CPU cores [50], reducing the number of packets using jumbo frames [18], and
mitigat-ing interrupts [36, 61], efficient parallelization of the stack remains difficult due to overhead from synchronization, cache pollution, and scheduling in the layers of the network stack in a multicore system [55, 62, 72]. To reduce overhead due to unneces-sary sharing of network control states in a multicore system, IsoStack [62] separates cores for supporting the network stack from those running applications. However,
Memcached does not consume many CPU cycles for its own, as shown in Table 3.1, and could hardly benefit from this technique. Recent work (Netmap [60]) provides applications with line-rate access to raw packets by bypassing kernel network stack supporting the TCP/UDP protocols. However, it can be hard for a general-purpose application like Memcached to take advantage of this capability and retain compati-bility with clients. Other works such asChronos[35] rely on user level networking [70] enabled by NICs exposing user-level interface to handle requests without kernel inter-vention. However, it is still a significant challenge to effectively achieve scalable access to the user-level NIC because the amount of NIC resources demanded for managing user-level connection endpoints increases linearly with the number of clients simul-taneously issuing requests [70, 45]. The number can be substantial in Memcached
service [10].
Having shown that Memcached, as a representative KV cache implementation, is CPU-bound with the network stack at high loads, we cannot readily leverage exist-ing network techniques to effectively address the issue. As the KV cache is such a critical component in today’s data center infrastructure [52], it is time to revisit the conventional wisdom that this network-intensive class of applications are improved only through optimization of the network stack.
3.2
The Design of
Hippos
Three principles guided Hippos’s design. First, it should take into account the characteristics of the KV-cache’s expected workloads. Second, it should remove a substantial amount of network-related overhead. Last, it should require minimal or even no changes to the existing kernel network framework. In this section, we describe the design ofHipposin light of these principles, starting with its expected workloads.
3.2.1
Targeted Workloads
Hippos is motivated by the suboptimal performance of Stock Memcached under realistic workloads, taken from Facebook’s workload study [10]. These workloads show a strong bias towards small requests and require that servers be provisioned to handle large traffic spikes. Below is a summary of relevant characteristics reported in the Memcached workload study.
• The ratio of the GET requests among all requests can be very high. Among the five separate caching pools, each dedicated for a different application or data domain, USR has the highest GET ratio (99.7%). The ratios for the other pools are 84% (APP), 73% (ETC), 18% (VAR), and 67% (SYS). Furthermore, all GET requests use UDP, instead of TCP, for higher efficiency.
• Small values and keys dominate GET requests. For the USR pool, there are
only two key sizes (16B and 21B) and virtually only one value size (2B). For the other four pools, APP, ETC, VAR, and SYS, the 99% percentile key sizes are 45B, 80B, 30B, and 45B, respectively. Almost all GET requests can be held in a single UDP packet. Their respective 99% percentile value sizes are 450B,
512B, 200B, and 640B. Most of the GET requests and their replies can be held in one UDP packet.
• The request traffic can quickly surge by doubling or tripling the normal peak
request rate. It has been suggested that “one must budget individual node capacity to allow for these spikes [...] Although such budgeting underutilizes resources during normal traffic, it is nevertheless imperative” [10].
Based on these workload characteristics, the design ofHipposis focused on improv-ing the performance and efficiency of processimprov-ing UDP-based GET requests, especially small ones. We believe this effort should also benefit other KV stores used in data centers supporting web-based applications in general.
3.2.2
Locating the Position to Hook
Hippos
in
While the general idea is to move the KV cache into the kernel and bring it closer the NIC, we must still identify a position in the network stack for an implementation that significantly reduces networking cost and is the least intrusive to the existing network architecture. To this end, we selected four observation positions along the traversal path ofMemcached’s requests to evaluate CPU overhead and latency for the traffic to reach these positions (see Figure 3.1). To ensure that we only account for statistics taken before a certain position is reached, we intercepted and then dropped the packets at this position. Table 3.2 describes these selected positions. Among them, position 1 is the closest to the NIC and packets are intercepted immediately before they reach the IP layer. We use Netfilter’s hook (NF INET PRE ROUTING) to obtain the packets and then drop them. Position 2 is selected immediately before UDP packets are added into the UDP socket buffer queue. To drop the packets, we open UDP socket(s) but do not read packets from them. When the socket queue is
Network adapter NIC rings IP Netfilter UDP Socket Memcached dev_queue_xmit 1. Reaching IP layer 2. Entering UDP socket queue 3. Leaving UDP socket queue Hashtable 1 2 3 4 5 6 7 8 9 USER LEVEL KERNEL LEVEL Memcached Hippos 1 2 3 4 4. Received by Memcached
Figure 3.1: The paths for a UDP GET request to travel in the network stack and
Memcached (or respectively Hippos).
filled, the subsequently arriving packets will be automatically discarded. At position 3, we use kernel-level thread(s) to pick up packets from the UDP socket buffer queue once they are notified that there are new packets inserted into the queue. Position 4 is the location conventionally used for Memcached to receive UDP packets.
In this investigation the workload is the same as that used for the experiments described in Section 1. Figure 3.3 shows that CPU utilization at various observation positions with one core. Figure 3.2 shows corresponding latency for the packets to reach these positions. In the measurement of latency, we may have to correct the skewed clocks between clients and the server as the packets are dropped on their way to theMemcached. To avoid possible errors in the correction, we chose to measure the start time of a packet when it is just received by the server (at the NIC driver). As
Position Method to intercept packet
1. Reaching IP layer via Netfilterhook
NF INET PRE ROUTING
2. Entering UDP Open the socket w/o socket queue reading requests
3. Leaving UDP Reading requests w/o sending socket queue them to Memcached
4. Received by Process in Memcached Memcached
Table 3.2: The observation positions
shown, at positions 1 and 2 the CPUs are almost all idle and the latency is minimal even when the arrival rate reaches 800K packets per second. However, at position 3, system time starts to become substantial and even dominating when the arrival rate reaches 800K packets per second, and the latency skyrockets from 10µs to over 200µs when the rate is beyond 480K packets per second. When the packets reach the user level at position 4, the system’s packet processing capacity is saturated by an arrival rate of only 320K packets per second. Note that position 4 is at only the half way of a round-trip request and reply path in Memcached. If the full path is considered, the saturation arrival rate would come much earlier, as illustrated in Figure 1.1. The experiments to run multiport Memcached on multiple cores reveal similar performance trend at these observation positions, except that higher peak throughput are observed.
A major reason why receiving packets at positions 3 and 4 is expensive is the context switch between threads placing packets into the socket buffer queue and re-trieving them out of it. Position 4 is additionally associated with overhead related to passing packets between the kernel and the user-level applications. Between positions 1 and 2, Hipposchooses the first position to intercept packets as it can leverage the
1 10 100 1000 10000 100000 80 160 320 480 640 800 Latency ( µ s) Requests/sec x 1000 1.Reaching IP layer 2.Entering UDP socket queue 3.Leaving UDP socket queue 4.Received by Memcached
Figure 3.2: Latency observed at various observation positions in the network stack with different request arrival rates and one core in use. The latency of a packet is measured as the duration between when it is received (netif receive skb()) and when it reaches a particular observation position. Note that the Y axis is on the logarithmic scale.
Netfilter framework [2] to obtain packets without any modification of the operating system. Netfilterprovides a number of hooks within the Linux network stack. These hooks can be used to register kernel modules for manipulating network packets. Hip-pos uses the NF INET PRE ROUTING hook. Although packets received from the hook are still at the IP layer, all the information needed for the KV cache is available, such as operation type, number of keys, key contents, or values. After receiving a packet, Hippos will first check it to see whether it is a UDP GET packet, and if so, whether its destination port is the one defined by the KV cache. If a packet does not satisfy both conditions, Hippos will return NF ACCEPT in its hook function to allow the packet to resume its journey in the network stack towards the upper layers,
0 20 40 60 80 100 120 140 80 160 320 480 640 800 CPU utlization (%) Requests/sec x 1000 1. Reaching IP layer User Idle System 0 20 40 60 80 100 120 140 80 160 320 480 640 800 CPU utlization (%) Requests/sec x 1000 2. Entering UDP socket queue
User Idle System 0 20 40 60 80 100 120 140 80 160 320 480 640 800 CPU utlization (%) Requests/sec x 1000 3. Leaving UDP socket queue
User Idle System 0 20 40 60 80 100 120 140 80 160 320 480 640 800 CPU utlization (%) Requests/sec x 1000 4. Received by Memcached User Idle System
Figure 3.3: CPU utilization at various observation positions in the network stack with different request arrival rates when one core is in use.
such as UDP layer†. Otherwise, Hippos retrieves the request from the packet and feeds it into the in-kernel KV cache for processing similar as that in Memcached. The query result will be sent in a packet directly from the IP layer (via function
dev queue xmit()). If the key or value cannot be held in one UDP packet, a number
0 200 400 600 800 160 320 480 640 800 GET-LOCK GET-NOLOCK 0 1000 2000 3000 640 1280 1920 2560 3200 GETs/sec x 1000 Throughput (GETs/sec x 1000) MGET-LOCK MGET-NOLOCK
Figure 3.4: Memcached throughput (number of GETs processed per second) under various GET request arrival rates. The GET requests arrive either in the one-request-in-a-packet format (GET) or in the multiple-requests-one-request-in-a-packet format (MGET). For MGET, the packet arrival rate is 320K packets per second, and we change the number of requests in a packet. The lock may be applied (LOCK) or not (NOLOCK).
of UDP packets will be created and sequence numbers are placed in them, as what is done inMemcached.
Note that a GET request is processed in the context ofsoftirqhandling, rather than by another thread. This avoids the context switch between network stack routines and worker threads for reading and processing requests. The path for the UDP packets to travel in Hippos is shown in Figure 3.1.
3.2.3
Removal of the Second Bottleneck
In the previous investigation, we assumed that locks in Memcached are disabled to take out lock-related cost and highlight the cost related to the packet processing in the network stack. Now we have two questions to answer: (a) Did we overestimate the performance ofMemcachedby removing lock contention? (b) If the packet processing
in the network stack is not the bottleneck, what is the effect of the lock-related cost on Memcached’s performance? To answer the first question, we ran Multiport Memcached on eight cores with RPS (Receive Packet Steering) enabled and with the same workload as before except that GET requests retrieve data that have been in the KV cache. Because of maintenance of data structures for the Least-Recently-Used (LRU) replacement policy, lock operations can be required even for GETs. As shown in the upper graph of Figure 3.4, after we enabled the locks at the increasing packet arrival rate the system achieves the same throughput as that for its counterpart with
Memcachedinternal locks disabled. In other words, the lock overhead is overshadowed by the network cost and thus is not a performance issue unless the network cost is sufficiently reduced. After the load increases beyond 320K packets per second the throughput increases little, which indicates that Memcached cannot receive sufficient GET requests to allow its lock use to become a performance bottleneck (here we assume one GET request per packet).
To answer the second question, we need to increase the number of GETs without increasing network cost. To this end, we placed multiple GETs in a UDP packet and kept packet arrival rate constant at 320K packets per second. Before the work-load increases to 1280K GETS per second (by placing more GETs in a packet), the throughput in terms of number of GETs serviced in one second almost linearly in-creases. But beyond this point the throughput peaks and starts to drop. This is attributed to intensified contention on theMemcached’s internal locks as we observed that the cores still have idle time. If we disable the locks in the experiment, the throughput maintains its linear increase. Ostensibly, this represents the best-case performance, because the locks cannot be disabled in a real workload that includes
mutating requests, such as SET and DELETE.
Currently Memcached uses a set of locks for its hash table, each for a number of buckets in a hash value range, and one lock to maintain consistency of the data structure for its LRU cache replacement policy. When traffic to Memcached is high, the request processing can become serialized by these locks. Even worse, a thread owning a hash table lock cannot release it until it acquires the LRU lock and completes its operations on the LRU stack to keep the consistency of these two data structures. To address the issue, we synergistically apply two techniques. First, we replace the spinlock for the hash table with RCU (Read-Copy Update) lock [47, 48]. RCU allows readers to access the shared data without any conventional lock. For writes, it creates new copies to accommodate updates before old copies are freed. In RCU, reads can be much cheaper than writes. As it has been shown that in the Memcached workloads, GETs can be much more frequent than update requests, RCU is an ideal fit in the enforcement of mutual exclusiveness. Second, we adopt the CLOCK policy instead of LRU to completely remove the use of locking for cache replacement.
3.2.4
Handling TCP packets
Hipposuses the in-kernel TCP socket to receive SET, REPLACE, DELETE, and other writing requests. However, it does not optimize its reception and processing of TCP packets except that it handles them in the kernel. This relieves us from re-implementing the complex TCP stack. For NICs that have multiple hardware receive queues, we run one thread on each core to handle TCP connections. For NICs with only one queue when NAPI [61] is enabled, Hippos needs to spread the load across cores. It accomplishes this by creating a worker thread listening on the incoming TCP connections on the core responsible for polling the NIC for incoming packets