Forensic Anthropology Population Data
Age- and sex-related changes in the soft tissues of the orbital region
Chiarella Sforza
*
, Gaia Grandi, Francesca Catti, Davide G. Tommasi,
Alessandro Ugolini, Virgilio F. Ferrario
Functional Anatomy Research Center (FARC), Laboratorio di Anatomia Funzionale dell’Apparato Stomatognatico (LAFAS), Dipartimento di Morfologia Umana, Facolta` di Medicina e Chirurgia, Universita` degli Studi di Milano, via Mangiagalli 31, I-20133 Milano, MI, Italy
1. Introduction
Human face carries information that allows the identification of
a single person
[1–3]
. In particular, the soft tissues of the orbital
region play a predominant role in the evaluation and recognition of
the craniofacial complex. Additionally, reference anthropometric
data of the orbital region are necessary for multiple diagnostic and
forensic procedures (evaluations of traumas, chromosomal and
single gene alterations, teratogenic-induced conditions such as the
fetal alcohol syndrome, facial reconstruction)
[4–13]
.
Several previous investigations quantitatively analyzed the
age-, sex-, and ethnic characteristics of the various components of
the orbital region, assessing both dimensions, reciprocal spatial
positions, and relative proportions
[4,8–10,12–19]
. Assessments
had been performed both with two-dimensional photographic
records and three-dimensional direct and indirect (digital)
anthropometry. In particular, current technology provides various
image analysis systems that work in the three-dimensional space
(range-camera techniques, stereophotogrammetry, laser scanning,
optoelectronic systems, and electromagnetic three-dimensional
digitizers), and that supply non-invasively the digital coordinates
of the landmarks of interest
[1,6,7,11,13,15,20]
.
Apart from sexual dimorphism and age-related changes,
ethnicity plays a major role in the definition of the soft-tissue
A R T I C L E I N F O
Article history:
Received 27 September 2008
Received in revised form 24 October 2008 Accepted 8 December 2008
Available online 18 January 2009
Keywords: Digital anthropometry Forensic anthropology Orbits Man Growth Aging A B S T R A C T
The orbital region plays a predominant role in the evaluation of the craniofacial complex. In the current study information about normal sex-related dimensions of the orbital region, and growth, development and aging, were provided. The three-dimensional coordinates of several soft-tissue landmarks on the orbits and face were obtained by a non-invasive, computerized electromagnetic digitizer in 531 male and 357 female healthy subjects aged 4–73 years. From the landmarks, biocular and intercanthal widths, paired height and inclination of the orbit relative to both the true horizontal (head in natural head position) and Frankfurt plane, length and inclination of the eye fissure, the relevant ratios, soft-tissue orbital area, were calculated, and averaged for age and sex. Comparisons were performed by factorial analysis of variance. Biocular and intercanthal widths, length of the eye fissure, soft-tissue orbital area, and the inclination of the orbit relative to the true horizontal, were significantly larger in men than in women (p<0.01), with a significant effect of age (p<0.001), and significant agesex interactions (p<0.001). Orbital height, and the height-to-width ratio increased as a function of age (p<0.001), but without gender-related differences. The inclination of the orbit relative to Frankfurt plane, and the inclination of the eye fissure did not differ between men and women, but modified as a function of age (p<0.001), with different sex-related patterns (sexage interaction,p<0.001). On average, the paired measurements were symmetric, with similar values within each sex and age group. Overall, when compared to literature data, some differences were found due to both ethnicity, and different instruments. Nevertheless, during childhood, adolescence, and young adulthood, the age-related trends for linear dimensions were similar to those found in previous studies, while no previous data exist for older adults. During aging an increment in soft-tissue orbital area was found, with a progressive downward shift of landmark orbitale. Data collected in the present investigation could serve as a data base for the quantitative description of human orbital morphology during normal growth, development and aging. Forensic applications (evaluations of traumas, craniofacial alterations, teratogenic-induced conditions, facial reconstruction, aging of living and dead persons, personal identification) may also benefit from age- and sex-based data banks.
ß2008 Elsevier Ireland Ltd. All rights reserved.
* Corresponding author. Tel.: +39 02 503 15407; fax: +39 02 503 15387.
E-mail address:[email protected](C. Sforza).
Contents lists available at
ScienceDirect
Forensic Science International
j o u r n a l h o m e p a g e : w w w . e l s e v i e r . c o m / l o c a t e / f o r s c i i n t
0379-0738/$ – see front matterß2008 Elsevier Ireland Ltd. All rights reserved.
characteristics of the orbital region, both in healthy subjects and in
patients
[4,5,8–12,16,21,22]
.
Overall, quantitative data on the growth and development after
birth throughout childhood and adolescence into young adulthood,
on adult individuals, as well as during aging, have been provided
for African American
[4,12]
; Asian
[8,16–18,22]
; Black South
African
[6]
; Indian
[9,22,23]
; Dutch Caucasian
[19]
; Italian
Caucasian
[15]
; North American Caucasian
[4,12,24,25]
;
Scandi-navian Caucasian
[13]
; Turkish Caucasian
[5,14,21]
; and Slavic
Bulgarian
[10]
healthy persons of both sexes.
In particular, data about European Caucasians are still scanty.
For instance, while eye fissure dimensions have been reported for
persons between birth and the 9th decade of life
[13,15,19]
, no data
on biorbital and intercanthal widths can be found after the 6th
decade of life
[13,15]
. Additionally, orbital relative proportions and
three-dimensional spatial position were investigated only in
adolescence, young and mid-adulthood
[15]
, and normative data
on a wider group of persons are still lacking. Indeed, in
contemporary western society, not only the number of aged
persons is increasing, but also forensic investigations (aging of
both living and dead persons, personal identification) are currently
performed on a wider age range than before, thus needing new
reference data on each ethnic group.
For instance, personal identification greatly depends on facial
characteristics
[3]
, and the definition of age-, sex- and
ethnic-specific data bases may help in the identification of those
individual features that best discriminate among persons
[1,2]
.
Additionally, there is an urgent need for age-related facial
dimensions that may help in the aging of victims from
pedo-pornography. Facial reconstructions also need data collected from
living persons of the widest possible age span, supplying
information that may assist in simulating the modifications of
facial features during normal growth and aging
[28,29,31]
.
In the current study, information about normal sex-related
linear and angular dimensions of the soft tissues of the orbital
region between childhood and old age, were provided. Data were
collected non-invasively using digital anthropometry in healthy
Italian Caucasians aged 4–73 years.
2. Materials and methods 2.1. Subjects
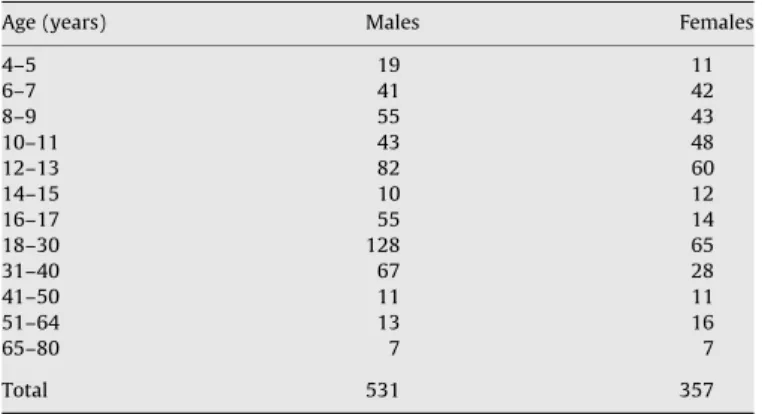
Data on 888 healthy white Italians aged 4–73 years were collected. The subjects were divided into several non-overlapping age groups (Table 1): for subjects younger than 18 years, 2-year spans were used, while larger intervals were used for adult subjects.
Subjects with a previous history of craniofacial trauma, orbital diseases, congenital anomalies or surgery were not included in the sample. They were previously informed about all the adopted procedures, and gave their consent to the investigation. Informed consent was also obtained from the parents/legal guardians of the subjects underage. The study protocol was approved by the local ethic committee. All procedures were not invasive, not potentially harmful, did not provoke pain and did not use any instrument or energy currently considered to be potentially dangerous to the present or future health of the subjects or of their offspring.
Part of the current data was previously published[15].
2.2. Collection of three-dimensional facial landmarks
The data collection procedure was previously described in detail[15,26]. In brief, for each subject, a single experienced operator located a set of 50 landmarks and marked them on the cutaneous surface. During landmark marking, the subjects sat relaxed with a natural head position. The reproducibility of landmark identification, marker positioning and the reproducibility of the data collection procedure were previously reported, and found to be reliable[27]. The complete set of 50 landmarks allowed the quantitative study of head, face, orbits, nose, lips and mouth, ears in the living human subjects[26].
Three-dimensional (x,y,z) coordinates of the facial landmarks were obtained with a three-dimensional computerized electromagnetic digitizer (3 Draw, Polhemus Inc., Colchester, VT). The system has an accuracy of 0.025 cm, a resolution of 0.013 cm/cm of range, and it supplies actual metric data independent from external reference systems. Digitization of landmarks was performed by a single operator.
In the present study, from the complete set of 50 landmarks the following paired soft-tissue landmarks were further considered (right and left side noted r and l): exr,
exl, exocanthion; enr, enl, endocanthion; orr, orl, orbitale; osr, osl, orbitale superius;
tr, tl, tragion (Fig. 1).
2.3. Data analysis
The three-dimensional coordinates of the landmarks obtained on each subject were used to calculate the following measurements[15]:
linear distances (unit: mm): biorbital width (exr–exl); intercanthal width (enr–
enl); right and left height of the orbit (os–or); right and left length of the eye
fissure (en–ex);
ratios (unit: percentage): right and left height of the orbit to length of the eye fissure ratio (os–or/en–ex100);
angles (unit: degrees): right and left inclination of the eye fissure (angle of the en– ex line vs. the true horizontal, head in natural head position); right and left inclination of the orbit (angle of the os–or line vs. the true horizontal, head in natural head position); right and left inclination of the orbit relative to Frankfurt plane (angle between the os–or and t–or lines);
areas (unit: mm2
): right and left external orbital surface area (area of the quadrangle between ex, os, en and or).
All the measurements were performed in the three-dimensional space,i.e., the position of the landmarks relative to all the three planes (frontal, lateral and horizontal) was considered at the same time (no projections).
Descriptive statistics (mean and standard deviation) for each measurement were computed within sex and age group. Statistics of the angular measurements were computed by using the rectangular components of each angle.
Mean values between sexes and age groups were compared using two-way factorial analyses of variance. The effect of sex (factor 1 of the analysis of variance), and the effect of age (factor 2 of the analysis of variance) were assessed, as well as the sexage interaction. To investigate the age-related modifications of the analyzed orbital dimensions and angles, linear regression analyses were also performed. Significance was set at 5% (p0.05), with two-tail statistical tests used in all analyses.
3. Results
All analyzed linear soft-tissue orbital dimensions, except right
and left orbital heights, were significantly larger in men than in
Table 1Subjects analyzed in the current study.
Age (years) Males Females
4–5 19 11 6–7 41 42 8–9 55 43 10–11 43 48 12–13 82 60 14–15 10 12 16–17 55 14 18–30 128 65 31–40 67 28 41–50 11 11 51–64 13 16 65–80 7 7 Total 531 357
Fig. 1.Digitized three-dimensional soft-tissue orbital landmarks used in the current study. Ex: exocanthion; en: endocanthion; or: orbitale; os: orbitale superius; t: tragion.
women (
Tables 2–4
). A significant sexual dimorphism was found
also for soft-tissue orbital areas, and for the orbital inclinations vs.
the true horizontal (both measurements were larger in men than in
women), while no sex-related differences were observed for the
height-to-width ratios, and the inclinations of the orbits relative to
both the true horizontal (head in natural head position) and
Frankfurt plane.
All measurements significantly modified as a function of age,
with significant age
sex interactions. Biocular and intercanthal
widths, orbital height, length of the eye fissure, soft-tissue orbital
area all increased from childhood to old age; overall, all age-related
increments were larger in men than in women.
Between childhood and 16–17 years of age, biocular width
increased of 1.3 mm/year in men, and 0.9 mm/year in women,
while intercanthal width increased of 0.5 mm/year in men, and
0.3 mm/year in women. Age explained between 10% (intercanthal
width in men) and 46% (biorbital width women) of the variations
of these measurements (
Table 5
). Orbital heights increased of
approximately 7–9 mm in the analyzed time span; at 10–11 years
of age, the measurements attained 90% of the value of the last age
group; age explained more than 57% of their variability. In women,
the length of the eye fissure increased of about 0.4 mm/year until
12–13 years of age, without subsequent age-related variations. In
men, increments of 0.5 mm/year until 12–13 years of age were
found. In the 4–5-year-old children, the soft-tissue orbital areas
were approximately 70% of their final dimensions, with increments
of 4–5 mm
2/year in men, and 3–4 mm
2/year in women. Most of the
variability in soft-tissue orbital area was explained by age-related
modifications.
After adolescence, the orbital height-to-width ratios increased
as a function of age, with overall variations of about 20%. The
inclinations of the eye fissures relative to the true horizontal (head
in natural head position) increased of approximately 4
8
between
childhood and adolescence, with subsequent decrements of about
6
8
. The inclinations of the orbits relative to the true horizontal
increased until young adulthood (modifications of about 6–8
8
) and
subsequently reduced. In contrast, small but steady age-related
increments were observed for the inclinations of the orbits relative
to Frankfurt plane, with overall modifications of about 10
8
. The
effect was particularly evident in men, where age explained 44–
59% of the variations of these measurements.
On average, the present individuals had symmetric orbital
dimensions and inclinations. Mean values of paired linear
distances differed of less than 2 mm within each sex and age
Table 2Three-dimensional soft-tissue orbital morphometry in healthy men. Age (years) Measurement Unit 4–5 6–7 8–9 10–11 12–13 14–15 16–17 18–30 31–40 41–50 51–64 65–80 exr–exl mm Mean 82.7 82.5 84.7 89.2 90.9 94.6 96.7 94.1 95.7 96.0 93.7 93.2 S.D. 4.0 4.6 4.7 4.1 4.1 5.4 8.1 4.5 4.0 6.3 5.6 4.1 enr–enl mm Mean 25.9 26.9 27.3 28.1 28.7 30.2 32.8 30.4 29.8 31.3 28.3 29.4 S.D. 2.4 2.7 2.8 2.5 2.7 2.8 4.5 2.6 2.7 1.8 3.8 2.9 Right side os–or mm Mean 27.5 29.9 31.1 31.7 30.0 28.5 32.6 34.2 35.1 34.9 35.9 35.1 S.D. 2.6 4.6 3.8 3.5 3.3 4.1 3.0 3.2 3.3 4.2 3.1 2.7 en–ex mm Mean 30.3 30.2 30.3 32.7 33.1 34.6 33.9 33.4 34.6 33.3 33.5 32.7 S.D. 1.4 2.3 2.2 2.0 2.0 2.6 3.0 2.5 3.0 2.8 3.2 2.5 os–or/en–ex % Mean 90.97 99.65 103.26 97.46 91.00 82.38 96.82 103.01 102.33 105.44 107.69 108.40 S.D. 10.25 17.46 15.85 14.03 11.40 11.28 10.09 11.49 12.81 15.34 10.43 15.36 Area mm2 Mean 831.5 900.9 939.8 1035.0 991.6 988.4 1107.2 1141.5 1214.5 1163.0 1208.9 1145.1 S.D. 81.5 144.4 119.5 109.5 127.3 176.2 162.6 147.2 162.5 170.8 200.3 86.3 en–ex vs. TH 8 Mean 17.7 20.2 20.8 22.9 20.2 22.6 20.3 18.6 18.1 17.6 17.1 13.7 S.D. 3.2 3.1 3.8 2.5 3.8 3.0 3.1 3.4 3.9 2.5 2.1 5.9 os–or vs. TH 8 Mean 115.4 117.0 117.6 116.4 115.8 119.5 119.4 123.0 119.6 117.4 119.7 116.2 S.D. 4.0 4.9 5.4 6.2 4.5 4.0 4.8 6.5 5.8 5.8 4.7 5.5 os–or vs. FH 8 Mean 106.2 111.1 112.2 111.0 108.4 114.7 112.7 115.2 112.7 115.2 113.8 116.1 S.D. 5.5 4.8 5.5 6.7 5.1 4.7 4.7 7.3 5.8 4.9 6.6 6.6 Left side os–or mm Mean 25.8 30.0 30.2 30.9 30.0 29.0 32.8 34.0 34.9 35.0 35.4 35.4 S.D. 2.4 5.0 4.0 3.5 3.3 4.5 3.0 3.6 3.7 3.2 2.5 4.1 en–ex mm Mean 30.5 29.9 31.3 33.6 33.5 35.3 34.3 34.2 35.2 34.6 35.0 34.0 S.D. 1.9 2.1 2.3 1.9 2.2 1.8 2.9 2.5 2.8 4.3 3.3 1.9 os–or/en–ex % Mean 85.07 101.04 97.05 92.35 91.00 81.97 96.02 99.95 99.73 102.75 101.69 104.22 S.D. 10.77 18.20 16.13 13.43 11.40 10.34 9.02 11.98 12.27 16.98 7.40 11.69 Area mm2 Mean 783.0 896.4 942.8 1035.4 1005.1 1025.6 1128.3 1165.4 1229.3 1209.8 1241.6 1208.0 S.D. 74.7 160.7 126.0 106.1 137.3 199.8 168.1 156.8 171.1 166.9 191.5 172.9 en–ex vs. TH 8 Mean 19.2 19.4 19.6 21.3 20.1 21.9 19.3 18.9 18.0 16.5 15.7 15.4 S.D. 3.5 3.9 3.4 2.8 3.3 3.7 3.4 3.3 3.4 1.5 2.4 3.4 os–or vs. TH 8 Mean 114.2 115.4 115.5 116.5 115.7 115.6 118.9 121.6 118.7 114.9 117.8 115.3 S.D. 4.4 5.3 5.0 5.8 4.4 6.4 4.8 6.2 5.6 6.6 3.0 4.7 os–or vs. FH 8 Mean 103.4 108.2 108.9 109.5 107.5 108.1 109.1 113.6 111.6 112.2 111.2 114.7 S.D. 4.3 4.4 5.0 6.0 4.7 6.6 6.0 6.4 6.0 7.1 4.8 4.3
Table 3
Three-dimensional soft-tissue orbital morphometry in healthy women. Age (years) Measurement Unit 4–5 6–7 8–9 10–11 12–13 14–15 16–17 18–30 31–40 41–50 51–64 65–80 exr–exl mm Mean 81.4 82.5 85.6 85.7 89.5 88.9 93.1 90.2 89.6 91.8 92.6 91.5 S.D. 4.4 3.8 5.2 2.8 4.0 4.8 4.5 3.8 4.3 4.2 4.9 2.5 enr–enl mm Mean 25.1 27.2 27.9 26.7 28.0 27.6 30.5 28.5 28.2 29.6 29.9 28.7 S.D. 3.2 3.1 2.7 2.4 2.3 2.3 3.0 2.8 1.8 2.1 3.8 2.8 Right side os–or mm Mean 25.7 29.5 30.0 31.7 30.2 28.9 32.1 32.7 33.8 32.5 34.7 33.7 S.D. 2.0 3.5 4.3 3.8 2.9 1.8 2.8 2.9 2.4 2.9 2.7 4.8 en–ex mm Mean 30.3 29.0 30.5 31.3 32.7 33.4 33.2 32.3 32.0 32.6 32.8 32.4 S.D. 2.0 1.6 2.1 1.7 2.3 1.4 1.5 2.1 2.5 1.9 3.5 2.1 os–or/en–ex % Mean 85.34 101.99 98.59 101.64 92.62 86.75 96.88 101.88 105.93 99.64 106.69 104.52 S.D. 10.48 14.63 14.29 13.78 10.67 8.88 8.53 11.39 10.31 7.71 12.47 17.12 Area mm2 Mean 779.0 854.9 916.2 991.5 987.3 961.6 1066.8 1055.2 1082.0 1060.8 1142.0 1089.1 S.D. 58.0 100.9 158.4 128.3 118.8 32.9 114.5 116.3 121.1 136.1 175.9 155.3 en–ex vs. TH 8 Mean 17.4 20.5 20.4 21.1 20.2 22.8 20.0 18.1 17.2 15.9 17.6 19.5 S.D. 3.0 3.5 3.1 3.1 3.3 0.4 1.7 3.5 2.5 3.8 3.7 3.1 os–or vs. TH 8 Mean 109.4 114.6 113.9 117.0 114.2 114.4 116.1 116.7 113.8 110.5 114.8 116.6 S.D. 5.1 4.4 4.8 5.2 3.9 1.1 5.0 5.5 5.2 7.6 4.2 4.1 os–or vs. FH 8 Mean 102.8 109.8 109.2 111.9 107.7 109.8 108.8 109.9 108.1 108.1 111.7 113.1 S.D. 6.3 5.1 5.3 6.3 4.4 2.3 5.0 5.0 5.6 5.7 5.0 5.7 Left side os–or mm Mean 25.7 29.0 30.5 31.5 30.0 29.9 32.2 33.0 33.8 32.5 34.5 33.7 S.D. 2.7 4.1 4.1 4.4 3.4 2.1 2.1 2.9 2.9 2.9 3.5 3.5 en–ex mm Mean 29.6 30.0 31.3 32.1 33.1 32.7 33.4 33.0 32.5 32.5 33.3 34.2 S.D. 1.8 1.7 2.6 1.8 1.9 1.7 1.9 2.1 2.5 1.9 3.0 1.1 os–or/en–ex % Mean 87.35 97.06 97.97 98.50 91.00 91.46 96.48 100.16 104.53 100.34 103.90 96.75 S.D. 11.00 15.72 14.25 15.56 11.74 2.33 7.27 10.01 10.64 7.59 11.25 12.97 Area mm2 Mean 760.3 866.3 954.5 1010.5 990.0 980.3 1074.0 1089.0 1097.8 1058.4 1150.8 1151.0 S.D. 87.4 126.5 162.9 146.1 123.2 117.6 102.6 129.1 146.0 133.9 184.1 95.4 en–ex vs. TH 8 Mean 20.6 18.8 19.5 20.3 19.9 20.8 19.0 18.1 16.9 16.1 16.9 17.8 S.D. 2.6 3.2 3.5 3.0 3.3 0.2 2.0 3.7 2.9 3.5 3.0 2.1 os–or vs. TH 8 Mean 110.3 113.3 112.7 116.0 113.4 112.9 116.3 115.8 113.1 110.4 113.9 111.2 S.D. 4.4 4.1 4.7 5.0 4.3 2.0 4.0 5.3 4.8 7.3 3.1 4.8 os–or vs. FH 8 Mean 103.9 107.3 106.7 110.2 106.1 105.3 105.5 109.1 107.3 107.5 110.4 105.9 S.D. 5.2 4.4 4.9 5.6 4.6 1.9 5.0 5.0 6.3 5.0 4.3 5.2
TH: true horizontal; FH: Frankfurt plane.
Table 4
p-Values from the two-way factorial analyses of variance.
Measurement Sex Age Sexage
Biorbital width (exr–exl) 0.009 <0.001 <0.001
Intercanthal width (enr–enl) 0.002 <0.001 <0.001
Right side
Height of the orbit (os–or) NS <0.001 <0.001 Length of the eye fissure (en–ex) 0.012 <0.001 <0.001 Orbital height-to-eye fissure length NS <0.001 <0.001 External orbital surface area <0.001 <0.001 <0.001 Inclination of the eye fissure vs. TH NS <0.001 <0.001 Orbital inclination vs. TH 0.027 <0.001 <0.001 Orbital inclination vs. FH NS <0.001 <0.001 Left side
Height of the orbit (os–or) NS <0.001 <0.001 Length of the eye fissure (en–ex) 0.013 <0.001 <0.001 Orbital height-to-eye fissure length NS <0.001 <0.001 External orbital surface area <0.001 <0.001 <0.001 Inclination of the eye fissure vs. TH NS <0.001 <0.001 Orbital inclination vs. TH 0.027 <0.001 <0.001 Orbital inclination vs. FH NS <0.001 <0.001 Degrees of freedom: sex 1864; age 11,864; sexage 11,864. NS: not significant (p>0.05). TH: true horizontal; FH: Frankfurt plane.
Table 5
R-squared values from the linear regression analyses with age.
Measurement Men Women
exr–exl 0.312 0.459 enr–enl 0.101 0.324 Right side os–or 0.670 0.573 en–ex 0.165 0.218 os–or/en–ex 0.463 0.354 Area 0.595 0.571 en–ex vs. TH 0.637 0.201 os–or vs. TH 0.019# 0.025# os–or vs. FH 0.438 0.269 Left side os–or 0.678 0.571 en–ex 0.307 0.437 os–or/en–ex 0.421 0.273 Area 0.643 0.594 en–ex vs. TH 0.775 0.573 os–or vs. TH 0.011# 0.076 os–or vs. FH 0.590 0.074
TH: true horizontal; FH: Frankfurt plane. The regressions are significant at the 1% level unless indicated (#).
group (most were smaller than 0.5 mm), the height-to-length ratio
of less than 5% (except the 8–9 and 10–11-year-old boys, and the
oldest women), the areas of less than 50 mm
2(except the oldest
men and women), the inclinations of less than 4
8
(except the
orbital inclination relative to FH in the 14–15-year-old
adoles-cents, and the orbital inclination relative to TH in the oldest
women).
4. Discussion
In the present investigation, dimensions and position of the soft
tissues of the orbital region have been found to be sexually
dimorphic, and to modify between childhood, adolescence and
young adulthood, and even after young adulthood into the 8th
decade of life. The present data were cross-sectional, and therefore
do not represent true growth or aging but only estimates of the
biological phenomena: different groups of subjects were examined
at the different ages. Indeed, the possible presence of secular
trends, with individuals with different craniofacial characteristics
examined in the various age groups, should be considered.
Nevertheless, even the scanty longitudinal studies where persons
up to the 7th decade of life were examined, showed significant
increments in facial dimensions
[28]
. The increments were larger
in the soft tissues (nose and ears), but they were found even in
those facial dimensions more determined but the underlying hard
tissues (e.g., bizygomatic width)
[28]
.
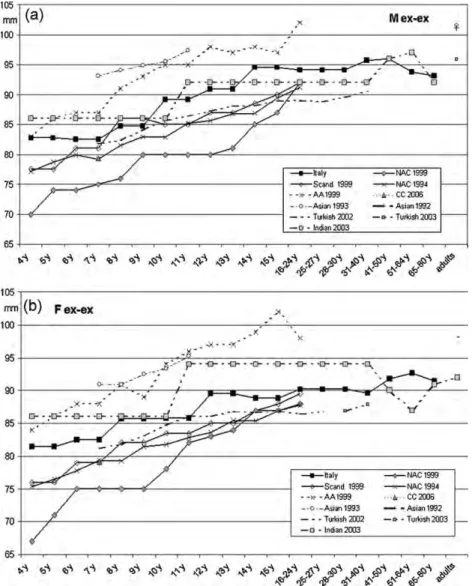
Overall, in both sexes biorbital width measured in the current
study was somewhat larger than previous values collected in
Caucasian subjects (
Fig. 2
)
[5,12–14,24]
, but smaller than data
reported for AfroAmerican and Asian persons
[12,17,18]
. Apart the
ethnic differences (in no other study Italian Caucasians were
analyzed), different instruments were used in the various
investigations, and the current method (electromagnetic digitizer)
was not employed by other research groups. Nevertheless, the
age-related trend for this measurement was similar to those reported
in literature, also considering that only Gupta et al.
[9]
analyzed a
similar age span.
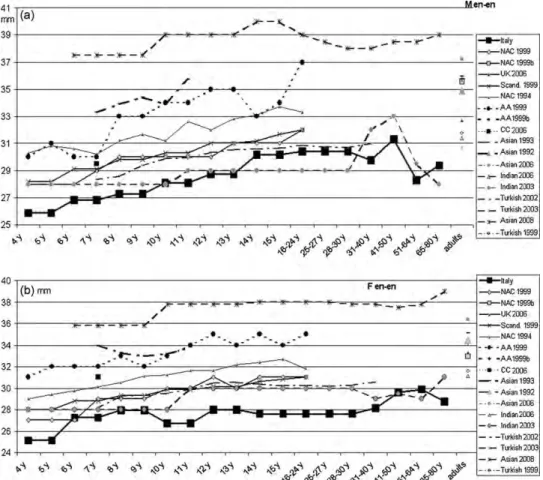
In contrast, the current values for intercanthal width were
among the smallest of those reported in literature (
Fig. 3
)
[4–
6,12,13,16,19,21,22,24,25]
. In both sexes, the largest values were
listed by Park et al.
[16]
for Asian persons, with a trend very similar
to that found in the current Italian subjects.
In no previous study, eye fissure length was reported for a time
span as long as that analyzed in the current study, but considering
the general trend of literature reports, age-related increments up
to the 4–5th decades of life, with subsequent reductions, were
found in most ethnic groups (
Fig. 4
)
[4–6,12,13,16,19,21,22,
24,25]
.
Fig. 2.Biorbital width: current and literature data in various age and ethnic groups. (A) Men and (B) women. Italy (Italian Caucasians): current data; Scand. 1999 (Scandinavian Caucasians):[13]; AA 1999 (AfroAmericans):[12]; Asian 1993:[18]; Turkish 2002:[14]; Indian 2003:[9]; NAC 1999 (North American Caucasians):[12]; NAC 1994:[24]; SA 2006 (black South African):[6]; Asian 1992:[17]; Turkish 2003:[5].
Data on orbital height reported by Farkas et al.
[24]
for North
American Caucasians were smaller than the current values, but
even in that study no sex-related differences were observed. Even
if the young adolescents had already attained 90% of the value of
the last age group, small but steady increments were recorded in
both sexes. These increments explained the modifications in the
orbital height-to-eye fissure length ratio, a rough assessment of the
‘‘shape’’ of the orbital region, which was coupled with increments
in the soft-tissue orbital area. At the same time, the inclinations of
the orbits relative to Frankfurt plane gradually increased from
childhood to old age. In the young adults, the latter value was
similar to that reported by Farkas et al.
[24]
. Unfortunately, no
measurements in other age groups were found.
Taken all together, these data could be explained by a
progressive shift of the lower eyelid and landmark orbitale: their
position became more inferior with advancing age
[19,29]
. With
aging, progressive modifications of the microscopic structure of
facial dermis have been reported in previous investigations
[30]
:
the observed reduction in elastic fibers may explain the
macro-scopic modifications in the position of facial structures.
A deep knowledge of the relative positions of facial structures in
the different age and ethnic groups, as well as in the two sexes, is
therefore mandatory for a correct reconstruction of the global
facial appearance
[31]
. Unfortunately, literature data on this topic
are still scanty. For instance, the inclination of the eye fissure (en–
ex line) was analyzed by Farkas et al.
[24]
, Kunjur et al.
[22]
, and
Park et al.
[16]
, but the measurements were performed with
different reference lines. Farkas et al.
[24]
reported data relative to
Frankfurt plane, while Kunjur et al.
[22]
and Park et al.
[16]
assessed the inclination of the en–ex line relative to the inner
intercanthal line. While absolute data cannot be compared, it is
interesting to note that the age-related pattern reported by Park
et al.
[16]
is very similar to the current one, with gradual
decrements after adolescence.
On average, the paired measurements were symmetric, with
similar values within each sex and age group. Similar
considera-tions can be made for literature data
[4,10,13,19,24]
.
A significant sexual dimorphism was found for all analyzed
soft-tissue orbital dimensions except os–or. According to most literature
reports, a significant sexual dimorphism in soft-tissue orbital
dimensions is present in the adult
[4,9,14,16,21]
, during growth
[14,16]
, and already at birth
[8,10]
, with larger dimensions in men
than in women. Some differences were found also for the positions of
the orbital structures
[16]
. In contrast, other investigators reported
scarce male–female differences
[9,12]
. Different ethnic groups,
different age ranges, and different techniques used for the
measurements may explain this discrepancy.
The number of subjects examined in the present investigation is
quite comparable to that analyzed in most cross-sectional
[4,12,13,16,24]
and longitudinal
[28]
anthropometric
investiga-tions, even if some studies analyzed two or three thousands of
individuals
[9,14]
. It has to be mentioned that those investigations
measured only linear distances
[9,14]
. Data collected in the present
investigation could therefore represent a useful data base for the
quantitative description of orbital morphology in normal Italian
Caucasian subjects.
Fig. 3.Intercanthal width: current and literature data in various age and ethnic groups. (A) Men and (B) women. Italy (Italian Caucasians): current data; NAC 1999 (North American Caucasians):[12]; NAC 1999b:[4]; UK 2006 (British Caucasians):[22]; Scand. 1999 (Scandinavian Caucasians):[13]; NAC 1994:[24]; AA 1999 (AfroAmericans):
[12]; AA 1999b:[4]; SA 2006 (black South African):[6]; Asian 1992:[17]; Asian 1993;[18]; Asian 2006:[22]; Indian 2003:[9]; Indian 2006:[22]; Turkish 1999:[21]; Turkish 2003:[5], 2003; Asian 2008:[16].
5. Conclusion
In the current study, a detailed information about the normal
sex- and age-related linear and angular dimensions of the soft
tissues of the orbital region in healthy Italian Caucasians were
provided. The analyzed age interval covered 8 decades of life, being
one of the widest reported in literature. Overall, when compared to
literature data, some differences were found, pointing out the
necessity of data collected on each ethnic group. The age-related
trends for linear dimensions were similar to those found in
previous studies, showing a progressive downward shift of
landmark orbitale with advancing age.
Data collected in the present investigation could serve as a data
base for the quantitative description of human orbital morphology
during normal growth, development and aging, also considering
sex- and ethnic-related variations. Soft-tissue facial characteristics
are among those most used for personal identification, and
knowledge of their age-related modifications is necessary to build
data banks informative for forensic investigations. Among the
others, the detection of facial dimensions that remain stable over
time (or that have reduced age-related variations) may help in
personal identification even years after the actual crime.
A further application (using those characteristics that show the
largest age-related variations) may be the estimation of the age of
both living and dead persons, using direct measurements as well as
photographic records. The same data may enter into simulations of
facial growth and aging, helping in personal identification.
Conflict of interest
The authors have no conflict of interest related to the current
investigation.
Acknowledgements
The authors are grateful to all the subjects who volunteered for
the study. The precious secretarial assistance of Ms. Cinzia Lozio is
gratefully acknowledged.
References
[1] N.L. Fraser, M. Yoshino, K. Imaizumi, S.A. Blackwell, C.D. Thomas, J.G. Clement, A Japanese computer-assisted facial identification system successfully identifies non-Japanese faces, Forensic Sci. Int. 135 (2003) 122–128.
[2] M.M. Roelofse, M. Steun, P.J. Becker, Photo identification: facial metrical and morphological features in South African males, Forensic Sci. Int. 177 (2008) 168– 175.
[3] J. Shi, A. Samal, D. Marx, How effective are landmarks and their geometry for face recognition? Comput. Vis. Image Understand. 102 (2006) 117–133.
[4] R.L. Barretto, R.H. Mathog, Orbital measurement in black and white populations, Laryngoscope 109 (1999) 1051–1054.
[5] M.G. Bozkir, P. Karakas, O. Oguz, Measurements of soft tissue orbits in Turkish young adults, Surg. Radiol. Anat. 25 (2003) 54–57.
[6] T.S. Douglas, D.L. Viljoen, Eye measurements in 7-year-old black South African children, Ann. Hum. Biol. 33 (2006) 241–254.
[7] T.S. Douglas, F. Martinez, E.M. Meintjes, C.L. Vaughan, D.L. Viljoen, Eye feature extraction for diagnosing the facial phenotype associated with fetal alcohol syndrome, Med. Biol. Eng. Comput. 41 (2003) 101–106.
[8] T.F. Fok, K.L. Hon, H.K. So, E. Wong, P.C. Ng, A.K.Y. Lee, A. Chang, Craniofacial anthropometry of Hong Kong Chinese babies: the eye, Orthod. Craniofac. Res. 6 (2003) 48–53.
[9] V.P. Gupta, P.K. Sodhi, R.M. Pandey, Normal values for inner intercanthal, inter-pupillary, and outer intercanthal distances in the Indian population, Int. J. Clin. Pract. 57 (2003) 25–29.
[10] L.M. Madjarova, M.M. Madzharov, L.G. Farkas, M.J. Katic, Anthropometry of soft-tissue orbits in Bulgarian newborns: norms for incanthal and bicular widths and length of palpebral fissures in 100 boys and 100 girls, Cleft Palate-Craniofac. J. 36 (1999) 123–126.
[11] E.S. Moore, R.E. Ward, L.F. Wetherill, J.L. Rogers, I. Autti-Ramo, A. Fagerlund, S.A. Jacobson, L.K. Robinson, H.E. Hoyme, S.N. Mattson, T. Foroud, Unique facial features distinguish fetal alcohol syndrome patients and controls in diverse ethnic populations, Alcohol. Clin. Exp. Res. 31 (2007) 1707–1713.
Fig. 4.Palpebral width: current and literature data in various age and ethnic groups. (A) Men and (B) women. Italy (Italian Caucasians): current data; NAC 1999 (North American Caucasians):[12]; UK 2006 (British Caucasians):[22]; Scand. 1999 (Scandinavian Caucasians):[13]; NAC 1994:[24]; AA 1999b (AfroAmericans):[4]; SA 2006 (black South African):[6]; NL 1999 (Dutch Caucasians):[19]; Asian 2006:[22]; Indian 2006:[22]; Turkish 1999:[21]; Turkish 2003:[5]; Asian 2008:[16]; NAC 2006:[25].
[12] E.K. Pivnick, M.L. Rivas, E.A. Tolley, S.D. Smithand, G.J. Presbury, Interpupillary distance in a normal black population, Clin. Genet. 55 (1999) 182–191. [13] K. Stromland, Y. Chen, T. Norberg, K. Wennerstrom, G. Michael, Reference values
of facial features in Scandinavian children measured with a range-camera tech-nique, Scand. J. Plast. Reconstr. Hand Surg. 33 (1999) 59–65.
[14] C. Evereklioglu, S. Doganay, H. Er, A. Gunduz, M. Tercan, A. Balat, T. Cumurcu, Craniofacial anthropometry in a Turkish population, Cleft Palate-Craniofac. J. 39 (2002) 208–218.
[15] V.F. Ferrario, C. Sforza, A. Colombo, J.H. Schmitz, G. Serrao, Morphometry of the orbital region: a soft-tissue study from adolescence to mid-adulthood, Plast. Reconstr. Surg. 108 (2001) 285–292.
[16] D.H. Park, W.S. Choi, S.H. Yoon, C.H. Song, Anthropometry of Asian eyelids by age, Plast. Reconstr. Surg. 121 (2008) 1405–1413.
[17] J.R. Quant, G.C. Woo, Eye position and head size in the Chinese population: a comparison of the Chinese from Hong Kong with the Chinese from Guangdong Province, Optom. Vis. Sci. 69 (1992) 793–796.
[18] J.R. Quant, G.C. Woo, Normal values of eye position and head size in Chinese children from Hong Kong, Optom. Vis. Sci. 70 (1993) 668–671.
[19] W.A. van den Bosch, I. Leenders, P. Mulder, Topographic anatomy of the eyelids, and the effects of sex and age, Br. J. Ophtalmol. 83 (1999) 347–352.
[20] C. Sforza, V.F. Ferrario, Soft-tissue facial anthropometry in three dimensions: from anatomical landmarks to digital morphology in research, clinics and forensic anthropology, J. Anthropol. Sci. 84 (2006) 97–124.
[21] H. Borman, F. O¨ zgu¨r, G. Gu¨rsu, Evaluation of soft-tissue morphology of the face in 1050 young adults, Ann. Plast. Surg. 42 (1999) 280–288.
[22] J. Kunjur, T. Sabesan, V. Ilankovan, Anthropometric analysis of eyebrows and eyelids: an inter-racial study, Br. J. Oral Maxillofac. Surg. 44 (2006) 89–93. [23] G. Agnihotri, D. Singh, Craniofacial anthropometry in newborns and infants, Iran.
J. Pediatr. 17 (2007) 332–338.
[24] L.G. Farkas, T.A. Hreczko, M.J. Katic, Craniofacial norms in North American Caucasians from birth (one year) to young adulthood, in: L.G. Farkas (Ed.), Anthropometry of the Head and Face, Raven Press, New York, 1994 , pp. 241–235.
[25] E. Ing, A. Safarpour, T. Ing, S. Ing, Ocular adnexal asymmetry in models: a magazine photograph analysis, Can. J. Ophthalmol. 41 (2006) 175–182. [26] V.F. Ferrario, C. Sforza, G. Serrao, V. Ciusa, C. Dellavia, Growth and aging of facial
soft-tissues: a computerised three-dimensional mesh diagram analysis, Clin. Anat. 16 (2003) 420–433.
[27] V.F. Ferrario, C. Sforza, C.E. Poggio, M. Cova, G. Tartaglia, Preliminary evaluation of an electromagnetic three-dimensional digitizer in facial anthropometry, Cleft Palate-Craniofac. J. 35 (1998) 9–15.
[28] E. Gualdi–Russo, Longitudinal study of anthropometric changes with aging in an urban Italian population, Homo 49 (1998) 241–259.
[29] S.R. Coleman, The anatomy of the aging face: volume loss and changes in 3-dimensional topography, Aesthetic Surg. J. (26) (2006) S4–S9.
[30] I. Ito, M. Imada, M. Ikeda, K. Sueno, T. Arikuni, A. Kida, A morphological study of age changes in adult human auricular cartilage with special emphasis on elastic fibers, Laryngoscope 111 (2001) 881–886.
[31] C.N. Stephan, Position of superciliare in relation to the lateral iris: testing a suggested facial approximation guideline, Forensic Sci. Int. 130 (2002) 29–33.