warwick.ac.uk/lib-publications
Original citation:
Pinna, C., Lan, Y., Kiu, M. F., Efthymiadis, P., Lopez-Pedrosa, M. and Farrugia, D.. (2015)
Assessment of crystal plasticity finite element simulations of the hot deformation of metals
from local strain and orientation measurements. International Journal of Plasticity, 73 . pp.
24-38.
Permanent WRAP URL:
http://wrap.warwick.ac.uk/69968
Copyright and reuse:
The Warwick Research Archive Portal (WRAP) makes this work of researchers of the
University of Warwick available open access under the following conditions.
This article is made available under the Creative Commons Attribution 4.0 International
license (CC BY 4.0) and may be reused according to the conditions of the license. For more
details see: http://creativecommons.org/licenses/by/4.0/
A note on versions:
The version presented in WRAP is the published version, or, version of record, and may be
cited as it appears here.
Assessment of crystal plasticity
fi
nite element simulations of
the hot deformation of metals from local strain and
orientation measurements
C. Pinna
a,*, Y. Lan
b,a, M.F. Kiu
a, P. Efthymiadis
c,a, M. Lopez-Pedrosa
d,a,
D. Farrugia
baThe University of Sheffield, Department of Mechanical Engineering, Mappin Street, Sheffield S1 3JD United Kingdom bTata Steel Research, Development&Technology, Swinden Technology Centre, Moorgate, Rotherham, South Yorkshire S60 3AR, United Kingdom
cWMG, University of Warwick, Coventry, CV4 7AL, United Kingdom
dApplied Seismology Consultants, 5 Clarement Buildings, Clarement Bank, Shrewsbury SY1 1RJ, United Kingdom
a r t i c l e i n f o
Article history: Received 19 August 2014
Received in revised form 5 May 2015 Available online 18 June 2015
Keywords:
A. Thermomechanical processes B. Crystal plasticity
B. Finite strain C. Finite elements Strain measurements
a b s t r a c t
Simulations of the deformation of microstructures at high homologous temperatures have been carried out using a Crystal Plasticity Finite Element (CPFE) model to predict texture and grain structure deformation in Face-Centred-Cubic (FCC) metals deformed under conditions representative of hot forming operations. Results show that the model can quantitatively predict the location and intensity of the main deformation texture com-ponents of a AA5052 aluminium alloy deformed at 300C under Plane Strain Compression (PSC). Simulations also reasonably predict the range of strain values measured using microgrids in the microstructure of a Fe-30wt%Ni alloy deformed at 1000C using a new experimental procedure. However, the model fails to reproduce accurately intra-granular strain distribution patterns. Results at room temperature, after a tensile test carried out inside a Scanning Electron Microscope (SEM) on the same model alloy, show a much closer match between simulation and experimental results. Despite discrepancies for some local deformation features, the model predicts the formation of intense deformation bands running at 45with respect to the tensile axis and located along the same grain boundaries as in the experiment. Results, therefore, highlight the limitations of deterministic CPFE simulations for situations where the grain size to sample thickness ratio is small and for which the sub-surface grain geometry strongly affects surface strains. They also show that reliable predictions of the statistical response of a polycrystalline aggregate can be ob-tained for the hot deformation of metals which controls microstructure evolution during the processing of metals.
©2015 The Authors. Published by Elsevier Ltd. This is an open access article under the CC BY license (http://creativecommons.org/licenses/by/4.0/).
*Corresponding author. Tel.:þ44 1142227831.
E-mail addresses:c.pinna@sheffield.ac.uk(C. Pinna),[email protected](Y. Lan),mep10mfk@sheffield.ac.uk(M.F. Kiu),P.Efthymiadis@warwick. ac.uk(P. Efthymiadis),[email protected](M. Lopez-Pedrosa),[email protected](D. Farrugia).
Contents lists available atScienceDirect
International Journal of Plasticity
j o u r n a l h o m e p a g e : w w w . e l s e v i e r. c o m / l o c a t e / i j p l a s
http://dx.doi.org/10.1016/j.ijplas.2015.05.015
1. Introduction
The mechanical properties of metals such as steels and aluminium alloys are dependent on their processing conditions and are a direct result of the microstructure evolution taking place during both hot and cold forming operations. For instance, recrystallisation occurring at high homologous temperature during a hot forming process such as industrial rolling followed by phase transformation upon subsequent cooling affect both the grain size and texture of metals. The numerical simulation of microstructure evolution during such process is, therefore, of paramount importance for the metal industry, with the aim of reducing production cost by predicting the properties of thefinal product. Microstructure-based simulations of recrys-tallisation and/or phase transformation using techniques such as Cellular Automata (Lan et al., 2005; Popova et al., 2015; Rollett and Raabe, 2001; Zheng and Raabe, 2013), Monte-Carlo (Radhakrishnan et al., 1998; Zhang et al., 2012) or Phase-Field (Lan and Pinna, 2012; Takaki and Tomita, 2010; Takaki et al., 2014) have been developed in recent years for micro-structure and recrystallisation texture prediction at high temperature. Such physical phenomena are affected by the energy stored in the microstructure during deformation and, therefore, the accurate prediction of strain and stress distributions in these microstructures is key to the successful simulation of subsequent microstructure evolution. Crystal Plasticity Finite Element (CPFE) models of the deformation of polycrystalline metals are particularly well suited for the coupling with the numerical techniques mentioned above as they predict intra-granular state variable distributions which can then be used as input for recrystallisation/phase transformation simulations. Improved computing performance over the past decade has enabled the development of statistically meaningful simulations of the deformation of grain structures in metals using CPFE models. These models have been used extensively in published research studies for the prediction of deformation texture and mechanical response of metals at both room (Alharbi and Kalidindi, 2015; Bachu and Kalidindi, 1998; Erinosho et al., 2013; Gerard et al., 2013; Kalidindi et al., 2009; Khan et al., 2015; Sabnis et al., 2013; Sarma and Dawson, 1996; Tamini et al., 2014; Van Houtte et al., 2002; Zhang et al., 2015b) and elevated temperatures (Li et al., 2004; Quey et al., 2012) with good agreement with experimental measurements. They have also been used to simulate the deformation of grain structures at room tem-perature for polycrystals (Heripre, 2007; Kanjarla et al., 2010; Musienko et al., 2007; Pokharel et al., 2014; Raabe et al., 2001; Rossiter et al., 2010; Rotters et al., 2010; St-Pierre et al., 2008) but comparison with intra-granular strain measurements usually only shows qualitative agreement with clear local discrepancies between modelling and experimental results. Better agreement is usually obtained for the deformation of oligocrystals (Delaire et al., 2000; Kalidindi et al., 2004; Klusemann et al., 2012, 2013; Lim et al., 2011, 2014; Turner et al., 2013; Zhao et al., 2008) for which the geometry of the grain struc-ture is better represented in three dimensions in the simulations.
Studies focussing on similar prediction of intra-granular deformation of metals at high homologous temperatures are scarce due to the difficulty of measuring strain distributions at that scale, especially under large deformation conditions typical of hot forming operations, in order to validate the models.
Several experimental techniques have been developed to measure strain distributions at the scale of microstructures. Methods based on Digital Image Correlation (DIC) (Sutton et al., 1991) are now commonly used but most studies have been carried out at room temperature, usually by combining DIC with in-situ testing conducted inside the chamber of a SEM (e.g.
Ghadbeigi et al., 2012for large deformation applications). One such study has been carried out at 950C recently (Torres et al., 2014). However, deformation conditions from the tensile test carried out in the latter study are not representative of the large compression experienced by metals in a hot rolling process. An alternative technique based on microgrids used in a PSC test carried out at 950C has enabled the measurement of strain distributions within the two-phase microstructure of a Duplex steel (Martin et al., 2013). However, the grids had to be engraved through chemical etching to ensure successful results, which affected strain resolution measurements and potentially subsequent microstructure evolution due to the grooves generated at the surface of the metal. Furthermore, the study did not include local orientation measurements at the microstructural scale.
The aim of this work is, therefore, to develop a CPFE model for the simulation of the hot deformation of single phase Face-Centred-Cubic (FCC) metals, such as aluminium alloys or steels rolled in their austenitic range during hot rolling, and assess the reliability of the results through comparison with experimental measurement of local strains and orientations. A new procedure has, therefore, been developed to measure both local intra-granular strain distributions and orientations in the microstructure of a single-phase steel deformed at 1000C under conditions representative of hot forming operations.
2. Experimental procedure
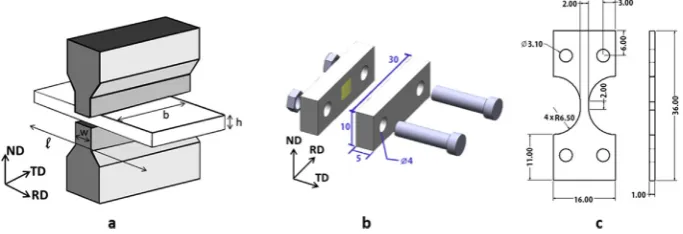
Experiments have been carried out at both high homologous and room temperatures in order to assess the reliability of CPFE predictions at various scales and temperatures. Statistical prediction from the model has been assessed through comparison with texture measurements, using Electron-Back-Scattering-Diffraction (EBSD), following a PSC test carried out at 300C on an aluminium alloy AA5052. A PSC sample 60 mm long along the rolling direction (RD), 50 mm wide along the transverse direction (TD) and 10 mm thick along the normal direction (ND) of the as-received hot rolled plate was heated from room temperature to 300C with a heating rate of 10C s1and soaked at this temperature for 10 s. The sample was then deformed in air to a thickness reduction of 60% with a strain rate of 9.0 s1using a state-of-the-art 500 kN Servotest thermo-mechanical-compression (TMC) machine capable of applying controlled strain rates up to 200 s1. A schematic drawing of the PSC test is shown inFig. 1(a). The recommended aspect ratios to ensure plane strain conditions are:b0/w2,h0/w0.67 and
andlthe length of the specimen along RD (Loveday et al., 2006). Platens applying the compression are 15 mm wide. The undeformed parts of the specimen on both sides of the compression zone restrict deformation along the breadth direction ensuring plane strain conditions away from external surfaces.
Graphite is commonly used as lubricant between the specimen and platens for temperatures below 800C. A friction coefficient of 0.1 was estimated (Loveday et al., 2006) for the friction correction used to computeflow stress values from the measured average pressurepapplied by the platens to the specimen. This correction procedure (Silk and van der Winden, 1999)firstly assumes partially sticking/sliding conditions along the contact line between specimen and platen and calcu-lates the positionz0from the edge of the anvil of the boundary between sticking and sliding conditions using the following
equation:
z0¼ h 2m ln 1 2m (1)
The value ofz0is then used to determine which friction conditions prevail and the shearflow stresskis then calculated
from the measured values ofpusing the following equations: If2z0>w(sliding friction)
p 2k¼ 1 bw 2h2
m2 þ
ðbwÞh
m
h expmw
h
1i2h
mb (2)
Ifw>2z0>0(partial sticking friction)
p 2k¼ h mw 1
2m1
þ w 2 z0
mw þ
h w 2 z0 i2 hw þ 1 mb 2z2 0 w z0
2hz0
mw þ h
2mhþ
h2 wm2
2h2 mw ! þ 1 hb z 2 0 4z3 0 3w w2 12 ! (3)
If0>2z0(sticking friction)
p
2k¼1þ
w
4h
w2
12hb (4)
The equivalentflow stress is then given by
s¼2k=f (5)
withfrelating the true compression strain along the normal direction 3(ND),ε3¼ln(h/h0), to the equivalent von Mises strain
ε¼ fε3 (6)
The factorfaccounts for lateral spread along direction 2 (TD),ε2¼ln(b/b0), with values varying between 1.155 under pure
plane strain conditions and 1 for axisymmetric conditions (ε1¼ε2).
[image:4.544.104.446.55.172.2]The specimen was immediately quenched to room temperature after compression using water. Deformation texture measurements were then performed on the (RD,TD) plane at mid-thickness of the specimen after careful mechanical grinding. The analysed area was 3.33.4 mm with a step size of 2
m
m for an average grain size of about 100m
m. The same conditions were used on the as-received plate to measure the starting texture at mid-thickness. Further tests have beencarried out to assess CPFE results at the grain scale. High temperature compression tests were conducted on a Fe-30wt%Ni alloy using a Gleeble 3800 machine whose test geometry is the same as that shown inFig. 1(a) but the platens' widthw in this case was only 5 mm. Unlike the TMC machine, tests on the Gleeble are conducted under vacuum to prevent oxidation problems. This steel is a non-transformable model alloy produced by Tata Steel to simulate the behaviour of austenite at high temperature in CeMn steels and was used to preserve, upon cooling, microgrids laid at the surface of the specimen to measure strain distributions in the microstructure. Gold microgrids with a 24.5
m
m pitch size and covering a 2.5 mm2area of the microstructure were deposited using Electron Beam Lithography (EBL), following the procedure described inGhadbeigi et al. (2012), along the middle (RD,ND) plane of the particular geometry of the specimen shown inFig. 1(b). This geometry was designed to be as close as possible to that recommended for generating plane strain conditions, especially on the plane where the grids are located, taking into consideration constraints on maximum specimen's dimensions allowable in the SEM chamber during the microgrid deposition process, and to make surface preparation conditions (e.g.fine polishing required on the microgrid plane) experimentally practical with a specimen thickness of 10 mm. Prior to microgrid deposition the surface wasfirst electro-polished for grain orientation measurements using EBSD (with a step size of 3m
m) and then chemically etched to reveal grain boundaries. The surface of the second part of the specimen, which comes into contact with the microgrid plane, when the two parts of the sample are assembled using screws (Fig. 1(a)), was mechanically polished down to 1m
m. The specimen was then heated up to 1000C in 3 min and then held at this temperature for 1 min before being deformed with 15% nominal compression applied at a strain rate of 1 s1. No lubricant was used during this test to prevent any deterioration of the surface where microgrids are located, through penetration of lubricant particles during deformation. Extreme care must indeed be taken, especially at such high temperature, to avoid damaging or covering microgrids with any deposit. A friction coefficient of 0.4 was assumed for the test. The sample was then slowly cooled down to room temperature. Tensile tests at room temperature have also been carried out on the same Fe-30wt%Ni alloy inside the chamber of a SEM using a 5 kN Deben loading stage. The specimen geometry is shown inFig. 1(c). A total strain of 10% was applied with a displacement rate of 0.1 mm/min. The test was interrupted before reaching the ultimate tensile strength of the steel in order to minimise any damage formation. Intra-granular strain distributions have been measured using microgrids, with 18.3m
m pitch size and covering a 1.5 mm2area along the gauge length of the specimen. The same procedure for EBSD measurements as for high temperature tests was used for this specimen.3. Crystal plasticityfinite element model
The model developed in this work is based on the classical formulation developed byAsaro and Rice (1977). The key equations are only reported here. Forfinite deformation, the total deformation gradientFis multiplicatively decomposed into two components:
F¼FFP (7)
withF*the elastic deformation gradient which includes both stretching and rotation of a crystal lattice andFPthe plastic deformation gradient assumed to result from the slip of dislocations along specific directions and crystallographic planes. The velocity gradientL¼FF_ 1can also be decomposed into an elastic partL*and a plastic part~LP
as follows:
L¼LþF*~LPF*1 (8)
withL*¼F_*F*1,L~P¼F_PFP1 and the superscript“1”denoting the inverse of a matrix. The plastic part of the velocity gradient, which is related to the slip rateg_aon a slip systema, is calculated by
~ LP¼XN
a¼1 _ gaba
05na0 (9)
whereba0andna0are the slip direction and the normal to the slip plane in the un-deformed configuration respectively,“5”
denotes the dyadic products of two vectors andNthe total number of potential slip systems. The slip direction and the normal to the slip plane in the deformed configuration areb¼F*b0andn¼n0F*1. The lattice rotation during plastic deformation is
described using the rates of change of both the slip direction and the normal to the slip plane as follows:
_
ba¼L*ba (10)
and
_
na¼ naL* (11)
The shear rateg_aon the slip systemais determined by the resolved shear stresstaand the critical resolved shear stressta
_
ga¼g_a0sgnðtaÞttaa c
1=m (12)
whereg_a
0is the reference shear rate on the slip systema,mis the rate sensitivity exponent and sgnðÞis the sign function.
Strain hardening is characterised by the evolution of the critical resolved shear stress. Both phenomenological and physically-based hardening models have been used in this work to describe the evolution of the critical resolved shear stress in AA5052 and Fe-30wt%Ni subjected to different deformation conditions.
3.1. Peirce model (Peirce et al., 1982)
The phenomenological model developed by Peirce et al. calculates the critical resolved shear stress using the following linear hardening law
_ ta
c ¼ XN
b¼1
habg_b (13)
withhabthe hardening modulus including self-hardening (
a
¼b
) and latent hardening (a
sb
). Many phenomenologicalmodels have been developed to calculate the hardening modulus. The model suggested byPeirce et al. (1982)is used in this work:
hab¼qab
h0sech2
h0g
tst0
(14)
whereh0is the initial hardening modulus,t0andtsare the initial and saturation critical resolved shear stresses, respectively,
g¼PN
a¼1
Z t
0
jg_ajdtthe cumulative shear strain on all active slip systems, andq
abthe ratio of latent to self-hardening moduli.
qabis set to be 1.4 for latent hardening and 1.0 for self-hardening.
In the Peirce model, only three parameters (h0,t0andts) need to be identified using one measured stressestrain curve. The calibration process is, therefore, relatively straightforward. However, all the parameters mentioned above are dependent on material, deformation temperature and strain rate. Therefore the Peirce model cannot predict the hardening behaviour under any other deformation and temperature conditions if measured stressestrain curves are not available. A more physically-based hardening model, directly dependent on temperature and strain rate, is presented in the following section.
3.2. Tome model (Beyerlein and Tome, 2008; Knezevic et al., 2013, 2014)
The hardening model developed by Beyerlein et al. uses dislocation densities as variables to calculate the critical resolved shear stress. The density of forest dislocations is determined through equation (15)by the storage rate due to plastic deformation and the thermally activated annihilation rate, e.g., dynamic recovery (Mecking and Kocks, 1981):
vra
for vga ¼
vra
gen vga
vra
rec
vga ¼k1ðε;_ TÞ ffiffiffiffiffiffiffiffi ra
for
q
k2ðε;_ TÞrafor (15)
withk1ðε_;TÞandk2ðε_;TÞdependent on material, deformation temperature and strain rate.k1ðε_;TÞis determined by the slope
of the stress-plastic strain curve at the start of plastic deformation. The ratiok2=k1depends on the saturation stress and is
given by
ka2 ka1¼
cabm
ta
satðε;_ TÞ ¼cab
ga
1 kT
Dab3ln
_ ε _ ε0 (16)
wherecais the dislocation interaction parameter which varies between 0.05 and 2.6,b(2.851010m (Knezevic et al., 2013))
is the magnitude of the Burgers vector,mthe shear modulus,ta
satthe saturation stress,gathe effective activation energy,k (1.381023JK1) the Boltzmann constant,Tthe temperature in Kelvin,Daa drag stress,ε_the strain rate andε_0the reference
strain rate. Some of the dislocations are rearranged to form deformation substructures, e.g. sub-grain boundaries and deformation cell walls, during plastic deformation. The density of those dislocations stored in deformation substructures is calculated as follows:
drsub dga ¼
X
a
qaEab ffiffiffiffiffiffiffiffiffirsub p vra
rec
hereqa(10.0 (Knezevic et al., 2014)) is a rate coefficient and the product ofEa(1.0 (Knezevic et al., 2014)) andbpffiffiffiffiffiffiffiffiffirsubreflects the fraction of dislocations forming substructures from the forest dislocations removed due to softening (second term in the right side of equation(15)).
The stresses arising from the forest dislocations and from the dislocations forming deformation substructures are
ta
for¼bm
ffiffiffiffiffiffiffiffiffiffiffiffiffiffiffiffiffiffiffiffiffi X
cara
for
q
(18)
ta
sub¼ksubbm ffiffiffiffiffiffiffiffiffirsub p
log
1
bpffiffiffiffiffiffiffiffiffirsub
(19)
withksub(0.086,Knezevic et al., 2014) an empirical parameter. Therefore, the total critical resolved shear stress is the sum of the above two stresses and the initial slip resistance:
ta
c ¼ta0þtaforþtasub (20)
where the initial critical resolved shear stressta
0 is dependent on material, deformation temperature and strain rate.ta0 is
determined by the yield strength and calculated using
ta
0ðε;_ TÞ ¼Aa½1þBalnðεÞ_ expðT=CaÞ (21)
withAa,Ba andCa material-dependent constants.ta
for represents the combined effect of strain hardening and dynamic softening.ta
subreflects the stage III or IV hardening behaviour.
As shown in equations(15)e(21), the dislocation-based hardening model directly depends on deformation temperature and strain rate and can, therefore, predict the stress/strain response of hot deformed materials at temperatures different from those used for calibration of the hardening parameters. However, the Tome model has more parameters (at least 10) compared to the phenomenological hardening model (only 3 for the Peirce model). The calibration process thus requires more measured stress/strain curves and is also more complex.
The crystal plasticity-based constitutive equations have been implemented in the UMAT subroutine of ABAQUS 6.10/ standard based on the work byHuang (1991)for the computation of the slip increment.
3.3. Orientation Distribution Function (ODF) calculation
In order to describe the deformation texture developed during the PSC test on AA5052, the Orientation Distribution Function (ODF) value in the CPFE simulation was calculated using the Bunge's Gaussian distribution function (Bunge, 1982). For an orientationnwith Bunge's Euler angles (
f
1n,F
n,f
n2) and a volume fraction In, its ODF value at a given point (f
1,F
,f
2) inthe Euler space is given as
fnðu0;uÞ ¼In.ðnCnSÞS0ðu0Þeu 2=u2
0 (22)
whereS0ðu0Þz2 ffiffiffip p
=fu0½1eðu0=2Þ2gis the maximum ODF value,u0¼FWHM=ð2pffiffiffiffiffiffiffiffiffiln 2Þa parameter in radians related to the Full Width at Half Maximum (FWHM) of the Bunge's Gaussian distribution,uthe misorientation angle also in radians between (
f
1,F
,f
2) and (f
1n,F
n,f
2n), nC¼24 and nS¼4 the numbers of crystal and sample symmetry for the PSC test onAA5052. It is worth pointing out that both crystal and sample symmetry need to be considered when one calculates the misorientation angleuin equation(22). If there areMorientations simulated in the CPFE model, the ODF value is
fðu0;41;F;42Þ ¼ X n¼M
n¼1
fnðu0;uÞ (23)
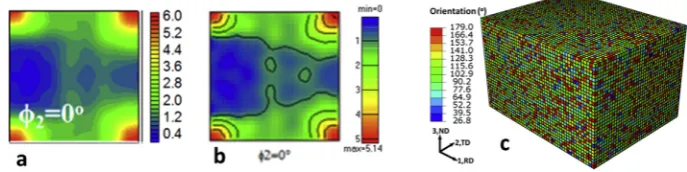
To make the ODF calculation more efficient, discrete Euler angles extracted from CPFE simulations are divided into data clusters, with the orientation in a cluster described by the Euler angles at its centre. The volume fraction in each cluster can then be calculated. From the Euler angles and volume fraction at the centre of each cluster, the ODF value is calculated using equations(22) and (23). The above ODF calculation method has been validated through comparison with the series expansion method used in the commercial software Channel 5.0 of the HKL EBSD system by plotting the starting texture of the aluminium alloy, as shown inFig. 2(a) and (b), where the following parameters, FWHM¼13, cluster size¼7for the Bunge's Gaussian method, maximum expansion orderlmax¼22, cluster size¼7for the series expansion method, are used.
4. CPFE simulations of PSC tests
finite elements (C3D8 - 8 nodes full integration solid element in Abaqus) in the CPFE model (50 elements along the RD di-rection, 40 along the TD direction and 32 along the ND direction) with one orientation per element (Fig. 2(c)). The model was compressed on the top and bottom surfaces to a reduction of 60% at a constant displacement rate, with the total deformation time matching the experimental value. The two surfaces parallel to the (ND-RD) plane werefixed and the surfaces parallel to the (TD-ND) plane were left free to deform. The plastic deformation in this aluminium alloy was simulated using the octa-hedral slip systems {111}<110>.
CPFE simulations for Fe-30wt%Ni alloy were carried using the same octahedral {111}<110>slip systems as the material is Face-Centred-Cubic (FCC) at the two temperatures investigated in this work. Since the high nickel content stabilises iron over this range of temperatures, the phase transformation of this alloy was prevented, which was required to see the microgrids after cooling to room temperature. A FE mesh size corresponding to three times the step size used for EBSD measurements was used in order to obtain reasonable computing times, with measured orientations assigned to the elements. For the simulation at 1000C, a two-dimensional model under plane strain conditions was run, given the geometry of the test, using CPE4 elements (four nodeseplane strain) in Abaqus. The measured deformation of the microgrid area was used to estimate the displacements applied as boundary conditions for the simulated area in the CPFE model, following a similar approach to that reported inHeripre et al. (2007) . A linear interpolation of the measured values was actually used for simplification. Top and bottom boundaries were compressed at a constant displacement rate, with the total deformation time matching the experimental value. Measured displacements were applied to the boundary on the left hand side while the right hand side was left free to move. As for the CPFE simulations run at room temperature, the element size in the model also corresponded to three times the step size used for EBSD measurements (3
m
m). The two-dimensional grain structure revealed through orientation measurements was then extruded along the out-of-plane direction to a thickness of 9m
m (Fig. 8(c)). The same C3D8 Abaqus elements as those used for the aluminium simulations were selected for the model. The tensile deformation measured using microgrids was used to apply a uniform and constant displacement rate on the top and bottom surfaces of the simulated area, while left and right hand side boundaries were left free to move.5. Results
5.1. Calibration of hardening model parameters
The measured equivalent stress/plastic strain curves generated from the PSC tests were used to calibrate the hardening parameters used in the Peirce model and in the Tome model as shown inFig. 3. The calibrated values of the Peirce model parameters for AA5052 and Fe-30wt%Ni under different deformation conditions are shown inTable 1. The reference shear rateg_0is determined using the method suggested byBeyerlein and Tome (2008):ε_ij¼P
a S a
ijg_0sgnðtaÞðta=tacÞ1=mwithSaijthe
Schmidt factor. Therefore,g_0zMε_ withM¼1=P a S
a
ijthe Taylor factor (3.06 for FCC polycrystalline metals). The main
cali-brated hardening parameters used in the Tome model are given inTables 2 and 3. Since only three stress/strain curves were measured (one for AA5052 and two for Fe-30wt%Ni) for calibration, it is very difficult to identify all the model parameters in the Tome model.k1aandk2awere, therefore, treated and calibrated as two independent parameters in equation(15)in order to reduce the overall number of adjustable parameters. Equation(16)has, therefore, not been used to calculate the ratio ofk2a/k1a in this work. The performance of the Peirce model and the Tome model is shown inFig. 3. It is clear that the two models can simulate the hardening behaviours of AA5052 and Fe-30wt%Ni reasonably well. However, they both underestimate the experimental stress values at the beginning of plastic deformation, but then overestimate them at a later stage, when deformation increases. Overall, the performance is similar for the two hardening models, although the calculated stresses are slightly closer to those measured for the Fe-30wt%Ni curve at room temperature using the Tome model while the prediction at 1000C is about the same for the two models (Fig. 3(b)). However, the prediction obtained using the Tome model appears worse than that produced by the Peirce model for the aluminium curve (Fig. 3(a)).Brahme et al. (2011)investigated the influence of hardening models, including both phenomenological and dislocation-based models, on the distribution of computed strain values in the microstructure of an aluminium alloy after uniaxial, in-plane plane strain and biaxial tension tests. Results clearly showed that the computed strain maps were very similar for both phenomenological and
[image:8.544.100.444.59.145.2]based hardening models, provided that the hardening model can simulate reasonably well the measured stress curves. Since, overall, the Pierce model provides a betterfit of the experimental stress/strain curves, considering both aluminium and steel, for the particularly simple deformation conditions investigated in this work, and given the relatively higher level of uncer-tainty in the identified parameters of the Tome model, due to the very small number of measured stress/strain curves, only simulations using the Peirce model have been run and are discussed next in this paper.
5.2. Texture prediction of AA5052 deformed at 300C
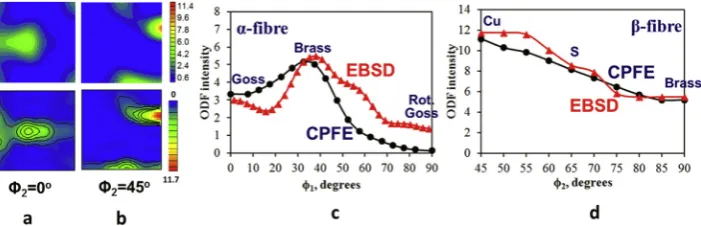
[image:9.544.115.430.55.160.2]The comparison between predicted and measured deformation textures is shown inFig. 4. In both cases, the main texture components ranging from high to low intensities are Copper {112}<111>, S {123}<634>, Brass {011}<211>and Goss {011} <100>with a minor Cube component (ODF value smaller than 2.4 times random). The ODF values along the
a
-fibre (from Goss to Brass for the section42¼0) and theb
-fibre (from Copper to Brass through S) are plotted inFig. 4(c) and Fig.Fig. 4(d) respectively. Despite discrepancies clearly visible mainly along thea
-fibre between simulation and experimental results, through the spread of the Brass and Copper components inFig. 4(a) and Fig.Fig. 4(b) respectively, and by the small residual cube texture appearing in the modelling results (Fig. 4(a)), the CPFE model predicts reasonably well the key texture com-ponents for this particular material and deformation conditions, not only in terms of location in the Euler space but also in terms of intensity. [image:9.544.38.503.226.293.2]Fig. 3.Experimental andfitted equivalent stress/strain curves for (a) the PSC test on AA5052 at 300C, (b) the compression test at 1000C and the tensile test at room temperature on Fe-30wt%Ni.
Table 1
Hardening parameters of the Peirce model.
Initial hardening modulush0(MPa)
Initial critical shear stresst0(MPa)
Saturation critical shear stressts(MPa)
Reference shear rateg_0
Young's modulus (GPa)
Strain rate sensitivity exponentm
AA5052, PSC, 9.0 s1, 300C 65.0 40.0 66.0 Mε_z27.0 s1 70 0.05
Fe-30%wtNi, PSC, 1.0 s1, 1000C 110.0 10.0 35.0 Mε_z3.0 s1 180 0.05
Fe-30%wtNi, tensile, 0.0001 s1, room temperature
700.0 20.0 125.0 Mε_z0.0003 s1 210 1/30
Table 2
Main hardening parameters used in the Tome model.
Hardening coefficient k1a(m1)
Softening coefficient k2a
Shear modulus m(GPa)
AA5052, PSC, 9.0 s1, 300C 3.0107 8.89 26
Fe-30%wtNi, PSC, 1.0 s1, 1000C 1.9107 14.65 69
Fe-30%wtNi, tensile, 0.0001 s1, room temperature 8.0107 17.02 79
Table 3
Parameters for calculating initial critical resolved shear stress in the Tome model.
Aa(MPa) Ba(Knezevic et al., 2014) Ca(K) (Knezevic et al., 2014)
AA5052 57.0 0.053 630
[image:9.544.44.503.352.403.2] [image:9.544.32.507.445.478.2]5.3. Intra-granular strain distributions at 1000C in Fe-30wt%Ni
Following the hot compression test carried out at 1000C, the specimen was carefully opened by removing the screws and separating the two parts of the specimen, which had remained in close contact, from naked-eye observations.Fig. 5(a) shows a picture of the deformed specimen with the grid location highlighted by the red rectangle (in the web version). As can be seen, the grid was slightly off-centre the deformation zone of the compression test due to inaccuracies in positioning the resin area to be irradiated in the SEM, using EBL, during the microgrid deposition procedure. Both the upper and lower parts of the deformed zone of the specimen show a white layer covering the surface of the specimen which might be the result of some form of oxidation. Fortunately, the penetration of this white layer did not reach the microgrids which survived the test, as can be seen inFig. 5(b). However, some parts of the grid were not sufficiently visible to be included in the analysis. The procedure to compute strain values from distorted microgrids involves manual clicking on the grid intersections to record coordinates. Since Abaqus computes logarithmic strain values, similar large strain deformation values are computed from the distorted grids. For every microgrid element defined by its four corners’coordinates before (Xi) and after deformation (xi) with i¼1,2, the in-plane deformation gradient tensorFcan be computed from the two vectors (I and II) defining each microgrid element:
F¼ xI1 xII1 xI2 xII2
! XI
1 XII1 X2II XII2
!1
(24)
Fcan be decomposed into a rigid rotation tensorRand a distortion tensorUas
F¼RU (25)
andUcan be diagonalised as
U¼QtDQ ðt stands for transpositionÞ (26)
The logarithmic strain tensor can be computed from the diagonal tensorDand the tensorQwhich gives the orientation of the principal directions of the distortion:
ELog¼QtlnðDÞQ (27)
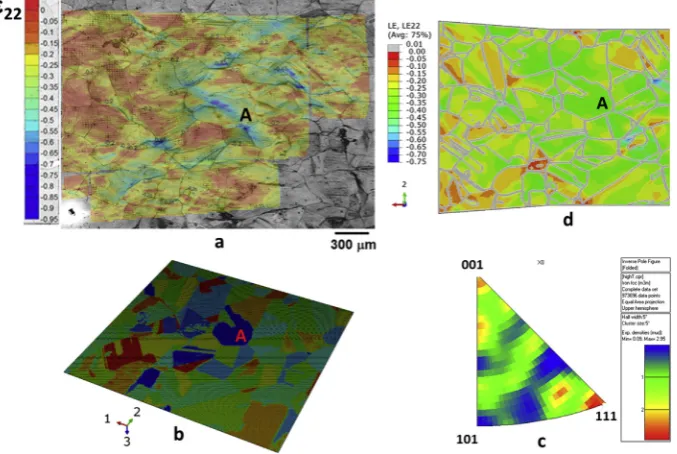
Fig. 6(a) shows the strain map for the component along the compression axisε22. The off-centre location of the grid with
[image:10.544.100.451.54.167.2]modelling results with a simulation value of 25%, the range of strain values is under-predicted by the model (standard de-viation equal to 7%) not only for high strain magnitudes but also for low ones.
5.4. Intra-granular strain distributions at room temperature in Fe-30wt%Ni
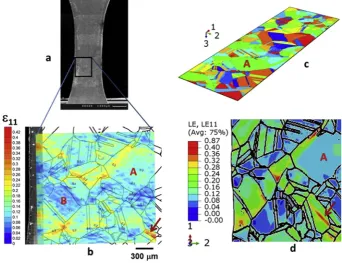
The deformed tensile specimen with the microgrid locations with respect to the gauge length is shown inFig. 8(a). Only the microgrid area situated in the bottom part of the gauge length was analysed, since the other part of the specimen showed the initiation of some instability leading to the formation of damage at one of the edges of the specimen. The experimental strain map produced after analysis of the microgrid distortion is shown inFig. 8(b) in terms of the tensile strain component ε11. Strain heterogeneity is clearly visible in the experimental strain map, with values ranging from 0 to 42% for an applied
[image:11.544.113.430.52.243.2]strain of 10%. Another clear feature in the strain map is the localisation of deformation along bands at about 45with respect to the loading direction. These bands are predominantly located along grain boundaries. The strain frequency distribution Fig. 5.(a) Deformed specimen after compression at 1000C showing the location of the microgrid through the thickness and (b) a close-up view of the deformed microgrids (Fe-30wt%Ni alloy).
Fig. 6. (a) Strain map for the component along the compression direction for the test at 1000C, (b) CPFE model of the microstructure, (c) starting texture of the
[image:11.544.104.443.292.519.2]histogram is shown inFig. 7(b). The average value of 12% is in line with the applied strain measured from the microgrids over the analysed area (12%) and the standard deviation value of 5% quantifies the strain heterogeneity shown in the map. CPFE simulations were carried out on the microstructural area shown inFig. 8(c). Results shown inFig. 8(d) for the area corre-sponding to the analysed microgrid area reveal similar features to those observed in the experimental result, with clear heterogeneity of deformation through localisation along bands running at 45with respect to the tensile axis, and along the same grain boundaries for most locations. However, there are clear discrepancies between experimental and modelling results. The highest strain magnitude in the model is much higher than in the experiment, with a factor three between the two results, and a much more intense deformation band predicted by the model in the grain highlighted with an arrow in
[image:12.544.105.444.54.215.2]Fig. 8(d). The overall deformation of grain B is also lower in the experimental result than in the simulation. Despite dis-crepancies between modelling and experimental results, the CPFE model predicts reasonably well not only the overall sta-tistical strain distribution, as shown inFig. 7(b) (average value: 11.3% and standard deviation: 5%) over the analysed area, but also local strain localisation patterns within the grains, at least qualitatively.
[image:12.544.102.445.402.665.2]Fig. 7.Strain distribution histograms for the component along the main loading axis (a) at 1000C and (b) at room temperature (Fe-30wt%Ni alloy).
6. Discussion
Simulations of deformation texture at high homologous temperature for the AA5052 aluminium alloy have shown the capability of the model to predict reasonably well the statistical response of a polycrystalline aggregate from comparison with EBSD measurements (Fig. 4). Published results have also shown similar agreement using grain interaction models (Engler et al., 2005; Jeong et al., 2015; Kabirian et al., 2015; Kalidindi et al., 2009; Mu et al., 2014; Pandey et al., 2013; Quey et al., 2012; M'Guil et al., 2015; Van Houtte et al., 2002; Xie et al., 2014; Zhang et al., 2015). The particular deformation condi-tions (high compression, relatively high strain rate and high temperature) applied to the investigated alloy have led to results which show a close match between model and experimental results in terms of main texture components. However, dis-crepancies, especially along the
a
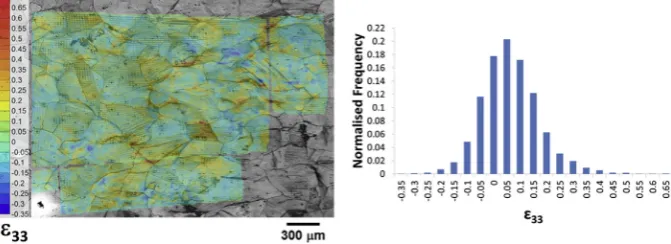
-fibre but also in terms of the small cube component which does not appear experimentally, show the limitations of current simulations. Such discrepancies do not seem to be related to a mesh size effect as another model involving 216,000 elements showed negligible differences in texture prediction. Despite the inaccuracies of the modelling results, which might partially be due to the simplistic representation of the microstructure, with only one orientation for every cuboidal element, the overall orientations distribution is reasonably well predicted by the CPFE model. More detailed comparison between CPFE simulations and experimental results at the scale of the microstructure of an austenitic model alloy Fe-30wt%Ni deformed at 1000C have shown further discrepancies (Fig. 6) with lack of agreement mainly in terms of local strain distributions (Fig. 6(a) and (d)) but also in terms of the overall strain distribution histogram (Fig. 7(a)). Although the model predicts a high level of strain heterogeneity with a standard deviation value of 7%, it clearly under-estimates both the low and high ends of the distribution. There are no similar published results to allow comparison but the lack of prediction of the main intense deformation bands, which run mainly along grain boundaries in the experi-mental strain map, suggests very strong three dimensional effects not accounted for in the CPFE simulation. The morphology and crystallographic orientation of grains located below the surface are indeed likely to influence the local deformation of the microstructure at the surface, especially as the grain size to sample thickness ratio is very low in this case.Fig. 9(a) shows the map of the out-of-plane strain component which has been estimated by assuming plastic incompressibility. Results clearly show the high local strain values (up to 65% for about 23% applied strain) along some grain boundaries where the previously mentioned deformation bands appeared. Some locations in the map also display high negative values down to35% in localised areas, which clearly show that the deformation at the scale of the microstructure is three dimensional due to the local configuration of the microstructure including the grains’geometry below the surface. Therefore, these high out-of-plane strain values have a strong influence on in-plane strain values, as shown by the correlation between the highest local strain values inFig. 6(a) and those inFig. 9(a). A two-dimensional model could, therefore, not predict these local three-dimensional effects which, in turn, influenced the formation of the intense bands of deformation along grain boundaries. However, the out-of-plane strain frequency histogram shown inFig. 9(b) reveals that the average strain over the analysed area is 3.9% with a high standard deviation of 11%. This result shows that even though local out-of-plane strain values can be very high, the overall deformation of the analysed area is close to plane strain conditions, with local three dimensional effects being cancelled out over a large area of the microstructure. This confirms that the test geometry did not exactly generate plane strain conditions on the middle (RD,ND) plane of the specimen but the deviation from ideal conditions is very small. The analysis of the out-of-plane deformation of the microstructure explains why the model could not predict the high strain values recorded in the histogram shown inFig. 8(a). However, despite this limitation related to the two-dimensional nature of the simulation, the model did predict a reasonable spread of strain values representative of the overall deformation of the microstructure. [image:13.544.103.439.550.672.2]Results from the room temperature test have confirmed the capability of the CPFE model to predict intragranular strain distributions from the similarities observed between simulated and experimental strain maps (Fig. 8(b) and (d) respectively). Despite some obvious differences between modelling and experimental strain distributions, the response of the simulated microstructure in terms of overall deformation and heterogeneity is well captured by the model (Fig. 7(b)), with very similar average strain and standard deviation values between the two histograms. Such agreement has also been reported in a recently published study using a full-field visco-plastic fast fourier transform crystal plasticity simulation applied to the room tem-perature deformation of a magnesium alloy (Martin et al., 2014), even though a direct comparison between experimental and
modelling results could not be made since synthetic three dimensional microstructures were used in the simulation. In this work the relative close match between the predicted range of strain values and experimental results might be due to the accurate in-plane boundary conditions extracted from microgrid measurements and applied to the model. Some of the dif-ferences between measured and predicted distributions might be due to the different gauge lengths over which local strain values are calculated since the element size in the model is much smaller than the microgrid pitch. Intra-granular strain distributions shown inFig. 8highlight more discrepancies between the simulation and experiment with the highest strain values, albeit very local, differing by a factor two between the two results. Moreover, some high strain deformation bands predicted by the model (arrow inFig. 8(d)) do not appear in the experimental strain map and the overall low deformation of grain B inFig. 8(b) is over-predicted by the model. However, the main deformation features of the experimental map are predicted by the model in the form of localised bands of high strain values running at about 45with respect to the loading direction and at similar locations along grain boundaries and within some twins (as highlighted by the arrow inFig. 8(b)). Disagreement between modelling and experimental intragranular strain distributions is commonly found in the literature especially when dealing with polycrystals (Heripre, 2007; Kanjarla et al., 2010; Musienko et al., 2007; Pokharel et al., 2014; Raabe et al., 2001; Rossiter et al., 2010; Rotters et al., 2010; St-Pierre et al., 2008) with simulation results only qualitatively predicting trends in strain distributions. Instead, studies on oligocrystals have shown better results in terms of local strain distributions due to improved three-dimensional characterisation of the investigated microstructure (Delaire et al., 2000; Kalidindi et al., 2004; Klusemann et al., 2012, 2013; Lim et al., 2014; Turner et al., 2013; Zhao et al., 2008). Results from this work seem to fall in between with some relative good agreement for the main deformation bands, especially for the high applied deformation, and some clear discrepancies. This is likely due to the relatively coarse grain structure of this particular model alloy with respect to the small thickness of the specimen (1 mm). The differences between predicted and simulated strain maps are, therefore, likely to be mainly due to the inaccuracy of the model in predicting three dimensional effects due to the misrepresentation of the grains’geometry through the thickness. It is also worth pointing out that the mismatch between modelling and experimental stress/strain curves inFig. 3(b) should also lead to inaccuracies in predicting strain values, especially in terms of their intensity. Furthermore, theflow stress curves computed from equations(1)e(6)are dependent on the estimated value of the friction coefficient during the test. Although the values used in this work might be inaccurate, they rely on expertise built over many years of testing aluminium alloys and steels and applying the friction correction toflow stress calculations. Results fromLoveday et al., 2006on the same aluminium alloy tested under very similar deformation conditions show variations of less than 10 MPa inflow stress values by varying the friction coefficient within a relevant range. Results on a stainless steel from the same paper also show that the effect of the friction coefficient is very noticeable at large strain due to changes in friction conditions at the contact surface between the anvil and the specimen after extensive deformation, but is very limited for small strain values such as that (15%) used to deform Fe-30wt%Ni at 1000C in this work. Such uncertainties related to the estimated friction coefficient values generate, however, further inaccuracies in the identification of the hardening parameters used in the CPFE model. Additional inaccuracies in local strain prediction at 1000C may also be due to physical mechanisms not currently considered in the CPFE model. Dislocation climb, for instance, might play a role in accommodating plastic deformation through a diffusion process at this high homologous temperature. However given the lack of under-standing of how the dislocation climb mechanism operates in Fe30Ni at 1000C under the deformation conditions investigated in this study (relatively high strain rate), a simplified dislocation slip-based constitutive equation has been used. Despite all these sources of uncertainty the three dimensional grain structure is however believed to be the main cause of disagreement between simulation and experimental results. Therefore, results show the limitation of the CPFE predictions especially for situations involving small grain sizes compared to specimen thickness, and for which the geometry of the subsurface grain structure plays a significant role on the distribution of surface strains as reported inTurner et al. (2013).Zhang et al. (2015a), who investigated the deformation of the microstructure of a titanium alloy during tensile testing at room temperature using CPFE modelling, concluded that a geometrically realistic grain morphology, revealed through differential-aperture X-ray microscopy in their work, and physically meaningful boundary conditions applied to the model, were more important than fine-tuning the constitutive model parameters in order to accurately simulate heterogeneous deformation processes at the grain scale. This is in line with results obtained in this work and explains why the high temperature simulations could not predict accurately intra-granular strain distributions due to lack of knowledge about the geometry of the microstructure along the out-of-plane direction inFig. 6. However, high homologous temperature texture results for the aluminium alloy and overall strain frequency histograms obtained at 1000C in this work suggest that the statistical response of a polycrystal aggregate can be reasonably well predicted using the CPFE model while local deterministic predictions appear unrealistic without three dimensional information of the microstructure geometry. Results obtained from this work have, therefore, shown both the capability and limitations of CPFE simulations and provide confidence into the statistical prediction of microstructure evolution in metals deformed at high homologous temperatures typical of hot forming operations. The model could also be, in principle, further improved by using more physically-based constitutive equations, such as those investigated in this work, to predict the response of hot deformed materials at temperatures different from those used for calibration of the hardening parameters, provided that a sufficient number of measured stress/strain curves is available for this calibration.
7. Conclusion
carried out on a AA5052 aluminium alloy deformed at 300C using a PSC test has shown that deformation texture simulations can predict quantitatively the main texture components of FCC metals (Copper, S, Brass and Goss in order of intensity). A second case study carried out on an austenitic steel deformed at 1000C through a PSC test, with a new experimental procedure developed to measure intra-granular strain distributions using microgrids in combination with EBSD measure-ments, has shown the limitation of deterministic CPFE simulations. The small grain size to specimen thickness ratio prevented successful results in terms of strain map prediction while overall statistical results, even though slightly under-predicted, were reasonably simulated. The third case study corresponding to a tensile test carried out on the same steel inside a SEM with intra-granular strain distributions measured using microgrids showed that the CPFE model can predict reliably not only the statistical response of the polycrystal in terms of strain frequency distributions but also the main deformation features observed experimentally in the form of localised deformation bands running along grain boundaries. Clear discrepancies between model and experimental results have however been observed and are believed to be due to three dimensional effects not captured by the simplified geometry of the grain structure through the thickness of the sample in the model. This effect is further enhanced at high temperature where the grain size to specimen thickness ratio is very small. Overall this study has therefore provided confidence in the potential for using CPFE simulations for the prediction of the high temperature behaviour of metals during metal forming operations in terms of polycrystals deformation. Distributions of internal variables, such as the energy stored during deformation for instance, can then be used with subsequent simulations of recrystallization or phase transformation for the prediction of microstructure evolution during the hot processing of metals.
Acknowledgements
The authors are grateful for thefinancial support provided by EPSRC under the grants EP/F023464/1 and EP/E063497/1 and to Tata Steel for sponsoring M.F. Kiu and for providing the steel used in this work. They also wish to thank Dr Zulfiqar Husain and Mr Gary Claxton for their help in conducting the tests on the Gleeble machine.
References
Alharbi, H.F., Kalidindi, S.R., 2015. Crystal plasticityfinite element simulations using a database of discrete Fourier transforms. Int. J. Plast. 66, 71e84. Asaro, R.J., 1983. Micromechanics of crystals and polycrystals. Adv. Appl. Mech. 23, 1e115.
Asaro, R.J., Needleman, A., 1985. Texture development and strain hardening in rate dependent polycrystals. Acta Metall. 33, 923e953. Asaro, R.J., Rice, J.R., 1977. Strain localization in ductile single crystals. J. Mech. Phys. Sol. 25, 309e338.
Bachu, V., Kalidindi, S.R., 1998. On the accuracy of the predictions of texture evolution by thefinite element technique for FCC polycrystals. Mater. Sci. Eng. A 257, 108e117.
Beyerlein, I.J., Tome, C.N., 2008. A dislocation-based constitutive law for pure Zr including temperature effects. Int. J. Plast. 24, 867e895.
Brahme, A.P., Inal, K., Mishra, R.K., Saimoto, S., 2011. A new strain hardening model for rate-dependent crystal plasticity. Comput. Mater. Sci. 50, 2898e2908. Bunge, H.J., 1982. Texture Analysis in Materials Science. Butterworths, London.
Delaire, F., Raphanel, J.L., Rey, C., 2000. Plastic heterogeneities of a copper multicrystal deformed in uniaxial tension: experimental study andfinite element simulations. Acta Mater. 48, 1075e1087.
Engler, O., Crumbach, M., Li, S.Y., 2005. Alloy-dependent rolling texture simulation of aluminium alloys with a grain-interaction model. Acta Mater. 53, 2241e2257.
Erinosho, T.O., Cocks, A.C.F., Dunne, F.P.E., 2013. Texture, hardening and non-proportionality of strain in BCC polycrystal deformation. Int. J. Plast. 50, 170e192.
Gerard, C., Cailletaud, G., Bacroix, B., 2013. Modelling of latent hardening produced by complex loading paths in FCC alloys. Int. J. Plast. 42, 194e212. Ghadbeigi, H., Pinna, C., Celotto, S., 2012. Quantitative strain analysis of the large deformation at the scale of microstructure: comparison between digital
image correlation and microgrid techniques. Exp. Mech. 52, 1483e1492.
Heripre, E., Dexet, M., Crepin, J., Gelebart, L., Roos, A., Bornert, M., Caldemaison, D., 2007. Coupling between experimental measurements and polycrystal finite element calculations for micromechanical study of metallic materials. Int. J. Plast. 23, 1512e1539.
Huang, Y.G., 1991. A User-material Subroutine Incorporating Single Crystal Plasticity in the ABAQUS Finite Element Program. Harvard University, Massachusetts.
Jeong, Y., Gnaupel-Herold, T., Barlat, F., Iadicola, M., Creuziger, A., Lee, M.G., 2015. Evaluation of biaxialflow stress based on elasto-viscoplastic-self-consistent analysis of X-ray diffraction measurements. Int. J. Plast. 66, 103e118.
Khan, A.S., Liu, J., Yoon, J.W., Nambori, R., 2015. Strain rate effect of high purity aluminium single crystals: experiments and simulations. Int. J. Plast. 67, 39e52.
Kabirian, F., Khan, A.S., Gnaupel-Herlod, T., 2015. Visco-plastic modelling of mechanical responses and texture evolution in extruded AZ31 magnesium alloy for various loading conditions. Int. J. Plast. 68, 1e20.
Kalidindi, S.R., Bhattacharyya, A., Doherty, R., 2004. Detailed analyses of grain-scale plastic deformation in columnar polycrystalline aluminium using orientation image mapping and crystal plasticity models. Proc. R. Soc. Lond. A 460, 1935e1956.
Kalidindi, S.R., Donohue, B.R., Li, S., 2009. Modeling texture evolution in equal channel angular extrusion using crystal plasticityfinite element models. Int. J. Plast. 25, 768e779.
Kanjarla, A.K., Van Houtte, P., Delannay, L., 2010. Assessment of plastic heterogeneity in grain interaction models using crystal plasticityfinite element method. Int. J. Plast. 26, 1220e1233.
Kluseman, B., Svendsen, B., Vehoff, H., 2012. Investigation of the deformation behaviour of Fe-3%Si sheet metal with large grains via crystal plasticity and finite-element modelling. Comp. Mater. Sci. 52, 25e32.
Kluseman, B., Svendsen, B., Vehoff, H., 2013. Modeling and simulation of deformation behaviour, orientation gradient development and heterogeneous hardening in thin sheets with coarse texture. Int. J. Plast. 50, 109e126.
Knezevic, M., McCabe, R.J., Tome, C.N., Lebensohn, R.A., Chen, S.R., Cady, C.M., Gray III, G.T., Mihaiha, B., 2013. Modeling mechanical response and texture evolution ofa-Uranium as a function of strain rate and temperature using polycrystal plasticity. Int. J. Plast. 43, 70e84.
Knezevic, M., Beyerlein, I.J., Lovato, M.L., Tome, C.N., Richards, A.W., McCabe, R.J., 2014. A strain-rate and temperature dependent constitutive model for BCC metals incorporating non-Schmid effects: application to Tantalum-Tungsten alloys. Int. J. Plast. 62, 92e104.
Lan, Y.J., Xiao, N.M., Li, D.Z., Li, Y.Y., 2005. Mesoscale simulation of deformed austenite decomposition into ferrite by coupling a cellular automaton method with a crystal plasticityfinite element model. Acta Mater. 53, 991e1003.
Li, S.Y., Van Houtte, P., Kalidindi, S.R., 2004. A quantitative evaluation of the deformation texture predictions for aluminium alloys from crystal plasticity finite element method. Modell. Simul. Mater. Sci. Eng. 12, 845e870.
Lim, H., Carroll, J.D., Bataille, C.C., Buchheit, T.E., Boyce, B.L., Weinberger, C.R., 2014. Grain-scale experimental validation of crystal plasticityfinite element simulations of tantalum oligocrystals. Int. J. Plast. 60, 1e18.
Lim, H., Lee, M.G., Kim, J.H., Adams, B.L., Wagoner, R.H., 2011. Simulation of polycrystal deformation with grain and grain boundary effects. Int. J. Plast. 27, 1328e1354.
Loveday, M.S., Mahon, G.J., Roebuck, B., Lacey, A.J., Palmiere, E.J., Sellars, C.M., van der Winden, M.R., 2006. Measurement offlow stress in hot plane strain compression tests. Mater. High Temp. 23, 85e118.
M'Guil, S., Wen, W., Ahzi, S., Gracio, J.J., Davies, R.W., 2015. Analysis of shear deformation by slip and twinning in low and high/medium stacking fault energy FCC metals using thef-model. Int. J. Plast. 68, 132e149.
Martin, G., Caldemaison, D., Bornert, M., Pinna, C., Brechet, Y., Veron, M., Mithieux, J.D., Pardoen, T., 2013. Characterization of the high temperature strain partitioning in duplex steels. Exp. Mech. 53, 205e215.
Martin, G., Sinclair, C.W., Lebensohn, R.A., 2014. Microscale plastic strain heterogeneity in slip dominated deformation of magnesium alloy containing rare earth. Mater. Sci. Eng. A 603, 37e51.
Mecking, H., Kocks, U.F., 1981. Kinetics offlow and strain hardening. Acta Metall. 29, 1865e1875.
Mu, S., Tang, F., Gottstein, G., 2014. A cluster-type grain interaction deformation texture model accounting for twinning-induced texture and strain hardening evolution: application to magnesium alloys. Acta Mater. 68, 310e324.
Musienko, A., Tatschl, A., Schmidegg, K., Kolednik, O., Pippan, R., Cailletaud, G., 2007. Three-dimensionalfinite element simulation of a polycrystalline copper specimen. Acta Mater. 55, 4121e4136.
Pandey, A., Khan, A.S., Kim, E.Y., Choi, S.H., Gnaupel-Herold, T., 2013. Experimental and numerical investigations of yield surface, texture, and deformation mechanisms in AA5754 over low to high temperatures and strain rates. Int. J. Plast. 41, 165e188.
Peirce, D., Asaro, R.J., Needleman, A., 1982. An analysis of nonuniform and localized deformation in ductile single crystals. Acta Metall. 30, 1087e1119. Pokharel, R., Lind, J., Kanjarla, A.K., Lebensohn, R.A., Li, S.F., Keneisi, P., Suter, R.M., Rollett, A.D., 2014. Polycrystal plasticity: comparison between grain-scale
observations of deformation and simulations. Annu. Rev. Condens. Matter. Phys. 5, 317e346.
Popova, E., Staraselski, Y., Brahme, A., Mishra, R.K., Inal, K., 2015. Coupled crystal plasticityeprobabilistic cellular automata approach to model dynamic recrystallization in magnesium alloys. Int. J. Plast. 66, 85e102.
Quey, R., Dawson, P.R., Driver, J.H., 2012. Grain orientation fragmentation in hot deformed aluminium: experiment and simulation. J. Mech. Phys. Sol. 60, 422e445.
Raabe, D., Sachtleber, M., Zhao, Z., Roters, F., Zaefferer, S., 2001. Micromechanical and macromechanical effects in grain scale polycrystal plasticity exper-imentation and simulation. Acta Mater. 49, 3433e3441.
Radhakrishnan, B., Sarma, G.B., Zacharia, T., 1998. Modelling the kinetics and microstructural evolution during static recrystallizationeMonte Carlo simulation of recrystallization. Acta Mater. 46, 4415e4433.
Rollett, A.D., Raabe, D., 2001. A hybrid model for mesoscopic simulation of recrystallization. Comp. Mater. Sci. 21, 69e78.
Rossiter, J., Brahme, A., Simha, M.H., Inal, K., Mishra, R., 2010. A new crystal plasticity scheme for explicit time integration codes to simulate deformation in 3D microstructures: effects of strain path, strain rate and thermal softening on localized deformation in the aluminium alloy 5754 during simple shear. Int. J. Plast. 26, 1702e1725.
Rotters, F., Eisenlohr, L., Hantcherli, L., Tjahjanto, D.D., Bieler, T.R., Raabe, D., 2010. Overview of constitutive laws, kinematics, homogenization and multiscale methods in crystal plasticityfinite-element modeling: theory, experiments, applications. Acta Mater. 58, 1152e1211.
Sabnis, P.A., Forest, S., Arakere, N.K., Yastrebov, V.A., 2013. Crystal plasticity analysis of cylindrical indentation on a Ni-base single crystal superalloy. Int. J. Plast. 51, 200e217.
Sarma, G.B., Dawson, P.R., 1996. Texture predictions using a polycrystal plasticity model incorporating neighbour interactions. Int. J. Plast. 12, 1023e1054. Silk, N.J., van der Winden, M.R., 1999. Interpretation of hot plane strain compression testing of aluminium specimens. Mat. Sci. Tech. 15, 295e300. St-Pierre, L., Heripr e, E., Dexet, M., Crepin, J., Bertolino, G., Bilger, N., 2008. 3D simulations of microstructure and comparison with experimental
micro-structure coming from O.I.M analysis. Int. J. Plast. 24, 1516e1532.
Sutton, M.A., Turner, J.L., Bruck, H.A., Chae, T.A., 1991. Full-field representation of discretely sampled surface deformation for displacement and strain analysis. Exp. Mech. 31, 168e177.
Takaki, T., Tomita, Y., 2010. Static recrystallization simulations starting from predicted deformation microstructure by coupling multi-phase-field method andfinite element method based on crystal plasticity. Int. J. Mech. Sci. 52, 320e328.
Takaki, T., Yoshimoto, C., Yamanaka, A., Tomita, Y., 2014. Multiscale modelling of hot-working with dynamic recrystallization by coupling microstructure evolution and macroscopic mechanical behaviour. Int. J. Plast. 52, 105e116.
Tamini, S., Correia, J.P., Lopes, A.B., Ahzi, S., Barlat, F., Gracio, J.J., 2014. Asymmetric rolling of thin AA-5182 sheets: modelling and experiments. Mater. Sci. Eng. A 603, 150e159.
Torres, E.A., Montoro, F., Righetto, R.D., Ramirez, A.J., 2014. Development of high-temperature strain instrumentation for in situ SEM evaluation of ductility dip cracking. J. Microsc. 254, 157e165.
Turner, T.J., Shade, P.A., Schuren, J.C., Groeber, M., 2013. The influence of microstructure on surface strain distributions in a nickel micro-tension specimen. Modell. Simul. Mater. Sci. Eng. 21, 015002.
Van Houtte, P., Delannay, L., Kalidindi, S.R., 2002. Comparison of two grain interaction models for polycrystal plasticity and deformation texture prediction. Int. J. Plast. 18, 359e377.
Xie, Q., Van Bael, A., Sidor, J., Moerman, J., Van Houtte, P., 2014. A new cluster-type model for the simulation of textures of polycrystalline metals. Acta Mater. 69, 175e186.
Zhang, C., Li, H., Eisenlohr, P., Liu, W., Boehlert, C.J., Crimp, M.A., Bieler, T.R., 2015a. Effect of realistic 3D microstructure in crystal plasticityfinite element analysis of polycrystalline Ti-5Al-2.5Sn. Int. J. Plast. 69, 21e35.
Zhang, K., Holmedal, B., Hopperstad, O.S., Dumoulin, S., Gawad, J., Van Bael, A., Van Houtte, P., 2015b. Multi-level modelling of mechanical anisotropy of commercial pure aluminium plate: crystal plasticity models, advanced yield functions and parameter identification. Int. J. Plast. 66, 3e30. Zhang, L., Rollett, A.D., Bartel, T., Wu, D., Lusk, M.T., 2012. A calibrated Monte Carlo approach to quantify the impacts of misorientation and different driving
forces on texture development. Acta Mater. 60, 1201e1210.
Zhao, Z., Ramesh, M., Raabe, D., Cuitino, A.M., Radovitzky, R., 2008. Investigation of three-dimensional aspects of grain-scale plastic deformation of an aluminium oligocrystal. Int. J. Plast. 24, 2278e2297.