A
D
ATA
Q
UALITY
M
EASUREMENT
I
NFORMATION
M
ODEL
BASED ON
ISO/IEC
15939
(Research-in-Progress)
Ismael Caballero, Eugenio Verbo
Department of Research & Development (Indra Software Factory, S.L.U.) Indra-UCLM Research and Development Institute
Ronda de Toledo s/n – 13003 Ciudad Real, Spain {icaballerom, emverbo}@indra.es
Coral Calero, Mario Piattini
Department of Information Technologies and Systems (UCLM) Indra-UCLM Research and Development Institute Paseo de la Universidad 4 – 13071 Ciudad Real, Spain
{Coral.Calero, Mario.Piattini}@uclm.es
Abstract: Measurement is a key activity in DQ Management. Through DQ literature, one can discover a lot of proposals contributing somehow to the measurement of DQ issues. Looking at those proposals, it can be found out that there is a lack of unification of the nomenclature: different authors call to the same concepts in different way, or even, they do not explicitly recognize some of them. This may cause a misunderstanding of the proposed measures. The main aim of this paper is to propose a Data Quality Measurement Information Model (DQMIM) which provides a standardization of the referred terms by following ISO/IEC 15939 as a basis. This paper deals about the concepts implied in the measurement process, not about the measures themselves. In order to make operative the DQMIM, we have also designed a XML Schema which can be used to outline Data Quality Measurement Plans. Key Words: Data Quality Measurement, ISO/IEC 15939, Data Quality Measurement Information Model
1.
I
NTRODUCTION
Typically, an organization realizes about their data quality (hereafter DQ) problems when they have just affected negatively to the business performance. Once this has occurred, executives would quantify the impact of these DQ problems [17] to several levels (organizational, economic, customer satisfaction, or employee satisfaction) in order to be able to classify them and to outline DQ improvement plans.
Any DQ improvement plan must begin with the assessment of the affected scenarios to identify the common roots of the detected problems. The assessment involves having values for DQ measures. The main intention of these measures is to provide a quantitative meaning about how much data quality dimensions are achieved in order to enable an adequate management [10]. Although DQ literature counts with a great amount of measurement proposals, it has still a lot of open researching challenges [3].
We think that one of these challenges consists of the unification of the different terms provided by different authors for the same concepts. In order to achieve this goal, an international standard about measuring could be a good starting point. ISO/IEC 15939 [16] has been selected for this proposal due to the similar characteristics that software and data share. The standard defines a Measurement Information Model (MIM), which is the basis for the Data Quality Measurement Information Model (DQMIM), described through section 2. Any data quality model composed, even a future standard containing the most comprehensive and universal applicable set of data quality dimensions, could be used together DQMIM, since it simply proposes a way to name the concepts participating in the measurement of the dimensions. Please, note that the aim of this paper is not to develop data quality measures, but providing a common nomenclature from measurement concepts to make easier the process of defining them.
view of this role. As several roles will have different views of the same data, this must be carried out from its data store and completed with corresponding metadata according to the selected data quality dimensions and the point of view of the role. Section 3 covers the development of an XML Schema, named DQXSD, for supporting the storage of data together with its metadata. In order to make operative (computationally usable) the DQMIM, a compatible data structure must be developed. As XML is one of the trendy and preferred formats of data interchange, we have developed a Schema for DQ Measures, named DQMIM-XSD, which is described and exemplified in section 4. Finally, section 5 outlines the main conclusions about this work and shows which are our future intentions.
2.
A
D
ATA
Q
UALITY
M
EASUREMENT
I
NFORMATION
M
ODEL
2.1. Review of the related Data Quality Measurement literature.
Although many works related to measurement have been referenced through literature, we have chosen the ones defined by [8, 17, 19, 21, 29] after having performed a systematic review of the associated literature. These works are found as having the most representative proposals; although when necessary, others works have also been taken into account. For instance, although we have assumed that [17] could gather and supersede previous works by MIT people, like the one by [26], there are other works that have been also studied and referenced, like [35].
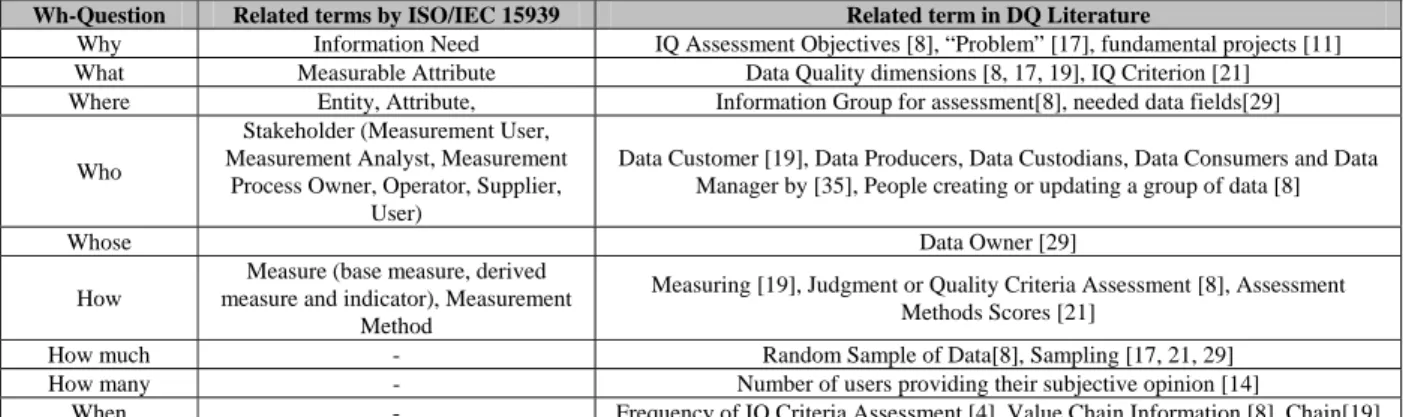
After comparing the different measurement proposals of the mentioned authors, we thought that a good strategy for performing the investigation would consist in following a wh-questions analysis in order to depict a list of the used terms for the measurement concepts. In order to align the DQMIM to the working standard, the same terms used in it are proposed to be used for the DQ measurement concepts in DQMIM Table 1 shows by columns the wh-question, the terms provided by ISO/IEC 15939 and a third column with the possible equivalent terms found in the literature. It is not within the scope of this paper to define a standard measurement process or a methodology for defining measurement plans in order to depict specific measures for each data quality dimension using DQMIM.
Wh-Question Related terms by ISO/IEC 15939 Related term in DQ Literature
Why Information Need IQ Assessment Objectives [8], “Problem” [17], fundamental projects [11] What Measurable Attribute Data Quality dimensions [8, 17, 19], IQ Criterion [21]
Where Entity, Attribute, Information Group for assessment[8],needed data fields[29]
Who
Stakeholder (Measurement User, Measurement Analyst, Measurement
Process Owner, Operator, Supplier, User)
Data Customer [19], Data Producers, Data Custodians, Data Consumers and Data Manager by [35], People creating or updating a group of data [8]
Whose Data Owner [29]
How
Measure (base measure, derived measure and indicator), Measurement
Method
Measuring [19], Judgment or Quality Criteria Assessment [8], Assessment Methods Scores [21]
How much - Random Sample of Data[8], Sampling [17, 21, 29] How many - Number of users providing their subjective opinion [14]
When - Frequency of IQ Criteria Assessment [4], Value Chain Information [8], Chain[19]
Table 1. Wh-Analysis for the DQ Measurement terms (running terms) found in the literature.
To gain clarity for our explanations, let us introduce an example to illustrate the running terms: Imagine that we have an RSS document containing news published by an electronic newspaper in Internet. The news has been purchased from a news provider. We are asked to determine if the news is reliable and complete. In order to achieve this goal, several measurements and acceptance range might be described. In this working example, we would follow an ideal standard measurement process oriented to depict the corresponding measures and ranges. We would first like to know from a Data Quality User
Requirement Specification (DQ-URS) why it is required to determine if the news accomplishes or not the two given requirements. Then, we need to know what “reliable” and “complete” mean for our interlocutors, and how we can measure how much reliable and how much complete the news is. Next, we would have to obtain the corresponding measures from the RSS file. Finally, the ideal standard measurement process would finish by reporting to our interlocutors the results of having compared the measures against the acceptance ranges.
Across following subsections, an analysis of the answers to these wh-questions is performed to develop the DQMIM. At the beginning of each subsection (see tables 2, 3 and 4), a table, containing a selection of the running terms from ISO/IEC 15939 and their equivalent in DQ field when exits, introduces the terms which are going to be dealt in each subsection.
2.2. Why to measure.
Table 2. Concepts from ISO/IEC 15939 used to model the ‘Why’ Question. [16]
Although it may seem too obvious, we think that our first task in performing the DQMIM might be to review the meaning of the concept “measure”. According to ISO/IEC 15939, measure is “to make a set of operations having the object of determining a value of a quantitative or categorical representation of one or more attributes” But “measurements should have a clearly defined purpose”. This purpose for measuring the data quality of a scenario is to satisfy an “information need” to manage objectives, goals, risks and problems (see Table 2). The terms “metric” should be no longer used as synonymous of “measure (noun)” according to the standard.
Knowing the information needs, a measurement plan can be drawn to determine (a) what measure, (b) where the objects to measure are, (c) how to measure these objects, (d) how many objects are necessary to inspect in order to have a statistically significant evidence about the degree of satisfaction of information need, (e) who must design and implement the measurement procedures, (f) whose the objects to measure are, (g) to whom results must be delivered and finally (h) when measures might be done, so as to not interfere in any of the measurement or information manufacturing process.
In DQ field, there are some equivalences for the term “information need”: [8] provides the term “information quality assessment objectives”. Examples of these information needs provided by this author are “understand the state of quality in a database”, “identify information manufacturing processes requiring improvement”, or “assess a certain data quality dimension”; or as [22] propose, measure the problems of a relational database. [11] identify four types of fundamental projects as information needs. In our working example, our interlocutors want to measure the reliability and completeness of the news because these two factors are demonstrated to be very important for their business (e.g. a quality opinion poll to their readers has reflect them as the most critical factors to visit the web). So, their information need would be clearly described as follows: “Interlocutors want to know whether the data quality of the news published in their web satisfies their customers”.
Concept Meaning in ISO/IEC 15939 DQ Term Information need An insight necessary to manage objectives, goals, risks and problems
IQ Assessment Objectives [8], “Problem” [17], fundamental projects [11] Measure (verb) To make a measurement
Measure (noun) A quantitative or categorical representation of one or more attributes. Measurement A set of operations having the object of determining a value of a measure.
Metrics [8, 17, 19], Measures[8, 29]
2.3. What and Where to measure.
ISO 15939 Concept Meaning in ISO 15939 DQ Field Measurable
Concept
A concept whose measurement satisfies different information needs
Data Quality dimensions [8, 17, 19], IQ Criterion [21]
Measurable Attribute A property or characteristic of an entity that can be distinguished
qualitatively by human or automated means Information Group for Assessment [8] Data Store An organized and persistent collection of data that allows its
retrieval
Relational Database, Object Relational, XML, Spreadsheet.
Entity An object that is to be measured Data Models, Data Values, Data Policies,
Table 3. Concepts from ISO/IEC 15939 used to model the ‘What’ and ‘Where’ Questions. [16]
As previously said, a person responsible for assessing and improving data quality must analyze the Data Quality User Requirements Specification (DQ-URS) looking for what is required to measure and where
the objects to be measured are. The response to the “what” question are the “measurable concepts” (ISO/IEC 15939) for the “measurable attributes” of the “entities” which users consider to be implied in the measurement process. Measurable concepts are what in DQ field have been traditionally named as
data quality dimensions. Perhaps, this is one of the most treated concept in the literature because it is the basis to understand what DQ means to the different users [28]. Descriptions of DQ dimensions and discussions about which are the most important ones can be found among others in [1, 3, 8, 9, 13, 17]. A lot of researchers have identified the dimensions that best fit to their problem. But there is still not a universal set of DQ dimensions valid for any context neither an exhaustive set of measures for these dimensions [6]. Anyway, the classification of DQ dimensions proposed by [31] is highly recommended as starting point for most DQ managers who are working to find out the dimensions that are the most suitable for their particular information needs. Although it is not the aim of this paper to provide another set of data quality dimensions, we claim for a universal one.
In our working example (news), the measurable concepts are “reliability” and “completeness”. Attending to our interlocutors requirements, we have understood “reliability” as the “extent to which news comes from a reliable source” whereas “completeness” can be interpreted as “extent to which news has data for all of the identified fields”
And by finalizing this part, the relationship between “information needs” and “measurable concept” could be established as “one information need could have one or more measurable concepts”.
The response to the “where” question is “the entities that have measurable attributes”. The possible measurable attributes can be any of the identified by [19]. In order to gain generality, let’s name data store (according to ISO/IEC 15939) to any “category of entities” devoted to store or to present data (e.g. any relational database, or any XML document). [8] refers to files or processes to be assessed.
Although it is assumed that entities refer mainly to data stores, there are others which are susceptible to be measured. Following paragraphs provide a discussion about the measurable attributes identified by [19]. Depending on the kind of attributes to be measured, some entities are susceptible to have measures classified as structural (data models, data presentation and data quality policies) or derived by their content (data values and data domains) [10].
For the case of data models, a distinction could be done between conceptual models and logical models. For conceptual models, measurable concepts can be found in the works of [2, 30] and related measures are covered by [12, 18, 20, 25]. For the logical model, measures proposals can be found in [5, 24]. Please, realize that while previous works could not treat directly data quality of the data values, the main results can be used as a basis for defining measures.
On the other hand data quality measurements for data values are intended to get values about data contained in data stores. As this has been one of the main focuses of the DQ literature, it has been widely studied.
A value for a data is always taken from a data domain. If domains are not correctly defined, data store can be populated with incorrect data. Since a data domain is itself a set of data, it is possible to measure its data quality trough measurable concepts like completeness or accuracy [29].
Other important category of entities which must be highlighted is that one dedicated to present data to users: the user interfaces devoted to data presentation. Since they are the main user contact with data, the way in which data is showed must be also measured. For instance, the works by [7] are oriented to measure the data quality of the web portals as being user interfaces.
Finally, facts demonstrate that DQ is preferably attainable through management by integrating corresponding managerial actions into the organizational context through organizational DQ policies [17]. The DQ organizational policies are a way to “universalize” learned lessons through experiences regarding to how manage DQ measurable concepts, DQ risks, and how to modify data and process models to align it to “best DQ practices”. [19] propose to measure the quality of the organizational policies from the point of view of DQ.
The existing relation between “measurable concepts” and “entities” is that “a measurable concept can involve one or more measurable attributes belonging to an entity”.
For the working example, the entity is the RSS document (an XML one), while the measurement attributes are data values, which can be found in the elements with their corresponding attributes (“elements” and “attributes” are here defined as a part of an XML file [32]).
2.4. Who must measure and whom entities to be measured belong to.
ISO 15939 Concept Meaning in ISO 15939 DQ Field
Stakeholder An individual or organization that sponsors measurements and provides data
or is a user of the measurement results.
People creating or updating a group of data[8]; Collector, custodians,
consumer [17]; Data Customer, Data Manager and Data Manufacturer, Data Supplier [35];
Table 4. Concepts from ISO/IEC 15939 used to model the ‘What’ and ‘Where’ Questions. [16]
In order to assess and improve DQ in an organization, it is necessary that a team charged with enough knowledge and responsibilities on both information manufacturing and data quality management processes identify all the “stakeholders” involved in the measurement process. The functions of these stakeholders depend on their role on data. [35] identifies as possible roles for stakeholders: “Information Supplier”, “Information Manufacturer”, “Information Consumer”, and “Information Managers” (here, author uses indistinctly “data” and “information”). It is up to Information Managers to design, lead and obtain conclusions about the results of the measurement process. [19] recommends to identify data consumers as a key to perform a successful assessment, highlighting that not all data consumers are necessarily humans, but other processes working on the same or different information systems. [29] proposes not only to identify the data consumers (or customers) but also, learning how they use data to determine required features and required quality levels. The same measurable concepts could be measured in different ways depending on the role: two different roles may require the same measurable concepts but with different information need.
When designing the measurement process, the DQ measurement team must take into account to whom entities containing data to be measured belong. This kind of stakeholders is called “data owners”. This fact is important because, sometimes, data is only measurable by its owner(s) or by people having been granted access to it.
For the working example, the “data supplier” is the news provider, the “data consumers” are the customers or readers of the electronic newspaper; the “data manufacturer” is the set of processes that get the news from the news provider and format it and show it to the data consumers; and finally “data managers” and “data owners” are our interlocutors.
2.5. How to measure and How much data is involved in the measurements.
ISO 15939 Concept Meaning in ISO 15939 DQ Term Base measure An attribute and the method for quantifying it. Metric, Measure
Derived measure A measure that is defined as a function of two or more base measures Metric, Measure
Decision criteria Numerical threshold or targets used to determine the need for action or further
investigation, or to describe the level of confidence in a given result. Indicator
Function An algorithm or calculation performed to combine two or more base measures. -
Indicator An estimate or evaluation of specified attributes derived from a model with
respect to defined information need. -
Measure A quantitative or categorical representation of one or more attributes. Metric, Measure
Measurement A set of operations having the object of determining a value of a measure -
Measurement method A logical sequence of operations, described generically, used in quantifying an
attribute with respect to a specified scale. -
Measurement procedure
A set of operations, described specifically, used in the performance of a
particular measurement according to a given method -
Model An algorithm or calculation combining one or more base and/or derived
measures with associated decision criteria. -
Observation An instance of applying a measurement procedure to produce a value for a
base measure. -
Scale An ordered set of values, continuous or discrete, (or a set of categories) to
which the attribute is Scale [27]
Type of method
The type of method depends on the nature of the operations used to quantify an attribute. Two types of method may be distinguished: Subjective (quantification involving human judgement) and Objective (quantification
based on numerical rules)
-
Unit of measurement
A particular quantity defined and adopted by convention, with which other quantities of the same kind are compared on order to express their magnitude
relative to that quantity.
-
Value. A numerical or categorical result assigned to a base measure, derived measure
or indicator. Metric, Measure
Table 5. Concepts from ISO/IEC 15939 used to model the ‘What’ and ‘Where’ Questions. [16]
This is likely the issue requiring more attention than any other. Once one or more measurable concepts for each information piece need to have been identified from DQ-URS and, being clear where the measurable attributes belonging to the corresponding entities are, the next step is to define the measures themselves. ISO/IEC 15939 classifies measures as follows: “base measure”, “derived measure” and “indicators” (see Table 5). The way of how a measurable concept is really measured is implemented through the
measurement method on the measurable attributes. The standard identifies two kinds of measurement methods: objective and subjective. In DQ field, this difference has also been observed by several authors like [27]. Due to the subjective character of data quality, it is important to stress the difference between the concepts of measurement (“measurement is the act of assigning a number to an attribute of an object being observed”) vs assessment (“the classification of someone or something with respect to its worth”). Whereas the first term is intended to define and operate with quantitative values (possible “types of scales” are ratio or interval), the last is intended to define and manage qualitative values (possible type of scale are mainly ordinal, since nominal has no sense in this context because it would only allows a classification, but not an assessment because it lacks the idea of order).
For each measure, a scale (which implies to select a domain of possible values) and unit of measurement
must be provided. Table 6 shows the particularization of these terms for our working example.
Since data quality is a subjective concept, and the treatment of its subjectivity has been longer discussed through literature, it is worthy to slowly analyze this issue. According to DQ literature, typical DQ measurement methods for data values are enunciated by implementing a formula like the following one [3, 17]:
Measurable Concepts
DQMIM element Completeness Reliability
Measure Completeness (NewsInRssDocument) Reliability (NewsInRssDocument) Measurement Method “Compute the ratio of news (elements) having values for
all of the defined items” “Compute the ratio of news having a reliable source”
Scale Ratio Ratio
Domain of values [0, 1] [0, 1]
Unit of measurement “Number of pieces of news having values for all
attributes”. “Number of pieces of news being reliable”.
Table 6. Measurable concepts for the working Example
In the previous formula, a derived measured is depicted. The formula corresponds to the “measurement
function”. The measure is composed by two base measures: a
NumberOfDataUnitNotSatisfyingACriterion and a TotalNumbersOfDataUnits. The measurement method for the former is objective: it simply consists in counting the number of data units accomplishing the criterion. This criterion is usually a business rule [8, 19, 35]. The result of deciding if the data unit satisfies the criterion can be “True” or “False”. So, in order to obtain a value for the
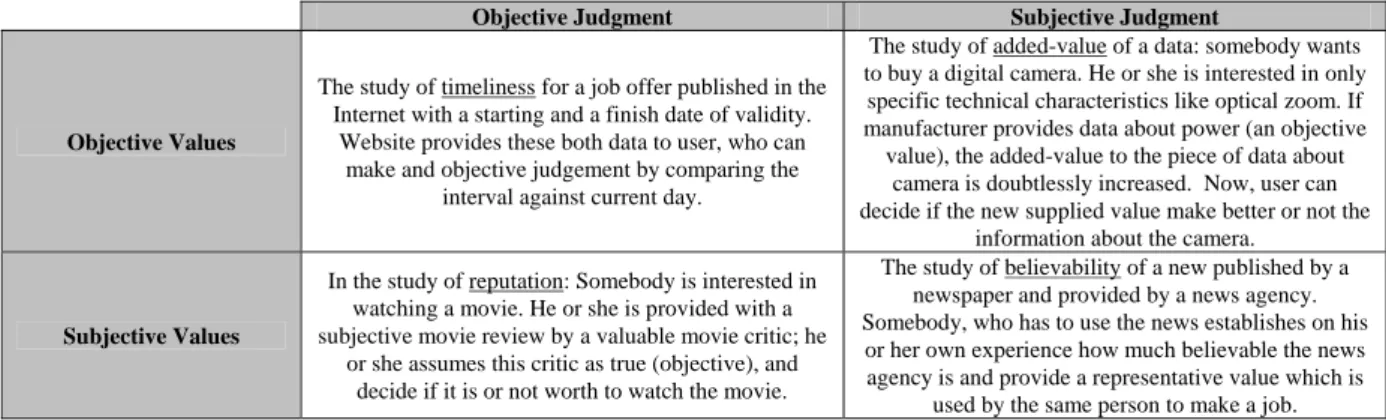
NumberOfDataUnitNotSatisfyingACriterion measure, a count of data unit having obtained a “true” value must be performed. The intrinsic difficulty is addressed at deciding if the data unit satisfies or not the criterion. To make a decision, a rule is needed. This rule can consists of objective or subjectively determining if a value related to the data unit belongs to its given domain. Sometimes, the same data unit contains information enough to make a judge, whereas other times, metadata completing the data unit meaning in the address of the measurable concept is necessary. [21] identifies the following as possible sources for values of metadata: a stakeholder, the information manufacturing process or even the same data store. Different authors in DQ field agree that values for metadata coming from a user are likely subjective, while the coming ones from the data stores are objectives. Table 7 shows several examples of scenarios with different kind of judgments.
Objective Judgment Subjective Judgment
Objective Values
The study of timeliness for a job offer published in the Internet with a starting and a finish date of validity.
Website provides these both data to user, who can make and objective judgement by comparing the
interval against current day.
The study of added-value of a data: somebody wants to buy a digital camera. He or she is interested in only specific technical characteristics like optical zoom. If manufacturer provides data about power (an objective value), the added-value to the piece of data about
camera is doubtlessly increased. Now, user can decide if the new supplied value make better or not the
information about the camera.
Subjective Values
In the study of reputation: Somebody is interested in watching a movie. He or she is provided with a subjective movie review by a valuable movie critic; he
or she assumes this critic as true (objective), and decide if it is or not worth to watch the movie.
The study of believability of a new published by a newspaper and provided by a news agency. Somebody, who has to use the news establishes on his
or her own experience how much believable the news agency is and provide a representative value which is
used by the same person to make a job.
Table 7. Examples of scenarios where data quality is measured by making a comparison to a provided value. It is very interesting the identification by [21] of different methods for generating values for metadata according to the measurement concept to be measured and the source of these values (see Table 8). Having metadata is quite helpfully to the assessment process. Sometimes, this metadata can be part of the data model of the data store, and others, the data model need to be extended in order to store it as [23] recommends. Section 3 deals about a proposal for a XML Schema allowing to store data with data quality related metadata for each role participating in the measurement process.
Sometimes, something more than a simple value coming from a base measure or calculated by using a function as a derived measure is required. It is necessary to provide a quantitative interpretation of the measures results. This interpretation might be implemented through a numeric model that allows to
calculate a representative value for a given measurement concept, and some decision criteria to choose whether data is good enough for an application. This is an indicator. This term might not be confused to “quality Indicator” given by [33].
Table 8. Classification of methods for generating metadata to asses Measurement Concept [21]
The relationship established among these terms is the following: a measure can be of one of these types:
base measure, derived measure (includes a function operating with other base and derived measures), and an indicator (includes a model and decision criteria)
Analogously to what we have been doing in previous sections, we are going to illustrate the introduced concepts through our working example. Let’s represent the provided RSS document like relational tuples as shown in Table 9.
CodNews TextOfTheNews DataProduced CodNewsProvider
N001 “A standard containing a set of data quality dimensions has been released”
06/29/2007 MIT News.
N002 “SEI introduces best practices for data quality management into CMMI v2.0”
Null The Data News
N003 “The 1st European Conference on IQ is to be celebrated in Spain in 2009”
05/25/2006 MyPersonalDQBlog.com
Table 9. Data for the working example (news are not necessary true).
For measuring completeness, the measurement method consists of calculating the ratio of elements having no null values. This is a derived measure which can be calculated by applying the following function:
Completeness (NewsInRssDocument) = 1-NumberOfNotcompleteNews/NumberOfNews.
The function is composed by two base measures. The second is a base measure which value can be measured by counting the numbers of pieces of news. It is obvious that the result is 3.
The first, NumberOfNotCompleteNews, can be calculated as an objective judgment on an objective value: “if a piece of news has null values amongst their attributes, then it is not complete; otherwise it is complete”. Applying the judgement, it can be checked that the result is 1. Now, applying the measurement function, the value for the completeness is 0.667 (66.7% of the pieces of news are complete) For evaluating the reliability of the news, let’s suppose a formula like the previous one:
Reliability (NewsInRssDocument) = 1-NumberOfNotReliableNews / NumberOfNews.
MetadataSource Measurement Concept Methods of generating metadata
Believability User Experience Concise Representation User Sampling
Interpretability User Sampling
Relevancy Continuous user assessment
Reputation User Experience
Understandability User Sampling
Subject (user)
Value-Added Continuous user assessment
Completeness Parsing, Sampling
Customer Support Parsing, Contract
Documentation Parsing
Objectivity Expert input
Price Contract
Reliability Continuous assessment
Security Parsing Timeliness Parsing Object
(data store)
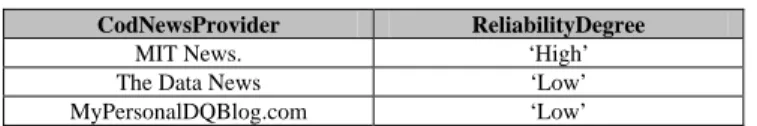
A rule showing how to calculate the reliability degree associated to each News Provider can be enunciated as follows: “if a piece of news has been provided by a News Provider with a ‘low’ reliability degree, then it is reliable; otherwise it is reliable”. It is important to realise that the metadata necessary for assess each NewsProvider is not part of the data model, so it is necessary that a ReliabilityDegree
must be provided (see Table 10).
CodNewsProvider ReliabilityDegree
MIT News. ‘High’
The Data News ‘Low’
MyPersonalDQBlog.com ‘Low’
Table 10. Reliability Degree for each News Provider
By making the comparison of values of Table 9 against value of Table 10 and applying the formula, it is also easy to get the value 0.334 for the reliability (33.4% of the pieces of news are reliable).
In order to illustrate by means of our working example the concept of indicator, let us introduce the following one supporting the information need: DQLevelOfPublishedNews, which is intended to determine the level of the quality of the data provided by the newspaper to its customers (please note that this perception of quality may not be shared by the customers). The model can be enunciated as a pair:
DQLevelOfPublishedNews (Completeness, Reliability), with the decision criteria depicted in Table 11. Acceptance Range values are the thresholds supplied for data managers. Please, note that provided values are proposed only as example.
Completeness [0, 0.8) [0.8, 1] [0, 0.6) “LOW” “ACCEPTABLE”
Reliability
[0.6, 1] “ACCEPTABLE” “HIGH”
Table 11. Decision Criteria for DQLevelOfPublishedNews (values are proposed as example)
As we have obtained a value of 0.667 for completeness and 0.334 for reliability, we can conclude that data showed in Table 9 is “LOW”.
When measuring data values, sometimes it can be nearly impossible to assess all the data due to several reasons, like an unaffordable computational cost of calculating the values for the measures. In these situations, a sample of data must be obtained. The sample must be representative of the population of data in order to successfully extrapolate the results. [8] proposes to extract random samples of data with the same probability of being chosen; the same authors also proposes several data sample design guidelines for different information needs. [29] and [19] also highlight the necessity of sampling the data set. By their side, [17] explain how to determine the size of the sampling in order to limit the amount of error. Anyway, standards like ISO 2859 [15] could be used. Although ISO/IEC 15939 does not include sampling, we prefer to include it in our DQMIM. So “sample size” and “sampling method” are introduced. In our working example, as the numbers of data unit is little enough to make calculations even by hand, it is not necessary to sample the data population.
Table 10 showed values defining a business rule, which could represent the organizational perception of the reliability of the News Provider. These values could be given by only a person or “ranged” from opinions coming from several people. Anyway, the criteria used by a person to decide if the data source ‘MIT News’ has a ‘High Reliability’ level is based on his or her personal connotations with this data source; these connotations are influenced by his or her own experience, external influence, his or her perception of quality,... As there is not an objective way to handle these issues, uncertainty is required to be introduced, as well as a way to manage it. For instance, let us suppose that a ballot on the value of the reliability for each possible news provider has been held; in order to get one representative value for the reliability of each news provider as aggregation of all opinions is necessary. Fundamentals of fuzzy logic could be used. In this sense, [14] propose a method to obtain aggregates applied to the data quality field. DQMIM could model this issue as a simple measurement method: the complexity is not given by the
measure, but for the way to calculate a “mean” representing the opinion of the stakeholder involved in deciding the subjective value for the metadata.
In our working example, values provided in Table 10 have been aggregated by consensus of the authors.
2.6. When to measure.
Although ISO/IEC 15939 does not identify when a measurement must be performed, it is really an important issue which is worth to be included in this study. In each point of its life cycle [30], data is used by different roles having different requirements on it for the tasks assigned to those roles. [8] suggests to identify the information value and the cost chain, what implies that for each role, data has different value at different moments. Therefore, performed measurement may have a different meaning.
On the other side, [19] distinguishes between a static and a dynamic way to make the measurement. We have interpreted the dynamic way as a set of static measures performed at different points of the data life cycle. It could be like to take different snapshots for tracking the different data quality value through information system. [29] recommends to identify the right moment in which measurement must be done in order to minimize cost in resources terms. So, in order to have a complete idea of what each measurement represents, it is necessary to contextualize the measurement in a given time.
In our working example, the measurable concepts are measured before data is to be deployed to consumers.
3.
A
XML
S
CHEMA FOR
S
TORING
D
ATA TOGETHER
M
ETADATA
As said in section 2.5, each stakeholder requiring to develop or to use measures on data values for developing a work, needs the set of data to be measured for their work. It is likely that each one of this piece of data needs to be completed with some metadata contributing somehow with a special meaning for the measurable concept in the work that s/he is developing. [23] recommends that measures about data quality should be stored with the data model, in order to be easily reused by other measurement processes. But having into account that different roles can require different values of metadata for each measurement process, it seems reasonable that a stakeholder performing a role may have his or her data together his or her own required metadata for his or her specific measurement process. The starting point is the idea proposed by [34], in which, the relational model is extended with an attribute-based data model to store data related to specific data quality measurable concepts. The process is known as tagging. Since the value of a relational attribute is the basic relational data unit, it is necessary to tag data unit requiring metadata at this level. Its principles are built on the notion of what Wand et al., have called “quality indicator”, that it is ‘metadata’. In [34]’s proposal, it is developed a mechanism to facilitate the linkage between an attribute of the data store and its corresponding metadata through the quality key concept. In order to enable the automation of the measurements, a data structure containing data and metadata for each piece of data is required. Since XML is currently the preferred and trendy technology for data interchange, we have thought of using it for bringing together both data and its corresponding metadata for each role. To achieve this goal, we have designed a XML Schema, named DQXSD which allows writing valid XML documents containing data together metadata. The new document will be named DQXML document. As data can come from any data store and metadata can come from any stakeholders, it seems reasonable to develop a new DQXML document for each stakeholder and/or for each information need for a job.
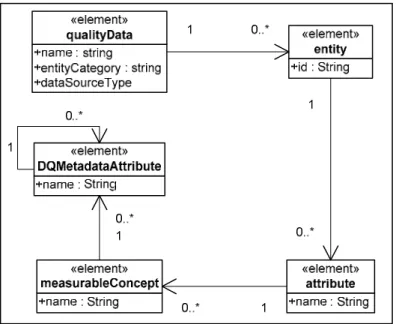
As it can be seen in Figure 1, the main element is qualityData, the root which groups the data values. It is composed by a sequence of entityData elements. Each entityData models an entity (e.g., a tuple from a relational database or an element of an XML document). An entity may be composed of a set of attribute
elements containing the value of the attribute. Up to here, the only thing we have made is to map the data values from its source to a new data structure. The innovation comes here: the attribute is now extended
with a new element measurableConcept which is intended to provide further information for the measurable concept for which metadata is required. As each measurable concept may need several metadata, a new element DQMetadataAttribute is introduced in the XML schema for storing the corresponding metadata.
Figure 1. DQ XSD for storing entity metadata.
As an application example, we have depicted in Table 12, the data showed in Table 9 together the metadata showed in Table 10 from our working example constituting the file DQTaggedNews.XML. Underlined strings are the value for the DQMetadataAttribute which can be used to measure the
measurableConcept.
4.
DQMIM-XSD:
A
XML
S
CHEMA FOR
DQMIM
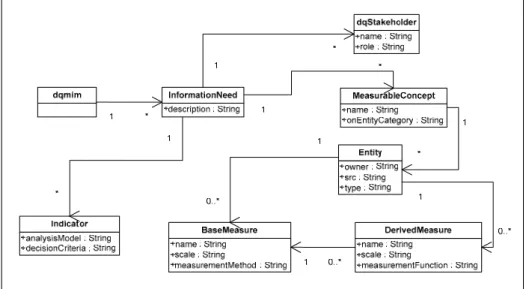
The main aim of this summarizing section is to bring together all related concepts presented through section 2. In order to do so, it has been defined an XML Schema that allows to represent these concepts in an XML document. This schema has been named DQMIM-XSD (see structure in Figure 2 ), and the Xml file obtained by instantiating it, DQMIM XML.
The root element is dqmim that integrates all the concepts. It is composed of a set of InformationNeed
(section 2.2) elements that represents the different information needs that motivates the measurement process. An InformationNeed contains a group of dqStakeholder (section 2.4) element specifying the stakeholder name and its role in the measurement process. A collection of MeasurableConcept (section 2.3) elements are used to specify the different measurable concepts needed to satisfy the information need. Each measurable concept is measured on an entity (section 2.3). This measure can be a
BaseMeasure or DerivedMeasure (both in section 2.5). In a base measure, a measurement method is used and, whereas in a derived method, a measurement function is depicted. Finally, necessary Indicator
<qualityData name=“News” entityCategory= “dataValues” dataSourceType= “text/XML”> <entity id=“N001”>
<attribute name=“TextOfTheNews”> “A standard containing a set of data quality dimensions has been released” </attribute> <attribute name=“ProductionDate">06/29/2007</attribute>
<attribute name= “NewsProvider">MIT News <measurableConcept name=“Reliability”>
<DQMetadataAttribute name= “ReliabilityDegree”>“High”</DQMetadataAttribute> </measurableConcept>
</attribute> </entity>
<entity id="N002">
<attribute name=“TextOfTheNews”>“SEI introduces best practices for data quality management into CMMI v2.0” </attribute> <attribute name= “ProductionDate”></attribute>
<attribute name= “NewsProvider”>The Data News <measurableConcept name=“Reliability”>
<DQMetadataAttribute name= “ReliabilityDegree”>“Low”</DQMetadataAttribute> </measurableConcept>
</attribute> </entity>
<entity id="N003">
<attribute name=“TextOfTheNews”> “The 1st European Conference on IQ is to be celebrated in Spain in 2009” </attribute>
<attribute name= “ProductionDate”>05/25/2006</attribute> <attribute name= “NewsProvider”>MyPersonalDQBlog.com
<measurableConcept name=“Reliability”>
<DQMetadataAttribute name= “ReliabilityDegree”>“Low”</DQMetadataAttribute> </measurableConcept> </attribute> </entity> </qualityData> Table 12. DQTaggedNews.XML.
Figure 2. XSL Schema for DQMIM.
Table 13 and Table 14 show the XML document generated as an instantiation of the DQMIM-XSD structure for our working example described through this work. Please note that data and metadata on which the measurement are stored in the DQXML document DQTaggedNews.XML (see Table 12).
<dqmim> <InformationNeed>
<description>
Know whether the DQ of the news published in a website satisfies customers so as they visit the website again
</description> <dqStakeholders>
<dqStakeholder name= “Ismael Caballero” role= “Measurement process leader”</dqStakeholder> <dqStakeholder name= “Eugenio Verbo” role=“Data provider”</dqStakeholder>
</dqStakeholders>
<MeasurableConcept id= “Completeness” onEntityCategory= “DataValues”> <entity type= “text/XML” src= “DQTaggedNews.XML”>
<owner>Eugenio Verbo</owner>
<BaseMeasure name= “NumberOfNotCompleteNews” scale= “Ratio”> <MeasurementMethod>
<description>Compute the ratio of news (elements) having values for all of the defined items</description> </MeasurementMethod>
</BaseMeasure>
<BaseMeasure name= “NumberOfNews” scale= “Ratio”> <MeasurementMethod>
<description>Number of pieces of news in the RSS document</description> </MeasurementMethod>
</BaseMeasure>
<DerivedMeasure name= “Completeness”>
<BaseMeasure id= “NumberOfNotCompleteNews”/> <BaseMeasure id= “NumberOfNews”/>
<MeasurementFunction> 1- NumberOfNotCompleteNews / NumberOfNews</MeasurementFunction> </DerivedMeasure>
</entity> </MeasurableConcept>
<MeasurableConcept id= “Reliability” onEntityCategory= “DataValues”> <entity type= “text/XML” src=“DQTaggedNews.XML”>
<owner>Eugenio Verbo</owner>
<BaseMeasure name= “NumberOfNotReliableNews” scale= “Ratio”> <MeasurementMethod>
<description> Compute the ratio of news having a reliable source</description> </MeasurementMethod>
</BaseMeasure>
<BaseMeasure name= “NumberOfNews” scale= “Ratio”> <MeasurementMethod>
<description>Number of news in the RSS document</description> </MeasurementMethod>
</BaseMeasure>
<DerivedMeasure name= “Reliability”>
<BaseMeasure id= “NumberOfNotReliableNews”/> <BaseMeasure id= “NumberOfNews”/>
<MeasurementFunction> 1-NumberOfNotReliableNews / NumberOfNews</MeasurementFunction> </DerivedMeasure>
</entity> </MeasurableConcept> <Indicator>
<analysisModel>
<description> DQLevelOfPublishedNews (Completeness, Reliability)</description> </analysisModel>
<decisionCriteria> <value label= “HIGH”>
<Measure= “Completeness” fromClosed= “0.8” toClosed= “1”> <Measure= “Reliability” fromClosed= “0.6” toClosed= “1”> </value>
<value label= “ACCEPTABLE”>
<Measure= “Completeness” fromClosed= “0.8” toClosed= “1”> <Measure= “Reliability” fromClosed= “0” toOpen= “0.6”> </value>
<value label= “ACCEPTABLE”>
<Measure= “Completeness” fromClosed= “0” toOpen= “0.8”> <Measure= “Reliability” fromClosed= “0.6” toClosed= “1”> </value>
<value label= “LOW”>
<Measure= “Completeness” fromClosed= “0” toOpen= “0.8”> <Measure= “Reliability” fromClosed= “0” toOpen= “0.6”> </value>
</decisionCriteria> </Indicator>
</InformationNeed> </dqmim>
Table 14. A DQMIM XML file for our running example [Part 2 of 2].
The main purpose of both types of XML files (tables 11 to 13) is to be the basis for a software artefact that can process the DQMIM XML file as measurement plans on the data stored on the DQXML file.
5.
C
ONCLUSIONS
A
ND FUTURE
W
ORKS
The lack of a common terminology may seriously jeopardize the communication and the interchange of experiences on data quality measurement amongst the members of the DQ research community. This paper presents a proposal named Data Quality Measurement Information Model to fulfil this void, which based on ISO/IEC 15939, provides a set of the main terms related to data quality measurement. This set has been elaborated by analyzing the different data quality measurement proposals provided by the most referenced authors and aligning them to the mentioned standard.
By making a SWOT Analysis, Table 15 gathers the main characteristics of the proposed model.
Strength Weakness Opportunities Threats
• It unifies concepts related to DQ measurement by aligning the terms to an international ISO/IEC standard.
• It can be used with any data quality model, even with future standards (ISO/IEC 25012)
• There are no similar proposals in the DQ literature.
• It can describe any measurement process for data quality.
• It has been implemented through the DQMIM Schema, which enables the automation of the proposed measured on a DQXML data file.
• It does not represent the economical aspect of the measurement; e.g. human resources costs [8, 17, 19].
• The DQMIM Schema need to be enhanced with new features, like the representation of an external source of measurements.
• It is necessary to define a Methodology for drawing measurement plans or a standard measurement process. • It could be complemented with a DQ measure catalogue.
• It might be refined through real case studies.
• DQMIM through the developed schema can be used to automate and propagate measurement processes and measurement plans.
• It can be developed a tool for automating the measurement of the data quality of an DQXML file according to the DQMIM XML
• It would not be accepted by the DQ research community until terms will be accepted and used and its applicability will be demonstrated.
Table 15. SWOT analysis for DQMIM.
Future lines of this work are based on the weakness and opportunities presented in the second and third columns of Table 15: on one hand, to refine the DQMIM in order to document the different measurement methods. And on the other hand, the future lines are intended to develop solutions to the opportunities.
6.
A
CKNOWLEDGEMENTS
.
This research is part of the projects FAMOSO (FIT-340000-2007-71) supported by the Spanish
Ministerio de Industria, Turismo y Comercio, ESFINGE (TIN2006-15175-C05-05) and CALIPSO (TIN 2005-24055-E) both supported by the Spanish Ministerio of Educación y Ciencia
R
EFERENCES
[1] Ballou, D.P., Wang, R.Y., and Pazer, H., "Modelling Information Manufacturing Systems to Determine Information Product Quality".Management Science, 44 (4). 1998. p. 462-484.
[2] Batini, C., Ceri, S., and Shamkant, N., Conceptual Database Design - An Entity-Relationship Approach. Benjamin/Cummings, 1992.
[3] Batini, C. and Scannapieco, M., Data Quality: Concepts, Methodologies and Techniques. Data-Centric Systems and Applications. Springer-Verlag Berlin Heidelberg Berlin, 2006.
[4] Burgess, M.S.E., Gray, W.A., and Fiddian, N.J. Quality Measures and the Information Consumer. in Ninth International Conference on Information Quality (ICIQ'04). 2004. MIT, Cambridge, MA, USA.
[5] Calero, C., Piattini, M., and Genero, M., "Empirical Validation of Referential Integrity Metrics". Information and Software Technology. Special Issue on Controlled Experiments in Software Engineering, 43 (15). 2001. p. 949-957.
[6] Cappiello, C., Francalanci, C., and Pernici, B. Data quality assessment from the user's perspective. in
International Workshop on Information Quality in Information Systems, (IQIS2004). 2004. Paris, Francia: ACM. [7] Caro, A., Calero, C., Caballero, I., and Piattini, M. Defining a Data Quality Model for Web Portals. in 7th International Conference on Web Information Systems - WISE'2006. 2006. Wuhan, China: Springer: LNCS.
[8] English, L., Improving Data Warehouse and Business Information Quality: Methods for reducing costs and increasing Profits. Willey & Sons New York, NY, USA, 1999.
[9] Eppler, M., Managing Information Quality: Increasing the Value of Information in Knowledge-intensive Products and Processes. Springer, 2003.
[10] Even, A. and Shankaranarayanan, G. Value-Driven Data Quality Assessment. in Tenth International Conference on Information Quality (ICIQ'05). 2005. MIT, Cambridge, MA, USA.
[11] Gebauer, M., Caspers, P., and Weigel, N. Reproducible Measurement of Data Quality Field. in Tenth International Conference on Information Quality (ICIQ'05). 2005. MIT, Cambridge, MA, USA.
[12] Genero, M., Piattini, M., and Calero, C., "A survey of Metrics for UML Class Diagrams". Journal of Object Technology, 4 (9). 2005. p. 59-92.
[13] Gertz, M., Ozsu, M.T., Saake, G., and Sattler, K.-U., "Report on the Dagstuhl Seminar "Data Quality on the Web"".SIGMOD RECORD, 33 (1). 2004. p. 127-132.
[14] Herrera-Viedma, E., Pasi, G., and Lopez-Herrera, A., "Evaluating the Information Quality of Web Sites: A Quality Methodology Based on Fuzzy Computing with Words". Journal of American Society for Information Science and Technology, 54 (4). 2006. p. 538-549.
[15] ISO, "ISO 2859-1: Sampling procedures for inspection by attributes -- Part 1: Sampling schemes indexed by acceptance quality limit (AQL) for lot-by-lot inspection". 1999.
[16] ISO/IEC, "ISO/IEC 15939. Information Technology - Software Measurement Process". 2000.
[17] Lee, Y.W., Pipino, L.L., Funk, J.D., and Wang, R.Y., Journey to Data Quality. Massachussets Institute of Technology Cambridge, MA, USA, 2006.
[18] Lindland, O., Sindre, G., and Solvberg, A., "Understanding Quality in Conceptual Modelling". IEEE Software, 11 (2). 1994. p. 42-49.
[19] Loshin, D., Enterprises Knowledgement Management: The Data Quality Approach. Morgan Kauffman San Francisco, CA, USA, 2001.
[20] Moody, D. and G., S. What Makes A Good Data Model? Evaluating The Quality of Entity Relationships Models. in Proceedings of the 13th International Conference on Conceptual Modelling (ER´94),. 1994. Manchester, UK.
[21] Naumann, F. and Rolker, C. Assessment Methods for Information Quality Criteria. in Fifth International Conference on Information Quality (ICIQ'2000). 2000. MIT, Cambridge, MA, USA.
International Conference on Information Quality (ICIQ'05). 2005. MIT, Cambridge, MA, USA.
[23] Orman, L., Storey, V., and Wang, R. Systems Approaches to Improving Data Quality. in First International Conference on Information Quality (ICIQ'96). 1996. MIT, Cambridge, MA (USA): MIT Press. [24] Piattini, M., Calero, C., and Genero, M., "Table Oriented Metrics for Relational Databases". Software Quality Journal, 9 (2). 2001. p. 79-97.
[25] Piattini, M., Genero, M., and Jiménez, L., "A metric-based approach for predicting conceptual data models maintainability." International Journal of Software Engineering and Knowledge Engineering, 11 (6). 2001. p. 703-729.
[26] Pipino, L.L., Lee, Y.W., and Wang, R.Y., "Data Quality Assessment".Communications of the ACM, 45 (4ve). 2002. p. 211-218.
[27] Pipino, L.L., Wang, R.Y., Kopcso, D., and Rybolt, W., Developing Measurement Scales for Data-Quality Dimensions, in Information Quality, R.Y. Wang, et al., Editors. 2005, ME Sharpe: Armonk, NY, USA. p. 37-51. [28] Price, R. and Shanks, G., "A Semiotic Information Quality Framework: Development and Comparative Anaysis".Journal of Information Technology, 00 (0). 2005. p. 1-15.
[29] Redman, T., Data Quality: The field guide. Digital Press Boston, 2000.
[30] Redman, T.C., Data Quality for the Information Age. Artech House Publishers Boston, MA, USA, 1996. [31] Strong, D.M., Lee, Y.W., and Wang, R.Y., "Data Quality in Context".Communications of the ACM, 40 (5). 1997. p. 103-110.
[32] W3C, Extensible Markup Language (XML). 2007, W3C: http://www.w3.org/XML/.
[33] Wang, R.Y. and Madnick, S. Data Quality Requirements: Analysis and Modelling. in Ninth International Conference on Data Engineering (ICDE'93). 1993. Vienna, Austria: IEEE Computer Society.
[34] Wang, R.Y., Reddy, M., and Kon, H., "Towards quality data: An attribute-based approach".Journal of Decision Support Systems, 13 (3-4). 1995. p. 349-372.
[35] Wang, R.Y., "A Product Perspective on Total Data Quality Management".Communications of the ACM, 41 (2). 1998. p. 58-65.
![Table 2. Concepts from ISO/IEC 15939 used to model the ‘Why’ Question. [16]](https://thumb-us.123doks.com/thumbv2/123dok_us/1836053.2765902/3.892.101.794.431.530/table-concepts-iso-iec-used-model-question.webp)
![Table 3. Concepts from ISO/IEC 15939 used to model the ‘What’ and ‘Where’ Questions. [16]](https://thumb-us.123doks.com/thumbv2/123dok_us/1836053.2765902/4.892.94.796.198.312/table-concepts-iso-iec-used-model-questions.webp)
![Table 4. Concepts from ISO/IEC 15939 used to model the ‘What’ and ‘Where’ Questions. [16]](https://thumb-us.123doks.com/thumbv2/123dok_us/1836053.2765902/5.892.110.791.519.606/table-concepts-iso-iec-used-model-questions.webp)
![Table 5. Concepts from ISO/IEC 15939 used to model the ‘What’ and ‘Where’ Questions. [16]](https://thumb-us.123doks.com/thumbv2/123dok_us/1836053.2765902/6.892.107.792.207.618/table-concepts-iso-iec-used-model-questions.webp)
![Table 8. Classification of methods for generating metadata to asses Measurement Concept [21]](https://thumb-us.123doks.com/thumbv2/123dok_us/1836053.2765902/8.892.158.736.239.484/table-classification-methods-generating-metadata-asses-measurement-concept.webp)