McDonald, Effie and Richmond, Kenny (2019) Measuring Scotland's
economic performance. Fraser of Allander Economic Commentary, 43
(1). ISSN 2046-5378 ,
This version is available at
https://strathprints.strath.ac.uk/67584/
Strathprints is designed to allow users to access the research output of the University of Strathclyde. Unless otherwise explicitly stated on the manuscript, Copyright © and Moral Rights for the papers on this site are retained by the individual authors and/or other copyright owners. Please check the manuscript for details of any other licences that may have been applied. You may not engage in further distribution of the material for any profitmaking activities or any
commercial gain. You may freely distribute both the url (https://strathprints.strath.ac.uk/) and the
content of this paper for research or private study, educational, or not-for-profit purposes without prior permission or charge.
Any correspondence concerning this service should be sent to the Strathprints administrator:
The Strathprints institutional repository (https://strathprints.strath.ac.uk) is a digital archive of University of Strathclyde research outputs. It has been developed to disseminate open access research outputs, expose data about those outputs, and enable the
Measuring Scotland’s economic performance
Effie McDonald and Kenny Richmond
Abstract
Abstract: This article uses a range of measures, including the measurement framework of the
Scottish Government’s National Performance Framework (NPF), to assess Scotland’s economic performance as a sustainable and inclusive economy. The NPF measurement framework seeks to measure the progress and nature of inclusive growth in Scotland as well as to place it in an international context. The performance measures summarised include those for GDP and GDP growth, employment and inequality (income and regional) as well as for exports, innovation, business start-ups and growth, inward investment and fair work. All measures are set within a relevant comparative context, often that of other OECD economies. The article concludes with a
‘balanced scorecard’ of Scotland’s inclusive economic performance across the relevant measures.
1.
Introduction
The Scottish Government’s National Performance Framework1 (NPF) was refreshed in June 2018,
with the aim to provide ‘a focus and direction for policy action across the public sector as a
whole’. The NPF sets out a vision for Scotland of inclusive and sustainable economic growth and it has an associated measurement framework. The NPF is structured around 11 outcomes and a set of 81 indicators that measure outcome progress, with an overall Purpose and set of Values. This paperoutlines Scotland’s performance for a number of NPF and other measures that are key drivers of productivity and inclusive economic growth. Scotland’s performance is compared where possible to other economies, and the size of any performance gap, for example to the top quartile of economies, is estimated.
2.
Economic growth and productivity
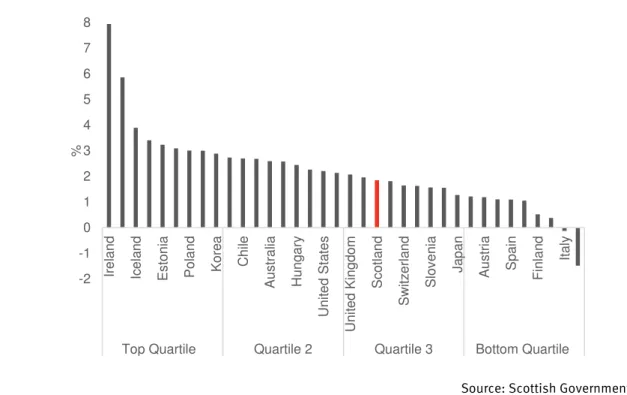
Scotland’s economic growth (NPF indicator) remains relatively weak (+1.4% in 20182) partly a
result of the downturn in the oil & gas sector, and recent trend growth is in the 3rd quartile of
1 National Performance Framework 2 Scottish Government
Economic Commentary, April 2019
2
OECD countries3 (see Figure 1). If Scotland’s growth had matched the OECD Q1 rate, the economy
would be around £2.3bnlarger(potentially supporting over 40,000 additional jobs) 4.
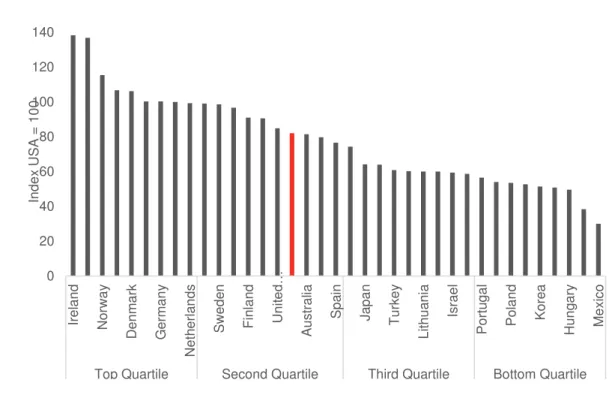
Productivity (NPF indicator) is a measure of international competitiveness and a key determinant of living standards, wages and sustainable economic growth. Scotland’s productivity declined by 1.4% in 20175, and is mid-table compared to other countries; 2nd OECD quartile (see Figure
2). The productivity gap with the top OECD quartile widened slightly over 20176, suggesting
Scotland has become less competitive than the best performing countries.
To reach the OECD top quartile, Scotland’s productivity would need to be 21% higher, equivalent to almost £33bn more GDP a year. Also, average annual wages could be over £5,000 higher if Scotland’s productivity matched the OECD top quartile7, highlighting the significant economic
gains if Scotland could improve its productivity performance.
Figure 1: Annual average GDP growth rates, OECD countries, 2012-2017 (%)
Source: Scottish Government, OECD
3 OECD
4 Scottish Enterprise calculation 5 Scottish Government
6 Scottish Government
7 Scottish Enterprise calculations
-2 -1 0 1 2 3 4 5 6 7 8 Ire la n d Ic e la n d Es to n ia Po la n d Ko re a C hi le Au s tra lia Hun g a ry Uni te d St a te s Uni te d Ki n g d o m Sc o tl a n d Swit z e rl a n d Sl o v e n ia J a p a n Au s tri a Sp a in Fi n la n d It a ly
Top Quartile Quartile 2 Quartile 3 Bottom Quartile
Figure 2: Index of productivity (GDP per hour worked), OECD countries, 2017 (USA=100)
Source: Scottish Government, OECD
3.
Employment and inequality
Scotland’s employment rate (NPF indicator) is in the top quartile of OECD countries (See Figure 3), with 135,000 more people in work over the past five years. Most new jobs (70%) have been in higher skilled occupations8. However, there is still an employment rate gap between men and
women(NPF indicator) of 6.9%. If the female employment rate matched that of males, there would be 127,000 more women in work9.
A range of evidence shows that more unequal economies grow slower10. Scotland ranks 21st out
of 36 OECD countries for income inequality(NPF Indicator) using the Palma ratio measure11 (See
Figure 4). Scotland’s recent real wage growth has been disappointing, due to largely to weak productivity, andthe annual incomes of lower earnerswould need to rise by around £7bn for
Scotland’s to match the best OECD performers for income equality12.
8 Annual Population Survey 9 Scottish Enterprise calculation 10Scotland’s Economic Strategy
11 The Palma ratio is the ratio of the income share of the top 10% of households to that of the bottom 40%. 12 Scottish Enterprise calculation.
0 20 40 60 80 100 120 140 Ire la n d Norwa y D en m ark G e rm a n y Net h e rl a n d s Swed e n Fi n la n d U ni te d… Au s tra lia Sp a in J a p a n Tu rk e y L ith u a n ia Is ra e l Po rtu g a l Po la n d Ko re a Hun g a ry M e x ic o
Top Quartile Second Quartile Third Quartile Bottom Quartile
In d e x USA = 1 0 0
Economic Commentary, April 2019
4
Figure 3:Employment rate (% of working age people 15-64), OECD countries, 2017
Source: Scottish Government, OECD
Figure 4: Income inequality (Palma ratio), OECD countries, 2016
Source: Scottish Government, OECD
0 10 20 30 40 50 60 70 80 90 100 Ic e lan d N e w Z e al a n d N e th e rl an d s G e rm an y S co tl an d E st o n ia C ze ch R e p u b lic A u st ral ia F in lan d La tv ia Is rae l P o rt u g al K o re a S lo v ak R e p u b li c F ran ce C h ile M e xi co G re e ce
Top Quartile Quartile 2 Quartile 3 Bottom Quartile
% 0 50 100 150 200 250 300 S lo v ak R e p u b li c S lo v e n ia C ze ch R e p u b lic Ic e lan d F in lan d N o rw ay B e lg iu m D e n m ar k A u st ri a P o lan d H u n g ar y S w e d e n N e th e rl an d s G e rm an y F ran ce S w it ze rl an d Ir e la n d Lu xe m b o u rg C a n a d a E st o n ia S co tl an d It al y A u st ral ia G re e ce P o rt u g al Jap an S p a in Is rae l La tv ia N e w Z e al a n d U n it e d K in g d o m Li th u an ia U n it e d S tat e s T u rk e y C h ile M e xi co
Top Quartile Quartile 2 Quartile 3 Bottom Quartile
P a lm a Rat io
So, although Scotland’s employment rate is high, weak productivity means there has been little growth in real wages, income inequality is greater than in most OECD countries, and some groups, such as women, are not fully benefitingfrom the strong labour market.
4.
Innovation
Scotland’s innovation performance is mixed. Less than half (45%) of businesses (with 10+ employees) are innovative (NPF indicator)13, placing Scotland 9th equal of UK regions (See Figure
6). To reach the top quartile of UK regions, Scotland would need 1,600 more businesses to innovate (+15%)14.
Scotland’s overall R&D spend (NPF indicator) rose in 2017 to £2.5bn15. However, Scotland’s R&D
rate is in the 3th quartile of OECD economies. A key reason is Scotland’s low business R&D spend
and, although this now exceeds £1.2bn, performance is in the OECD 3rd quartile16 (See Figure 5).
To reach the top quartile, Scottish business R&D would need to be 160% higher (+£1.7bn). Around 3,500 businesses in Scotland invested in R&D in 2017, however activity is heavily concentrated, with just 20 businesses accounting for almost 60% of total business R&D spend. And almost 65% is by non-Scottish owned businesses17.
Scotland’s higher education R&D rate is amongst the best in the world18. However, there still
appears to be relatively weak innovation links between higher education and the business base
– only 19% of businesses (with 10+ employees) in 2016 had co-operation links with higher education institutes (although this is a significant rise from 2014)19.
Scotland therefore needs more businesses to invest in R&D, innovate and introduce new products, services and processes through, for example, greater engagement with research assets such as Innovation Centres20 and universities; driving innovation through supply chains;
adopting new technologies; and, introducing workplace practices that foster innovation.
13 Scottish Government
14 Scottish Enterprise calculation 15 Scottish Government 16 Scottish Government 17 Scottish Government 18 Scottish Government 19 Scottish Government 20 http://www.sfc.ac.uk/innovation/innovation-centres/innovation-centres.aspx
Economic Commentary, April 2019
6
Figure 5:Business R&D expenditure as a percentage of GDP, OECD countries, 2016
Source: Scottish Government, OECD
Figure 6:Percentage of businesses (with 10+ employees) that are ‘innovation active’, UK regions, 2014-16
Source: UK Innovation Survey
0.0 0.5 1.0 1.5 2.0 2.5 3.0 3.5 4.0 Is rae l K o re a Jap an S w it ze rl an d * S w e d e n A u st ri a G e rm an y U n it e d S tat e s D e n m ar k F in lan d B e lg iu m S lo v e n ia F ran ce Ic e lan d N e th e rl an d s U n it e d K in g d o m N o rw ay C ze ch R e p u b lic A u st ral ia* H u n g ar y Ir e la n d C a n a d a It al y S co tl an d E st o n ia S p a in Lu xe m b o u rg N e w Z e al a n d * P o rt u g al P o lan d * T u rk e y * G re e ce S lo v ak R e p u b li c M e xi co C h ile La tv ia
Top Quartile Quartile 2 Quartile 3 Bottom Quartile
% 0% 10% 20% 30% 40% 50% 60% S W e s t Ea s te rn S Ea s t W M id la n d s E M id la n d s Yo rk s h ire N We s t L o n d o n Wa le s Sc o tl a n d N Ea s t N Ire la n d
Top Quartile Quartile 2 Quartile 3 Bottom Quartile
5.
Exports
International exports (NPF indicator) are vital to economic growth, more so for smaller countries such as Scotland. Scottish overseas exports rose to £32.4b in 2017 (See Figure 7) and sales to the rest of the UK rose to £48.9b21. However, exports are less important to Scotland’s economy
than in most other small EU countries, even when sales to the rest of the UK are included22. Scotland’s main international markets are the EU (46% of exports) and North America (19%). Fast growing emerging markets, such as China and the Middle East, account for around 10%. The largest overseas export sectors are spirits, chemicals and professional services (37% of total)23. Around 100 companies make up 60% of international exports, and this is more
concentrated than most other OECD countries24.
There are around 10,700 international exporters in Scotland. However, just 6% of businesses sell overseas (See Figure 8), and Scotland would need 7,000 more exporters (+65%) to match the rate of the top quartile of GB regions25. However, only 3% of non-exporting Scottish SMEs
plan to start exporting, although 16% have goods/services suitable for exporting, suggesting Scotland has 14,500 potential SME exporters26.
Increasing trade with competitive domestic markets such as London and the South East of England could be a stepping stone to international exporting for a number of companies. However, only 31% of Scottish SMEs directly sell to the rest of UK27.
The evidence highlights that Scotland needs to significantly expand its exporting base. Raising the international ambition and business capacity of current and potential exporters is vital to exploit the growth benefits and opportunities of trade. Weak export performance is likely, in part, to explain weak innovation performance.
21 Scottish Government 22 Scottish Government 23 Scottish Government
24 Scottish Government and OECD 25 ONS, Scottish Enterprise calculation 26 Scottish Government
Economic Commentary, April 2019
8
Figure 7: Scottish international export markets, 2013-2017 (£billion)
Source: Scottish Government
Figure 8: Percentage of registered businesses that export overseas, UK regions, 2016
Source: Office for National Statistics
0 5 10 15 20 25 30 35 2013 2014 2015 2016 2017 £ b il li o n Australasia Africa Asia Middle East Central and South America North America Rest of Europe European Union 0 2 4 6 8 10 12 14 %
6.
Inward Investment
Foreign owned businesses contribute significantly to Scotland’s economy, accounting for 17% of employment (318,000 jobs) and 33% of turnover (£86bn)28. They also contribute significantly to Scotland’s R&D (65%), exporting and capital investment performance, and offer significant supply chain opportunities. Foreign owned businesses have higher levels of productivity and pay higher wages than Scottish owned businesses29, suggesting they create higher quality jobs.
In 2017, Scotland secured 116 inward investment projects (6,300 jobs) from overseas, a ten-year high and 9.6% of the UK total, (See Figure 10) placing Scotland in the top quartile of European countries (See Figure 9). Around a third originated from the EU, with 30% from the US. Business services, digital and agri-food were the leading sectors, and sales & marketing the leading activity. 22 projects were R&D related (the highest of all UK regions, and 24% of all R&D projects into the UK)30. In addition, 54 projects were attracted to Scotland from the rest of the
UK in 2017/18, and are expected to create 2840 jobs31.
Key factors attracting investors to Scotland are the availability of skills/talent (most important), business partners/suppliers, labour costs and the right infrastructure32. Ensuring continued
investment in and access to skilled labour and sector expertise, capabilities and assets is key
to increasing further Scotland’s attractiveness as an inward investment location. And inward investors can provide significant opportunities to drive innovation and productivity growth through supply chains.
28 Scottish Government
29 Scottish Government, productivity defined as turnover per employee, Businesses in Scotland, Scottish Government
30 Ernst & Young 31 Scottish Enterprise
Economic Commentary, April 2019
10
Figure 9: Number of FDI projects per 1 million population, European countries (with 100+ projects), 2017
Source: Ernst & Young
Figure 10: FDI projects in Scotland, number and % market share of UK projects, 2008-2017
Source: Ernst & Young
0 5 10 15 20 25 30 35 40 Fi n la n d Ire la n d Sc o tl a nd Net h e rl a n d s Be lg iu m UK Se rb ia Fra n c e G e rm a n y Cz e c h R e p Hun g a ry Rom a n ia Po la n d Sp a in Tu rk e y R us s ia
Top Quartile Quartile 2 Quartile 3 Bottom Quartile
Pro je c ts p e r 1 m ill io n p o p 0% 2% 4% 6% 8% 10% 12% 0 20 40 60 80 100 120 140 2008 2009 2010 2011 2012 2013 2014 2015 2016 2017
7.
Business investment and growth funding
Scotland’s business investment rate lags nearly all other OECD economies (See Figure 11). To match the top OECD quartile, business investment would need to be 117% higher (+£13bn) a year33. This suggests that the quality and level of Scotland’s capital stock is lower than many of
our competitors34.
Approved bank loans to Scottish SMEs was £2.2bn in the year to June 2018, and has recently been rising. However, relative to the size of the economy, the value of loans is lower than other parts of the UK35. Also, just 17% of Scottish SMEs sought external finance in 2017, and a further
13% had a need for external finance but did not apply for it (discouraged borrowers)36. This
suggests demand for growth funding remains an issue and there is an opportunity to work with more SMEs to introduce financing opportunities and help raise ambitions for growth.
The risk capital market in Scotland is showing steady growth, exceeding £500m in 2017 (See Figure 12). Scotland is in the top quartile of UK regions for the relative size of risk capital funding and number of deals. However, deal sizes are generally smaller than in many other UK regions, and mostly in the £100k - £2m band. There is a growing consensus that there is a funding gap above £2 million37.
The equity gaps are systemic and a long-term feature of the market, and impact on early stage and higher risk companies. And London, South East and East of England regions dominate the
UK’s risk capital market (81% of total UK investment and 73% of deals) 38.
Scotland needs a step change in business investment to ensure workforces have up-to-date and high-quality plant, kit and workplaces. Increasing the levels of exporting and innovation will raise the incentives to invest, and the demand for growth funding.
33 Scottish Enterprise calculation
34Wealth of the Nation: Scotland’s Productivity Challenge, David Hume Institute 35 UK Finance
36 Scottish Government
37 The Risk Capital Market in Scotland: Annual Report 2017, Scottish Enterprise 38 Investment Benchmarking Analysis: Annual Report 2017, Scottish Enterprise
Economic Commentary, April 2019
12
Figure 11:Business investment as a % of GDP, OECD countries, 2017
Source: Scottish Government, OECD
Figure 12: Risk capital market in Scotland (number of deals & £m invested), 2012-2017
Source: Scottish Enterprise
0 2 4 6 8 10 12 14 16 18 20 Ire la n d Ko re a Swit z e rl a n d Chi le Swed e n C ze ch … J a p a n Bel gi um Au s tri a Sp a in Es to n ia N ew … Hun g a ry Sl ov ak … Fra n c e Norwa y Den m a rk G e rm a n y Sl o v e n ia Au s tra lia Fi n la n d Net h e rl a n d s Po rtu g a l U ni te d… Can a d a U ni te d… It a ly Po la n d M e x ic o Sc o tl a n d G re e c e % 0 50 100 150 200 250 300 350 400 0 100 200 300 400 500 600 2012 2013 2014 2015 2016 2017 N u m b e r o f d e al s £ m in ve st e d
8.
Business base and growth
There are 345,915 businesses in Scotland (of which 176,295 are registered - NPF indicator), a fall of 8,830 (-2.5%) since 201739. Relative to population, Scotland has a smaller business base
than most other UK regions and EU countries and would need 70,000 more registered businesses to reach the UK Q1 rate40. This means that many businesses and sectors may lack
exposure to strong competition, a key driver of innovation and the need to enter overseas markets.
Scotland’s historic low entrepreneurial activity rate (NPF indicator) is a key weakness and reason for the small business base. Scotland is in the 3rd quartile of OECD countries, and would need
160,000 (+72%) more entrepreneurially active people to reach Q141.
High growth businesses contribute disproportionately to economic growth42, and there are
around 845 (NPF indicator) in Scotland43. However, the proportion of businesses that achieve
high growth (5.1%) is lower than all other UK regions, and Scotland would need 100 more to reach the UK region top quartile (See Figure 13). Also, Scottish high growth businesses are on average smaller than those in other regions44, and this suggests that they play a far less
significant role in Scotland in boosting economic and productivity growth than other parts of the UK.
Scotland therefore needs significantly more businesses, and more that achieve high growth. Increasing the number of businesses with growth ambition and that export, innovate and invest will create more companies of scale and ‘growth peers’ that others can learn from.
39 Scottish Government
40 Scottish Enterprise calculation – based on 2017
41 Global Entrepreneurship Monitor and Scottish Enterprise calculation. 42 See for example https://www.nesta.org.uk/report/the-vital-6/
43 High growth is defined as enterprises with 10+ employees with average annualised growth greater than 20% per annum, over a three-year period. Growth can be measured by the number of employees or by turnover. For this analysis growth has been measured using employment.
Economic Commentary, April 2019
14
Figure 13: Proportion of businesses that achieve high growth, UK regions, 2017
Source: ONS Note: Data is for businesses with 10+ employees45
9.
Education and skills
Scotland has a highly educated population (NPF indicator), ranked 5th of all OECD countries for
tertiary education attainment (See Figure 14). However, Scotland’s skills base is not being fully and most effectively utilised (NPF indicator) as almost 1 in 5 graduates work in non-graduate roles46, and 35% of employers have employees over-qualified or over-skilled for the roles they
hold (equivalent to 225,000 underutilised employees)47 (See Figure 15). This suggests there is
a degree of mismatch between the supply and demand of skills and qualifications in Scotland. Good leadership and management capability and practices are key to driving productivity growth, and ensuring skills are used effectively. However, management practices in Scotland
45 The National Performance Framework measures high growth as a proportion of all registered businesses (1.2% for 2017)
46 Scottish Government 47 Employer Skills Survey
0% 1% 2% 3% 4% 5% 6% 7% 8%
lag some other countries48, and family-owned businesses (that account for 68% of Scottish
SMEs49) on average score the lowest for management practices50.
Just 8% of Scottish businesses are ‘high performance working employers’51, so there is
considerable scope for leadership teams in many businesses to significantly improve management practices and adopt innovative and progressive approaches to workforce planning and skills utilisation.
Scotland’s very highly educated population is a key asset. However, this talent is not being fully utilised, and increasing the productivity and growth of more businesses will create more higher quality, higher skilled job opportunities.
Figure 14: Percentage % of 25- 64 year olds with a tertiary education, OECD countries, 2017
Source: Eurostat, OECD
48 https://worldmanagementsurvey.org/ (Scotland assumed to perform the same as the UK) 49 Scottish Government
50 ONS
51 Employer Skills Survey 0 10 20 30 40 50 60 C a n a d a J a p a n Is ra e l K o re a S c o tlan d U n it e d S ta te s U n it e d K ing d o m Ir e lan d A u s tr a lia Finl a n d N o rw a y S w it z e rl a n d Ic e lan d S w e d e n L u x e m b o u rg L it h u a n ia B e lg ium E s to n ia D e n mar k N e w Zea lan d N e th e rlan d s S p a in Fr a n c e S lov e n ia A u s tr ia Gr e e c e P o la n d Ge rman y H u n g a ry P o rt u g a l C z e c h R e p u b lic S lov a k R e p u b lic C h ile Tur k e y It a ly Mex ic o
Top Quartile Quartile 2 Quartile 3 Bottom Quartile
Economic Commentary, April 2019
16
Figure 15: Skills under-utilisation in Scotland, by sector, 2017: number of employees, % of all employees (density)
Source: Employer Skills Survey
10.
Fair Work
Scotland’s performance against a range of fair work factors, important in driving productivity and creating higher quality jobs and workplaces52, is mixed compared to other countries (see
Box 1). On some measures, Scotland performs well. For example, 80.6% of workers are paid more than the voluntary living wage (NPF Indicator), the second best performance of all UK regions53, and the number of workers on zero hours contracts (NPF indicator) is steadily
declining (63,000 in 2018, 2.4% of all workers)54.
There are, though, areas where performance could improve. Scotland’s youth unemployment rate (NPF indicator) is in second quartile of OECD countries (See Figure 16), and would need to fall by 5,700 (-15%) to reach the top quartile55. The proportion of employees receiving workplace
learning (NPF indicator) has been declining (to just 23% in 2017)56. And the gender pay gap (NPF
52 Fairwork Convention 53 Scottish Government 54 Scottish Government
55 Scottish Enterprise Calculation 56 Employer Skills Survey
0 5 10 15 20 25 30 0 5,000 10,000 15,000 20,000 25,000 30,000 35,000 40,000 Wh o le s a le & Ret a il Hot e ls & re s ta u ra n ts Hea lth & s o c ia l wo rk Bu s in e s s Se rv ic e s Arts & O th er Se rv ic e s Pu b lic a d m in . Pri m a ry & Uti liti e s ICT Ed u c a ti o n Con s tru c ti o n M a n u fa c tu ri n g Tra n s p o rt & St o ra g e Fi n a n c ia l Se rv ic e s Den s ity % Num m be r of e m pl oy e e s Employees Density
indicator) has been falling consistently for a number of years, but is still 6% for full-time employees (and 15% for all employees)57.
There is an opportunity for Scottish businesses to significantly improve approaches to fair work with more becoming ‘high performance working’ employers. This would foster greater innovation, increase productivity, create greater opportunities and increase job and workplace quality.
Box 1: Fair Work –Scotland’s international comparative performance
Source: Scottish Enterprise assessment
Economic Commentary, April 2019
18
Figure 16: Youth unemployment rate (% aged 16-24), OECD countries, Q3 2018
Source: Scottish Government, OECD
11.
Regional economic performance
There are significant regional economic performance differences within Scotland (See Figure 17). For example, the employment rate in Aberdeen City & Shire is 7 percentage points higher
than in the Ayrshires. Overall, around 35% of Scotland’s working age population live in local
authority areas with below Scottish average employment rates (mostly in the west and central belt)58. If employment rates in these areas matched the Scottish average, over 54,000 more
people would be in work59. The employment rate gap between the best and worst performing
authorities is, however, narrowing.
Similarly, productivity levels differ across areas (See Figure 18). For example, workers in Aberdeen are 30% more productive than those in the South of Scotland. If the productivity of lower performing areas matched the Scottish average, Scottish GVA would be over £50bn higher60.
58 Annual Population Survey 59 Scottish Enterprise calculation 60 Scottish Enterprise calculation
0 5 10 15 20 25 30 35 40 45 J a p a n G e rm a n y Cz e c h R e p u b lic M e x ic o Ic el a nd Is ra e l Net h e rl a n d s Swit z e rl a n d Uni te d St a te s Au s tri a Norwa y H un g ary New Z e a la n d Den m a rk Sc o tl a n d Sl o v e n ia Can a d a Uni te d Ki n g d o m Kore a Au s tra lia L a tv ia Po la n d Ire la n d Sl o v a k Re p u b lic Be lg iu m L u x e m b o u rg Swed e n Es to n ia Fi n la n d Chi le Po rtu g a l Tu rk e y Fra n c e It a ly Sp a in G re e c e
Top Quartile Quartile 2 Quartile 3 Bottom Quartile
Some of the differences in productivity are a result of the sectoral make-up of local economies. Tourism (generally low productivity) is more important to the economies of the South of Scotland and parts of Ayrshire, and high productivity sectors such as oil & gas and professional services play a more significant role in Aberdeen and Edinburgh.
Reflecting differing productivity, median wages differ across areas. For example, people living in Edinburgh earn on average 25% more than those living in the South of Scotland61.
Narrowing regional performance gaps could have a significant overall impact on Scotland’s
economy in terms of access to opportunity and reducing inequalities.
Figure 17: Employment rate (%) by Scottish region, 2017-2018
Source: Annual Population Survey
61 Annual Survey of Household Earnings 66 68 70 72 74 76 78 80 82 Highlands & Islands Aberdeen City/Shire Edinburgh & SE S of Scotland Stirling, Clack & Falkirk
Tay Cities Glasgow The
Ayrshires
Top Quartile Quartile 2 Quartile 3 Bottom Quartile
Economic Commentary, April 2019
20
Figure 18:Productivity (£ GVA per hour worked) by Scottish region, 2016
Source: Annual Population Survey
12.
Future trends affecting inclusive growth
Scotland’s total population (NPF indicator) is forecast to rise over the next decade. However, the
‘traditional’ working age group (16-64 year olds) is expected to decline by almost 60,00062 (See
Figure 19). There are regional variations within this with the number of 16-64 year olds expected to rise in Edinburgh & Lothians, Aberdeenshire, Stirling, Falkirk and East Renfrewshire, and decline in all other local authority areas.
This may have implications for Scotland’s employers and attractiveness to inward investors in terms of access to talent. There are also implications for regional inequalities as the number of 16-64 year olds are expected to increase in mainly those areas that are already performing well in terms of productivity and wages.
Over the next decade the number of jobs in Scotland is forecast to rise by 100,00063. However,
a number of sectors that are expected to increase employment are traditionally lower skilled, lower productivity and domestically focused (such as administration & support services,
62 National Records of Scotland 63 Skills Development Scotland
0 5 10 15 20 25 30 35 40 Aberdeen City/Shire Edinburgh & SE Stirling, Clack & Falkirk
Tay Cities The
Ayrshires Glasgow City Region Highlands & Islands S of Scotland
Top Quartile Quartile 2 Quartile 3 Bottom Quartile
£ G V A p e r h o u r w o rk e d
construction and social work/care). Also, the number of jobs is forecast to decline in some higher productivity sectors such as manufacturing, (See Figure 20).
These forecast sectoral trends will have implications for future productivity, innovation, exports, skills utilisation and income equality in Scotland.
Figure 19:Forecast population change in Scotland, by working and non-working age groups, by percentage and number, 2018-2028
Source: National Records of Scotland
-5 0 5 10 15 20 25
Aged under 16 Aged 16 to 64 Aged 65 plus Total
%
No
-59k
+213k
Economic Commentary, April 2019
22
Figure 20:Forecast jobs growth in Scotland, 2017-2028
Source: Skills Development Scotland
13.
Conclusions
Scotland has many economic strengths and assets that provide a basis for future inclusive economic growth and creating more quality jobs, such as a highly educated population, world class research and knowledge and a buoyant risk capital market. And Scotland is a highly attractive location for investment. However, productivity performance continues to be mid-table, meaning that Scotland is less competitive than many other economies.
Although Scotland has a number of highly productive and competitive businesses and sectors, there is evidence of overall weak business dynamism and growth culture, reflected in relatively low levels of innovation, exporting and capital investment. Compared to many other countries, Scotland does not have enough businesses, and not enough of them growing, impacting on productivity performance. Scotland’s overall inclusive growth scorecard, compared to OECD, EU countries or UK regions can be seen at Box 2.
-30,000 -20,000 -10,000 0 10,000 20,000 30,000 40,000 50,000 Manufacturing
Public admin & defence Oil & gas (& other) extraction Agriculture forest fishing
Financial services Utilities Other service activities Real estate activities Information & communication Education Arts entertainment recreation Accommodation & food
Wholesale & retail Health & social work
Construction Professional scientific technical Admin & support
Box 2:Scotland’s inclusive growth ‘scorecard’
Improving productivity will help raise wages and reduce income inequality, particularly in low productivity sectors such as tourism, food manufacturing and construction, and lead to better quality jobs and wages for workers in Scotland.
Scotland needs stimulate more entrepreneurship, business dynamism and growth ambition, and to ensure talent and assets are fully utilised across all regions.
There are significant opportunities for Scotland to achieve a step change in the performance of a number of drivers of productivity and growth:
Innovation: more businesses investing in R&D and introducing new products, services
and processes; greater engagement with sector assets such as Innovation Centres; driving innovation through supply chains; and, adopting new technologies
Trade: raising international ambition and business capacity is vital to exploit the
benefits and opportunities of exporting. Weak trade performance may in part explain weak innovation performance
Investment: Scotland’s very low business investment rate means many businesses will
Economic Commentary, April 2019
24
reducing incentives to invest and demand for growth funding. Also, ensuring continued investment in and access to sector expertise, capabilities and assets is key to increasing
Scotland’s attractiveness as a business and research location.
Fair work: more businesses need to adopt progressive and fairer workplace practices.
This would create better quality jobs for workers and help improve innovation performance and skills utilisation.
Leadership and management: improving the capacity and quality of leadership in
businesses will help raise growth ambitions and the ability to innovate and export effectively, stimulating demand for investment and fully utilising skills within their workforces.
In addition, Scotland needs to ensure that other key drivers of productivity, such the availability of high quality skills/talent and transport/digital infrastructure, are internationally competitive. Improving the productivity, competitiveness and growth ambition of Scottish businesses will create more high quality and higher paid jobs, ensuring the talent is more effectively used and making Scotland more attractive as a place to live and work.
The challenges and opportunities to growing more productive and equal economy is highlighted in Scotland’s Enterprise and Skills Board’s Strategic Plan64, and the analysis and assessment in
this paper provides evidence on areas where policy should focus to achieve greater levels of inclusive and sustainable economic growth.
Authors:
Effie McDonald
Kenny Richmond
Insights & Economics Team, Scottish Enterprise