This content has been downloaded from IOPscience. Please scroll down to see the full text.
Download details:
IP Address: 181.47.39.150
This content was downloaded on 11/05/2016 at 03:34
Please note that terms and conditions apply.
A new algorithm for epilepsy seizure onset detection and spread estimation from EEG signals
View the table of contents for this issue, or go to the journal homepage for more 2016 J. Phys.: Conf. Ser. 705 012032
A new algorithm for epilepsy seizure onset detection
and spread estimation from EEG signals
Antonio Quintero-Rinc´on1, Marcelo Pereyra2, Carlos D0Giano3, Hadj Batatia4, Marcelo Risk1,5
1 Department of Bioengineering, Instituto Tecnologico de Buenos Aires (ITBA), Av. Eduardo
Madero 399, C1106ACD, Buenos Aires, Argentina.
2
Department of Mathematics, University of Bristol, University Walk, Clifton, Bristol BS8 1TW, UK.
3
Fundaci´on contra las Enfermedades Neurol´ogicas Infantiles (FLENI), Argentina.
4 University of Toulouse, IRIT - INP-ENSEEIHT, Toulouse, 2, rue Charles Camichel, B.P.
7122, 31071 Cedex 7, France.
5 Consejo Nacional de Investigaciones Cient´ıficas y T´ecnicas (CONICET), Argentina.
E-mail: [email protected]
Abstract.
Appropriate diagnosis and treatment of epilepsy is a main public health issue. Patients suffering from this disease often exhibit different physical characterizations, which result from the synchronous and excessive discharge of a group of neurons in the cerebral cortex. Extracting this information using EEG signals is an important problem in biomedical signal processing. In this work we propose a new algorithm for seizure onset detection and spread estimation in epilepsy patients. The algorithm is based on a multilevel 1-D wavelet decomposition that captures the physiological brain frequency signals coupled with a generalized gaussian model. Preliminary experiments with signals from 30 epilepsy crisis and 11 subjects, suggest that the proposed methodology is a powerful tool for detecting the onset of epilepsy seizures with his spread across the brain.
1. Introduction
The term epilepsy derives from the Greek term epilambanein which means to seize, and it denotes the predisposition to have recurrent, unprovoked seizures. Seizures can be symptomatic; that is, result from specific precipitants such as fever, strokes, metabolic disturbances (e.g. hypoglycaemia, drug abuse/withdrawal), trauma, infections in the central nervous system, and acute head injury. In epilepsy, however, seizures are unprovoked and expected to be recurrent [46]. Appropriate diagnosis and treatment of epilepsy is a main public health issue. According the World Health Organization [1], there are more than 50 millions people worldwide that suffer from some form of epilepsy, nearly 80% of them are in developing regions, where it is believed that 3 out of 4 people with this conditions do not get appropriate diagnostic and treatment [1]. The International League Against Epilepsy (ILAE) [10] defines “epileptic seizure as a transient occurrence of signs and/or symptoms due to abnormal excessive or synchronous neuronal activity in the brain”. The elements defining an epileptic seizure include its mode of onset and termination, its clinical manifestations, and its abnormal enhanced synchrony [32]. Physical manifestations of epilepsy result mainly from the synchronous and excessive discharge of
Content from this work may be used under the terms of theCreative Commons Attribution 3.0 licence. Any further distribution of this work must maintain attribution to the author(s) and the title of the work, journal citation and DOI.
electricity by a group of neurons behaving abnormally in the cerebral cortex. Epileptic seizures usually have a sudden onset, they spread within seconds and, in most cases, are brief. The precise manifestation of a seizure depends on the location in the brain where it originates, and on how far and fast it spreads. The correct identification of this location and spread information is key to a proper treatment.
Electroencephalography (EEG) is a non-invasive and widely available biomedical modality that can be used to diagnose epilepsy and plan treatment. One particular task that has received attention during the last years is the detection of epileptic seizures from EEG signals measured on the brain scalp. It is widely acknowledged that detection can be improved by summarizing the EEG signals using relevant descriptors; that is, quantities computed from the EEG signals that capture the main relevant features of the seizure, and whose values help discriminating between normal and abnormal brain activity. The most relevant EEG features studied in the literature can be classified in three groups: a) frequency spectral properties such as band power and edge frequency; b) signal morphological properties such as wave amplitude, sharpness, line length, and zero crossings; and c) statistical descriptors such as statistical moments, correlation times and information entropies.
In this work we study a new algorithm for epilepsy seizure onset detection and spread estimation. The algorithms is based on a statistical generalised Gaussian model that represents the activity in each of the brain’s main frequency bands, which are identified by using a multi-resolution temporal wavelet representation. The remainder of this document is structured as follows. Section 2 describes the state of the art in seizure onset detection (SOD). Section 3 defines the univariate generalised Gaussian statistical model. Section 4 describes the proposed the epilepsy seizure onset detection and spread estimation algorithm. In Section 5 the proposed methodology is demonstrated on real EEG signals from patients suffering from epileptic seizures. Discussions and conclusions are finally reported in Section 6.
2. Seizure Onset Detection
Seizure onset detection (SOD) methods stem from the observation that EEG descriptors allow discriminating between normal and abnormal brain activity; that is, between the expected rhythms of the brain and varying degrees of thalamocortical interdependence, and the activity resulting from seizures and burst suppressions. Epileptic attacks have two clinical manifestations that may reflect abnormal brain activity: Ictal andInter-Ictal discharges, in which the impaired consciousness plays an important role (this is the inability to respond normally to exogenous stimuli by virtue of altered awareness and/or responsiveness) [24]. The Interictal discharges are a positive indicator of epilepsy and, depending on the duration of EEG recordings and the inclusion of different states of vigilance, they can be observed in up to 90% of cases [37].
The Ictal discharges are clinical signs used to detect the onset seizure from the epileptogenic zone in the brain cortex, SOD may enable physicians to better therapy with drug treatment, diagnostic and alert procedures, since is intended to recognize the start of a seizure, with the shortest possible delay, but not necessarily with the highest possible accuracy. The SOD when used with intracranial recordings, for seizure identification and retrospective analysis of seizures, often in the context of presurgical evaluations, it can be relatively straightforward to detect with reasonable sensitivity and specificity since it is dealing with events often lasting over a minute [22]. Another use of SOD with extracranial recordings to distinguish between primary and secondary irritative areas may be difficult, because a interictal discharge can spread via normal anatomical connections between cortical areas, through the commissural fibers or via subcortical structures, finally this may lead to widespread or bilateral occurrence of interictal discharges [45].
Seizure onset detection was first investigated in the seventies by Viglione et al. [50] and Liss et al.[30], and with later contributions by Ktonas et al. [27] and Gotman et al. [14]. Moreover,
several works studied linear and nonlinear prediction techniques to separate transients from background activity. For example, filter techniques [3], power spectrum techniques [11], cross-correlation techniques [52], principal and independent component analysis techniques [33], [20] have been investigated. Other examples include techniques based on wavelet representations [15], state space reconstruction [35], correlation measures [43], signal dimension [17], density [29], integral [41], mutual prediction [44], Lyapunov exponents [19], synchronization [40], similarity measures [18], recurrence quantification measures [47], and nonlinear predictability [4]. We refer the reader to [49] for a comprehensive treatment of measurement, models, detection and prediction. Other important surveys of the literature in this topic can be found in [23], [15], [26], [7], [21], [53], [34], [28], [8], [48].
Modern SOD methods can be grouped into the following categories: 1) Template matching: These are techniques based on finding events tha match previously selected spikes; the detection is made whenever the cross correlation of the EEG with a template exceeds a threshold [31]; 2) Parametric methods: These techniques are based on traditional signal processing and consider that a seizure has occurred when the difference between the EEG signal and a predicted value (based on the assumption that the background is stationary) exceeds a threshold [2]; 3)Mimetic Methods: these techniques seek to copy the human expert (i.e. neurophysiologist) and operate by monitoring the value of parameters computed from each wave and applying thresholds [13], [6], [25]; 4) Morphologic Analysis: these techniques are based on the characterisation of the waveforms in terms of sharpness, amplitude, duration, convexity, frequency bands or time-frequency representations of spikes [13], [16]; 5) Syntactic methods: these techniques are based on the detection of the presence of structural features [51]; 6) Neural Networks: this approach adopts a machine learning perspective to learn transients related to epileptic seizures [42], [38]; 7) Expert systems: this approach detects seizures by mimicking an expert’s knowledge and reasoning process[12]; 8)Data mining techniques: this approach also adopts a machine learning perspective to train a classifier [8], [9], [48]; 9)Clustering Techniques: in this case detections are based on hierarchical agglomerative processes and self-organising maps [3], [48]; 10) Knowledge-based rules: these techniques seek to incorporate knowledge from neurophysiologists who adopt spatial and temporal rules [5], [7], [5], [48].
3. Generalized Gaussian Distribution
The univariate generalised Gaussian distribution (GGD) is a flexible statistical model that has found numerous applications in science and engineering, and which recently was use to model epilepsy signals in [39]. This statistical model has 3 parameters, with a probability density function (PDF) given by:
f(x;µ, σ,B) = B 2A(σ)Γ(B1)exp− |(x−µ)|B 2σ2 (1) with A(σ) =σ r Γ(B1) Γ(B3), Γ(z) = R+∞ 0 ete −z−1dt, z >0
and where µ∈ Ris a location parameter, σ ∈ R+ is a scale parameter andB ∈ R+ is a shape parameter that controls the shape of the density tail. The density (1) has many properties that are useful for modelling signals: i) the value of (1) approaches zero as x approaches positive and negative infinity, ii) the mean and mode of (1) coincide and are given by µ, iii) (1) is symmetric with respect to the mean value µ. Notice that the GGD parametric family comprises many popular distributions that are commonly used in biomedical signal processing. For example, setting B= 1 leads to a Laplacian or double-exponential distribution, B = 2 to a Gaussian or normal distribution, and B → ∞ to a uniform distribution. We refer the reader to [36] for a comprehensive treatment of the mathematical properties of the GGD statistical model.
4. Methodology
The first step of the proposed methodology is to represent the EEG signals in a time-frequency domain. This step allows decomposing each one of the EEG channels in the signal array into five frequency bands associated with the five brain rhythms that clinicians typically use to capture different types of neurological activity. We believe that this decomposition is very useful for SOD because there are rhythms or frequency patterns that appear often at the beginning of the epileptic crisis and that are difficult to quantify visually. We have used a time-frequency representation associated with the following bands: Delta: 0.5-4Hz, Theta: 4-8Hz, Alpha: 8-13Hz, Beta: 13-30Hz and Gamma: 30-45Hz. In order to achieve this we used a multilevel 1-D wavelet decomposition filter constructed using a Dauchebies wavelet decomposition with five resolution scales. From the wavelet decomposition it is then possible to determine how the energy in the signal is spread over the different brain rhythms, and how this distribution of energy evolves over time. Precisely, this information is captured by modelling the signals associated each each brain rhythm with a GGD statistical model, whose parameters A and
B are estimated from the observed data, see equation (1). The shape parameter A is closely related to the variability of the brain activity and is therefore a good descriptor for performing SOD detection.
We evaluated the performance of the proposed seizure onset detector and spread estimation algorithms by using the Children’s Hospital Boston database [45], which consists of 36 EEG recordings from paediatric subjects with intractable seizures. In this work we used 30 crisis from 11 subjects. A set including two to five bipolar EEG recordings sampled at 256Hz were available for each subject. Each recording contained a seizure event with a labeled onset that was detected by an experienced neurologist, who worked backward from the observed clinical onset to find the electrographic onset. Each signal was edited to have an epoch with the following characteristics: 2 minutes before crisis, crisis at minute 2 and 2 minutes after crisis.
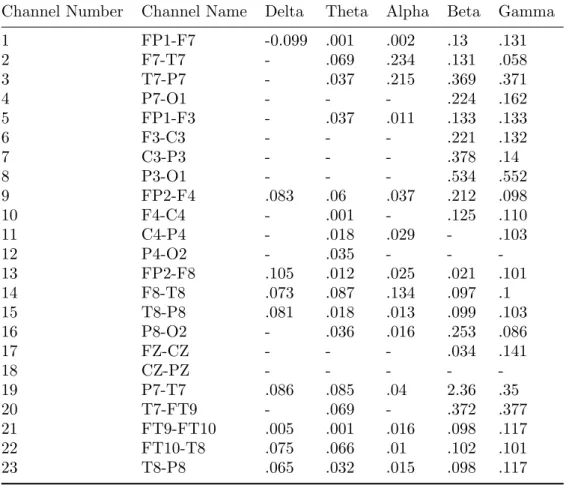
For each epoch we know where the crisis begins and can calculate the onset delay by comparing the average amplitude with the background, similar to [16]. Once onset delay estimation has been performed for each brain rhythm and each channel (by performing SOD with the respective parameter A), we collect this information in a table that allows identifying channels with low delay and thus understanding how the seizure originated and propagated. This is illustrated in Figures (1) to (6) and Table (1). The proposed algorithm can be summarised as follows:
(i) Separate each EEG signal in the array of signals into the different physiological brain frequency bands.
(ii) Estimate the GGD parameters A andB, see eq. (1).
(iii) Use the parameter A to calculate the delays of each SOD for each channel and each frequency bands.
(iv) Create a table with the information and calculate each delay for each channel by frequency bands.
(v) Organize the table ascendently.
(vi) Calculate the SOD candidate channels for the different brain areas (i.e. Frontal, Parietal, Temporal and Occipital).
(vii) The candidates for the onset are the channels that are common to all other channels by frequency band in a determined brain area; and the other channels are the possible spread accompanying the crisis.
Table 1. Onset Delay (in seconds) by Frequency Bands, the symbol (-) means that there is no clear difference in the beginning of the onset. In this example, according to the data, the channels (13) FP2-F8, (14) F8-T8 and (15) T8-P8 are the best candidates by brain area for SOD because it have minor delays; in this case F8 is common to all channels in this brain area, therefore is the best option for be the onset and the other channels form the spread.
Channel Number Channel Name Delta Theta Alpha Beta Gamma 1 FP1-F7 -0.099 .001 .002 .13 .131 2 F7-T7 - .069 .234 .131 .058 3 T7-P7 - .037 .215 .369 .371 4 P7-O1 - - - .224 .162 5 FP1-F3 - .037 .011 .133 .133 6 F3-C3 - - - .221 .132 7 C3-P3 - - - .378 .14 8 P3-O1 - - - .534 .552 9 FP2-F4 .083 .06 .037 .212 .098 10 F4-C4 - .001 - .125 .110 11 C4-P4 - .018 .029 - .103 12 P4-O2 - .035 - - -13 FP2-F8 .105 .012 .025 .021 .101 14 F8-T8 .073 .087 .134 .097 .1 15 T8-P8 .081 .018 .013 .099 .103 16 P8-O2 - .036 .016 .253 .086 17 FZ-CZ - - - .034 .141 18 CZ-PZ - - - - -19 P7-T7 .086 .085 .04 2.36 .35 20 T7-FT9 - .069 - .372 .377 21 FT9-FT10 .005 .001 .016 .098 .117 22 FT10-T8 .075 .066 .01 .102 .101 23 T8-P8 .065 .032 .015 .098 .117
Figure 1. Afor Channel 13. Figure 2. Afor Channel 14.
No distinctions regarding the types of seizure onsets were considered; the data contains focal, lateral, and generalized seizure onsets. Furthermore, the recordings were made in a
Figure 3. Afor Channel 15. Figure 4. Afor Channel 16.
Figure 5. Afor Channel 10. Figure 6. Afor Channel 11.
routine clinical environment, so non-seizure activity and artifacts such as head/body movement, chewing, blinking, early stages of sleep, and electrode pops/movement are present in the data. The set of recordings lasted on average 35 minutes for 30 subjects in total; 2 hours for 4 subjects; and 12 hours for 2 other subjects. Taken together the recordings account for 60 hours of EEG recordings and 139 seizures [45].
5. Results
The performance of the algorithm proposed for seizure onset detector and spread estimation was assessed using the Children’s Hospital Boston database described above, and by comparing results with those obtained by visual inspection by an experimented neurologist relying on EEG and MRI data.
For illustration figure (8) shows the EEG and MRI image for one patient; this information allows the reconstruction of a model of the brain and the determination of the location where the seizure was originated, as well as how is spread throughout the brain, which allows is the information that our algorithm seeks to estimate directly from the EEG.
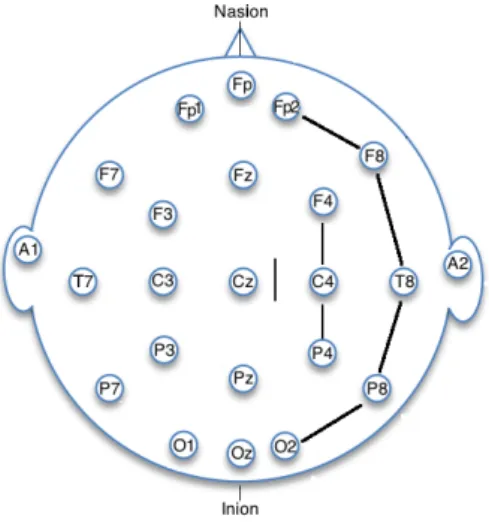
In this SOD example, we can see theAparameter in the x-axis, se Figures (1) to (6), which correspond to right temporal brain area. Our algorithm shows that the seizure starts in channel F8 and then spreads across the channels F8-T8-P8, F4-C4-P4, as is shown the data in table (1)
and Figure (7).
Channels with the minor delay in the right temporal brain area: (13) FP2-F8, (15) T8-P8, (22) FT10-T8, (14) F8-T8, (12) P4-O2.
Figure 7. EEG electrodes Array, shows that the seizure starts in channel F8 and then spreads across the channels F8-T8-P8, F4-C4-P4
Spread by Delta Bands: (10) F4-C4, (21) FT9-FT10, (11) C4-P4, (23) T8-P8, (14) F8-T8, (22) FT10-T8, (15) T8-P8, (9) FP2-F4, (19) P7-T7, (1) FP1-F7, (13) FP2-F8.
Spread by Theta Bands: (1) FP1-F7, (21) FT9-FT10, (13) FP2-F8, (15) T8-P8, (11) C4-P4, (23) T8-P8, (16) P8-O2, (3) T7-P7, (5) FP1-F3, (9) FP2-F4, (22) FT10-T8, (2) F7-T7, (20) T7-FT9, (19) P7-T7, (14) F8-T8.
Spread by Alpha Bands: (1) FP1-F7, (22) FT10-T8, (5) FP1-F3, (15) T8-P8, (23) T8-P8, (16) P8-O2, (21) FT9-FT10, (13) FP2-F8, (12) P4-O2, (9) FP2-F4, (19) P7-T7, (14) F8-T8, (3) T7-P7, (2) F7-T7.
Spread by Beta Bands: (13) FP2-F8, (17) FZ-CZ, (14) F8-T8, (21) FT9-FT10, (23) T8-P8, (15) T8-P8, (22) FT10-T8, (10) F4-C4, (1) FP1-F7, (2) F7-T7, (5) FP1-F3, (9) FP2-F4, (6) F3-C3, (4) P7-O1, (16) P8-O2, (3) T7-P7, (20) T7-FT9, (7) C3-P3, (8) P3-O1, 19 P7-T7.
Spread by Gamma Bands: (2) F7-T7, (16) P8-O2, (9) FP2-F4, (14) F8-T8, (13) FP2-F8, (22) FT10-T8, (11) C4-P4, (15) T8-P8, (10) F4-C4, (21) FT9-FT10, (23) T8-P8, (1) FP1-F7, (6) F3-C3, (5) FP1-F3, (7) C3-P3, (17) FZ-CZ, (4) P7-O1, (19) P7-T7, (3) T7-P7, 20 T7-FT9, (8) P3-O1.
6. Discussion
The preliminary results reported in this work suggest that the proposed algorithm is potentially useful for onset detection and spread estimation, and that performing the analysis at the level of the brain activity rhythm bands can improve the identification of the area of the brain affected. This suggests that the algorithm is potentially interesting for devising automatic processing systems.
Figure 8. For illustration, the figure shows the EEG of a patient (left) with his corresponding MRI (right top). A reconstruction of the brain is shown with his corresponding brain spread (left bottom). On the right of each image is a color map which indicates the intensity of each sour activation.
Another interesting research questions to explore in more depths, are related with the analysis of the frequency bands detected before the onset seizure, and which channels are active despite not participating directly in the detection of the seizure onset.
Perspective for future work include an extensive evaluation of the proposed methodology, as well as performing comparisons with other detection methods from the state of the art, and the development of fusion techniques to combine detections from several algorithms to increase robustness to noise and to artefacts.
7. Acknowledgements
Part of this work was funded by the SuSTaIN program - EPSRC grant EP/D063485/1 - at the Department of Mathematics, University of Bristol.
Marcelo Pereyra holds a Marie Curie Intra-European Fellowship for Career Development. The authors acknowledges to Gabriela Ugarnes, from Fundaci´on contra las Enfermedades Neurol´ogicas Infantiles (FLENI), Argentina.
8. References
[1] World health organization. mental health action plan 2013-2020. who document production services, geneva, switzerland.
[2] Kaoru Arakawa, Derek H. Fender, Hiroshi Harashima, Hiroshi Miyakawa, and Yoichi Saitoh. Separation of a nonstationary component from the eeg by a nonlinear digital filter. Advances in Behavioral Biology, 33(7):724–726, 1986.
for the detection of epileptic transients in eeg. IEEE Transactions on Biomedical Engineering, 25(3):213– 217, 1978.
[4] K. J. Blinowska and M. Malinowski. Non-linear and linear forecasting of the eeg time series. Biological Cybernetics, 66(2):159–165, 1991.
[5] B. Davey, W.R. Fright, G.J. Caroll, and R.D. Jones. Expert system approach to detection of epileptiform activity in the eeg. Medical and Biological Engineering and Computing, 27:365–370, 1989.
[6] P. Guedes de Oliveira, C. Queiroz, and F.H. Lopes da Silva. Spike detection based on a pattern recognition approach using a microcomputer. Electroencephalography and Clinical Neurophysiology, 56(1):97–103, 1983.
[7] Alison A. Dingle, , Richard D. Jones, and Grant J. Carroll W. Richard Fright. A multisatge system to detect epileptiform activity in the eeg. IEEE Transactions on Biomedical Engineering, 40(12):1260–1268, 1993. [8] Mahmoud El-Gohary, James McNames, and Siegward Elsas. User-guided interictal spike detection. 30th Annual International Conference of the IEEE in Engineering in Medicine and Biology Society, pages 821– 824, 2008.
[9] Themis P. Exarchos, Alexandros T. Tzallas, Dimitrios I. Fotiadis, Spiros Konitsiotis, and Sotirios Giannopoulos. Eeg transient event detection and classification using association rules. IEEE Transactions on Information Technology in Biomedicine, 10:451–457, 2006.
[10] Robert S. Fisher, Carlos Acevedo, Alexis Arzimanoglou, Alicia Bogacz, J. Helen Cross, Christian E. Elger, Jerome Engel Jr., Lars Forsgren, Jacqueline A. French, Mike Glynn, Dale C. Hesdorffer, B.I. Lee, Gary W. Mathern, Solomon L. Moshe, Emilio Perucca, Ingrid E. Scheffer, Torbjorn Tomson, Masako Watanabe, and Samuel Wiebe. Ilae official report: A practical clinical definition of epilepsy. Epilepsia, 55(4):475–482, 2014.
[11] R.S. Fisher, W.R. Webber, R.P. Lesser, S. Arroyo, and S.R.S. Uematsu. High-frequency eeg activity at the start of seizures. Journal of Clinical Neurophysiology, 9(3):441–448, 1992.
[12] John R. Glover, Narasimha Raghavan, Periklis Y. Ktonas, and James D. Frost Jr. Context-based automated detection of epileptogenic sharp transients in the eeg: Elimination of false positives. IEEE Transactions on Biomedical Engineering, 36:519–527, 2003.
[13] J. Gotman and P. Gloor. Automatic recognition and quantification of interictal epileptic activity in the human scalp eeg. Electroencephalography and Clinical Neurophysiology, 41(5):513–529, 1976.
[14] J. Gotman, J.R Ives, and P. Gloor. Automatic recognition of inter-ictal epileptic activity in prolonged eeg recordings. Electroencephalography and Clinical Neurophysiology, 46(5):510–520, 1979.
[15] Jean Gotman. Computer analysis of the eeg in epilepsy. Clinical applications of computer analysis of EEG and other neurophysiological signals, Elsevier Amsterdam, pages 171–204, 1986.
[16] Jean Gotman. Automatic seizure detection: improvements and evaluation. Electroencephalography and Clinical Neurophysiology, 76(4):317–324, 1990.
[17] Peter Grassberger and Itamar Procaccia. Characterization of strange attractors. Physical Review Letters, 50:346–349, 1983.
[18] L.M. Hively, P.C. Gailey, and V.A. Protopopescu. Detecting dynamical change in nonlinear time series.
Physical Letter A, 258:103–114, 1999.
[19] Leonidas D. Iasemidis and J. Chris Sackellares. Chaos theory and epilepsy. Neuroscientist, 2:118–126, 1996. [20] Anthony J.Bell and Terrence J. Sejnowski. An information-maximization approach to blind separation and
blind deconvolution. Neural Computation, 7(6):1004–1034, 1995.
[21] K.K. Jerger, T.I. Netoff, J.T. Francis, T. Sauer, L. Pecora, S.L. Weinstein, and S.J.: Schiff. Early seizure detection. in: Journal of clinical neurophysiology. Journal of Clinical Neurophysiology, 18(3):259–268, 2001.
[22] Christophe C. Jouny, Piotr J. Franaszczuk, and Gregory K. Bergey. Improving early seizure detection.
Epilepsy and Behavior, 22(1):S44–S48, 2011.
[23] J.D. Frost Jr. Automatic recognition and characterization of epileptiform discharges in the human eeg.
Journal of Clinical Neurophysiology, 2(3):231–249, 1985.
[24] Jerome Engel Jr. Epilepsy Board Quick Review Selected Tables and Figures from Seizures and Epilepsy. Oxford University Press, 2014.
[25] Periklis Y. Ktonas. Automated analysis of abnormal electroencephalograms. Critical Reviews in Biomedical Engineering, 9(1):39–97, 1983.
[26] Periklis Y. Ktonas. Automated spike and sharp wave (ssw) detection. Methods of analysis of brain electrical and magnetic signals. Elsevier Amsterdam, pages 211–411, 1987.
[27] P.Y. Ktonas and J.R. Smith. Quantification of abnormal eeg spike characteristics. Computers in Biology and Medicine, 4(2):157–163, 1974.
[28] Klaus Lehnertza and Brian Litt. The first international collaborative workshop on seizure prediction summary and data description. Journal of Clinical Neurophysiology, 116:493–505, 2005.
[29] David E. Lerner. Monitoring changing dynamics with correlation integrals: case study of an epileptic seizure.
Physica D: Nonlinear Phenomena, 97:563–576, 1996.
[30] S. Liss. Apparatus for monitoring and counteracting excess brain electrical energy to prevent epileptic seizures and the like. US patent No. 3850161, 1973.
[31] D.S.L. Lloyd, C.D. Binnie, and B.G. Batchelor. Pattern recognition in eeg. Advances in Behavioral Biology, 5:153–166, 1972.
[32] Hans O. Luders. Textbook of Epilepsy Surgery. CRC Press, 2008.
[33] J. Maier, G. Dagnelie, H. Spekreijse, and B.W. van Dijk. Principal components analysis for source localization of veps in man. Vision Research, 27(2):165–177, 1987.
[34] Patrick E. McSharry, Leonard A. Smith, and Lionel Tarassenko. Comparison of predictability of epileptic seizures by a linear and a nonlinear method. IEEE Transactions on Biomedical Engineering, 50(5):628– 633, 2003.
[35] A.M. Murro, D.W. King, J.R. Smith, B.B. Gallagher, H.F. Flanigin, and K. Meador. Computerized seizure detection of complex partial seizures. Electroencephalography and Clinical Neurophysiology, 79(4):330–333, 1991.
[36] Saralees Nadarajah. A generalized normal distribution. Journal of Applied Statistics, 32(7):685–694, 2005. [37] Ivan Osorio, Hitten P. Zaveri, Mark G. Frei, and Susan Arthurs. EPILEPSY, The Intersection of Neurosciences, Biology, Mathematics, Engineering, and Physics. CRC Press Taylor and Francis Group, 2011.
[38] Clement C. C. Pang, Adrian R.M. Upton, Glenn Shine, and Markad V. Kamath. A comparison of algorithms for detection of spikes in the electroencephalogram. IEEE Transactions on Biomedical Engineering, 50(4):521–525, 2003.
[39] Antonio Quintero-Rinc´on, Hadj Batatia, Marcelo Pereyra, and Marcelo Risk. Detection of onset in epilepsy signals using generalized gaussian distribution. Fifth International Conference on Advances in New Technologies, Interactive Interfaces and Communicability, 2014, 2014.
[40] R. Quian Quiroga, J. Arnhold, and P. Grassberger. Learning driver-response relationships from synchronization patterns. Physical Review E, 61(5):5142–5148, 2000.
[41] M. Le Van Quyen, J. Martinerie, M. Baulac, and F. Varela. Anticipating epileptic seizures in real time by a nonlinear analysis of similarity between eeg recordings. NeuroReport, 10(10):2149–2155, 1999.
[42] R.C.Eberhart, R.W. Dobbins, and W.R.S. Webber. Eeg wavefonn analysis using casenet. Proceedings of the Annual International Conference of the IEEE Engineering in Engineering in Medicine and Biology Society. Images of the Twenty-First Century, 6:2043–2047, 1989.
[43] Michael G. Rosenblum, Arkady S. Pikovsky, and Jurgen Kurths. Phase synchronization of chaotic oscillators.
Physical Review Letters, 76:1804–1807, 1996.
[44] Steven J. Schiff, Paul So, Taeun Chang, Robert E. Burke, and Tim Sauer. Detecting dynamical interdependence and generalized synchrony through mutual prediction in a neural ensemble. Physical Review Letters, 54:6709–6724, 1996.
[45] Ali Shoeb, Herman Edwards, Jack Connolly, Blaise Bourgeois, S. Ted Treves, and John Guttagf. Patient-specific seizure onset detection. Epilepsy and Behavior, 5:483–498, 2004.
[46] W. Henry Smithson and Matthew C. Walker. ABC of Epilepsy. BMJ Books, 2012.
[47] Nitza Thomassona, Thomas J. Hoeppnerb, Charles L. Webber Jr., and Joseph P. Zbiluta. Recurrence quantification in epileptic eegs. Physical Letter A, 279:94–101, 2001.
[48] Alexandros T. Tzallas, Markos G. Tsipouras, Dimitrios G. Tsalikakis, Evaggelos C. Karvounis, Loukas Astrakas, Spiros Konitsiotis, and Margaret Tzaphlidou. Automated Epileptic Seizure Detection Methods: A Review Study. Epilepsy - Histological, Electroencephalographic and Psychological Aspects. Dr. Dejan Stevanovic Editions InTech, 2012.
[49] Andrea Varsavsky, Iven Mareels, and Mark Cook. Epileptic seizures and the EEG Measurement, Models, Detection and Prediction. CRC Press, Taylor and Francis Group, 2011.
[50] S.S. Viglione, V.A. Ordon, and F. Risch. A methodology for detecting ongoing changes in the eeg prior to clinical seizures. 21st Western Institute on Epilepsy, 1973.
[51] Russell Walters, Jos´e C. Principe, and Seung-Hun Park. Spike detection using a syntactic pattern recognition approach. Proceedings of the Annual International Conference of the IEEE Engineering in Engineering in Medicine and Biology Society, 6:1810–1811, 1989.
[52] Norbert Wiener. Cybernetics or control and communication in the animal and the machine. The MIT Press, 1965.
[53] Scott B. Wilson and Ronald Emerson. Spike detection: A review and comparison of algorithms. Journal of Clinical Neurophysiology, 113(12):1873–1881, 2002.