COMBATING USER MISBEHAVIOR ON SOCIAL MEDIA
A Dissertation by CHENG CAO
Submitted to the Office of Graduate and Professional Studies of Texas A&M University
in partial fulfillment of the requirements for the degree of DOCTOR OF PHILOSOPHY
Chair of Committee, James Caverlee Committee Members, Jianer Chen
Richard Furuta Randy Kluver Head of Department, Dilma Da Silva
December 2017
Major Subject: Computer Science
ABSTRACT
Social media encourages user participation and facilitates user’s self-expression like never before. While enriching user behavior in a spectrum of means, many social media platforms have become breeding grounds for user misbehavior. In this dissertation we focus on understanding and combating three specific threads of user misbehaviors that widely exist on social media — spamming, manipulation, and distortion.
First, we address the challenge of detecting spam links. Rather than rely on traditional blacklist-based or content-based methods, we examine the behavioral factors of both who is posting the link and who is clicking on the link. The core intuition is that these behav-ioral signals may be more difficult to manipulate than traditional signals. We find that this purely behavioral approach can achieve good performance for robust behavior-based spam link detection.
Next, we deal with uncovering manipulated behavior of link sharing. We propose a four-phase approach to model, identify, characterize, and classify organic and organized groups who engage in link sharing. The key motivating insight is that group-level behav-ioral signals can distinguish manipulated user groups. We find that levels of organized behavior vary by link type and that the proposed approach achieves good performance measured by commonly-used metrics.
Finally, we investigate a particular distortion behavior: making bullshit (BS) state-ments on social media. We explore the factors impacting the perception of BS and what leads users to ultimately perceive and call a post BS. We begin by preparing a crowd-sourced collection of real social media posts that have been called BS. We then build a classification model that can determine what posts are more likely to be called BS. Our experiments suggest our classifier has the potential of leveraging linguistic cues for
detect-ing social media posts that are likely to be called BS.
We complement these three studies with a cross-cutting investigation of learning user topical profiles, which can shed light into what subjects each user is associated with, which can benefit the understanding of the connection between user and misbehavior. Concretely, we propose a unified model for learning user topical profiles that simultaneously considers multiple footprints and we show how these footprints can be embedded in a generalized optimization framework.
Through extensive experiments on millions of real social media posts, we find our proposed models can effectively combat user misbehavior on social media.
DEDICATION
ACKNOWLEDGMENTS
I owe my gratitude to all who made this dissertation possible.
I consider myself extremely lucky to have Dr. James Caverlee as my advisor. I al-ways admire his visions in finding interesting and important research problems. He keeps guiding me to take the most innovative perspectives for solving the right problems or ap-plications. He has the best presentation skills I have ever seen. Fortunately, I have learned a lot from him through our countless iterations of editing slides and practicing talks. He teaches me how to make the slides organized with a clear storyline. He advises me how to write a well-organized paper. In daily life, besides research, it is not an exaggeration to say that my advisor is more like my friend. He is such a wonderful person that I am pretty sure I have some uniquely great experience with my advisor that other graduate students in the world do not have. We walk to Starbucks to grab a cup of coffee together. We talk about yesterday’s football games and this week’s new movies. Sometimes he shares his life lessons with me. I will forever be grateful to his mentorship and inspiration on me.
I would like to thank the rest of my dissertation committee — Dr. Richard Furuta, Dr. Jianer Chen, and Dr. Randy Kluver — for their invaluable feedbacks on my dissertation and serving on my committee.
I owe special thanks to my good friends, Dr. Xia Hu and Dr. Kyumin Lee. My collaborations with them have been one of the most enriching experience in my pursuing of PhD. I learned a lot from their working styles.
My journey of PhD study has been vibrant and exciting thanks to all my lab-mates: Majid Alfifi, Hancheng Ge, Habeeb Hooshmand, Parisa Kaghazgaran, Haokai Lu, Wei Niu, Henry Qiu, Haiping Xue, Yin Zhang, and Xing Zhao.
when I was a junior undergraduate student in China. Her suggestion changed the trajectory of my life. I want to thank my whole family for their ever-lasting love and support.
I am deeply indebted to my wife Xi. She has endured much because of me. She has devoted herself to me and our child. This dissertation is for her, the love of my life.
CONTRIBUTORS AND FUNDING SOURCES
Contributors
This work was supported by a dissertation committee consisting of Professor James Caverlee, Richard Furuta, and Jianer Chen of the Department of Computer Science and Engineering and Professor Randy Kluver of the Department of Communication.
All work conducted for this dissertation was completed by the student independently. Funding Sources
TABLE OF CONTENTS
Page
ABSTRACT . . . ii
DEDICATION . . . iv
ACKNOWLEDGMENTS . . . v
CONTRIBUTORS AND FUNDING SOURCES . . . vii
TABLE OF CONTENTS . . . viii
LIST OF FIGURES . . . xi
LIST OF TABLES. . . xiii
1. INTRODUCTION . . . 1
1.1 Motivation . . . 1
1.2 Research Challenges . . . 3
1.3 Contributions of This Dissertation . . . 5
1.3.1 Detecting Spam Links via Behavioral Analysis. . . 5
1.3.2 Revealing Organized Link Sharing Behavior . . . 6
1.3.3 Identifying BS on Social Media . . . 7
1.3.4 A Cross-cutting Component: Learning User Topical Profile . . . 8
1.4 Structure of This Dissertation . . . 10
2. COMBATING SPAMMING: DETECTING SPAM LINKS VIA BEHAVIORAL ANALYSIS . . . 11
2.1 Introduction. . . 11
2.2 Related Work . . . 14
2.3 Behavior-based Spam Link Detection. . . 15
2.3.1 Problem Statement and Setup . . . 15
2.3.2 Posting-based Features . . . 17
2.3.3 Click-based Features . . . 19
2.4 Experiments . . . 22
2.4.1 Experimental Setup . . . 22
2.5 Summary . . . 29
3. COMBATING MANIPULATION: REVEALING ORGANIZED LINK SHAR-ING BEHAVIOR . . . 30
3.1 Introduction. . . 30
3.2 Related Work . . . 34
3.3 Methodology . . . 35
3.3.1 Modeling the Behavior of Link Sharing . . . 36
3.3.1.1 User, link, and posting . . . 36
3.3.1.2 User similarity in link sharing . . . 37
3.3.2 Identifying User Groups . . . 38
3.3.2.1 The kNN user graph . . . 38
3.3.2.2 Extracting user groups . . . 39
3.3.3 Characterization: Organized vs. Organic. . . 40
3.3.3.1 Posted link based features. . . 40
3.3.3.2 Posting time based features . . . 42
3.3.3.3 Poster profile based features . . . 42
3.3.4 Classification: Organized vs. Organic . . . 44
3.4 Experiments . . . 45
3.4.1 Data . . . 45
3.4.2 Collecting User Groups . . . 46
3.4.3 Ground Truth . . . 48
3.4.3.1 Manual labeling setup . . . 49
3.4.3.2 Categorizing a user group . . . 50
3.4.3.3 Rating a user group . . . 53
3.4.4 Experiments: Organized vs. Organic . . . 54
3.4.4.1 Analyzing our labeling . . . 54
3.4.4.2 Classifying organized and organic groups . . . 55
3.5 Summary . . . 59
4. COMBATING DISTORTION: IDENTIFYING BS ON SOCIAL MEDIA . . . 61
4.1 Introduction. . . 61
4.2 Related Work . . . 66
4.3 Data Collection . . . 67
4.3.1 Filtering the Data: BS vs. Called BS . . . 68
4.3.2 Problem Formulation . . . 71
4.4 What Tweets are Likely to be Called BS? . . . 73
4.4.1 Overview . . . 73
4.4.2 Attitude . . . 75
4.4.3 Sentiment . . . 77
4.4.5 Content . . . 80
4.5 Experiments . . . 82
4.5.1 Data Exploratory Analysis . . . 82
4.5.2 Classification . . . 88
4.6 Summary . . . 90
5. A CROSS-CUTTING COMPONENT: LEARNING USER TOPICAL PROFILES 91 5.1 Introduction. . . 91
5.2 Related Work . . . 94
5.3 Preliminaries . . . 96
5.4 Learning User Topical Profiles . . . 98
5.4.1 Modeling Implicit Footprints . . . 99
5.4.2 Learning User Topical Profiles: A 2-D Model . . . 102
5.4.3 Learning User Topical Profiles: A Generalized Model . . . 106
5.5 Experiments . . . 110
5.5.1 Experiment Setup . . . 110
5.5.2 The Impact of Different Footprints . . . 113
5.5.3 Evaluating UTop and UTop+ . . . 115
5.5.4 Considering Other Variants . . . 116
5.6 Summary . . . 118
6. SUMMARY AND FUTURE WORK . . . 120
6.1 Summary of This Dissertation . . . 120
6.2 Future Work . . . 122
LIST OF FIGURES
FIGURE Page
1.1 An overview of all problems studied in this dissertation . . . 3
2.1 Studying spam link detection in social media from two perspectives: (i) Posting behavior (left); (ii) Click behavior (right) . . . 13
2.2 Distribution of postings and clicks for the sampled dataset. . . 16
2.3 The click and post timelines for two links. In (a), post and click behaviors are tightly coupled. In (b), the relationship is more relaxed. . . 20
2.4 Example feature comparison for spam and benign links . . . 28
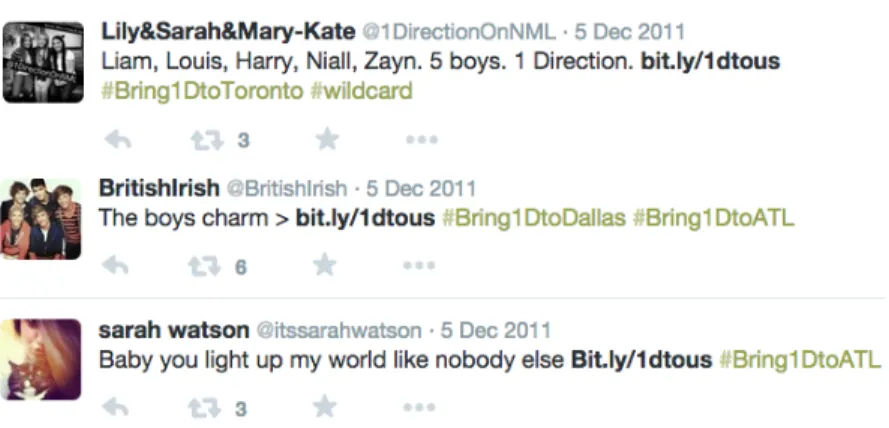
3.1 One example of three users who have organically posted the same link: bit.ly/1dtous . . . 32
3.2 Four users seemingly post link for a voting campaign . . . 32
3.3 Four users suspiciously cooperate to post the same link . . . 32
3.4 Three users coordinate to post the same advertising link . . . 33
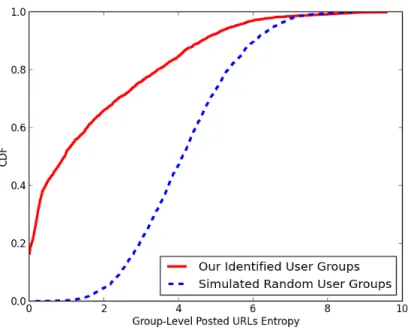
3.5 The link posting entropy CDF of our collected user groups, compared with a collection of simulated random groups. . . 48
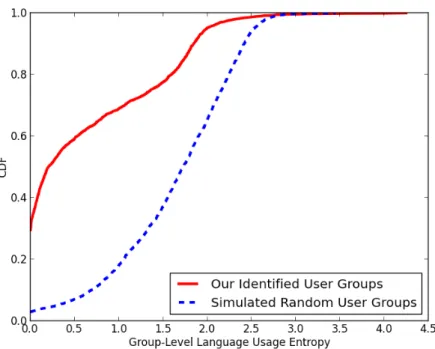
3.6 The language usage entropy CDF of our collected user groups, compared with a collection of simulated random groups . . . 49
3.7 Example users whose group is organized . . . 52
3.8 Example users whose group we categorize into “spam” and think is organized 52 3.9 The CDFs of our ratings for all 12 types of group categories . . . 56
3.10 Evaluation results by four classification methods . . . 56
3.11 The recall results for the class of organized group by four classification methods . . . 57
3.12 Organized vs. organic: number of link domain names . . . 59
3.13 Organized vs. organic: group-level suspension ratio . . . 60
4.1 A published controversial tweet that is BS-like . . . 62
4.2 Two real posts; are either BS? . . . 64
4.3 Human judgment over six groups of tweets . . . 71
4.4 Two tweets from our dataset . . . 72
4.5 Four perspectives characterizing what posts are likely to be perceived as BS 75 4.6 Likely called vs. unlikely called: subjectivity and assertiveness . . . 77
4.7 Likely called vs. unlikely called: politics-related poster . . . 82
4.8 Accounts that have been called BS the most . . . 83
4.9 Top focuses of users with BS-called tweets. . . 84
4.10 Geographic distributions of BS-called tweets and BS calling tweets . . . 86
4.11 Geographic distributions of Trump’s BS calls and Clinton’s supporters . . . 87
5.1 Examples of different implicit footprints on learning user topical profiles. . . 99
5.2 An overview of the 2-D model (UTop). . . 103
5.3 An overview of the generalized model (UTop+) . . . 107
5.4 Comparisons between proposed models and alternative baselines . . . 116
5.5 Comparisons between UTop and standard MF . . . 117
5.6 Comparisons between UTop+ and TFMF. . . 118
LIST OF TABLES
TABLE Page
2.1 Evaluation results for the list-based dataset . . . 24
2.2 Top-10 features for list-labeled dataset (Chi-square) . . . 25
2.3 Evaluation results for the manually-labeled dataset . . . 26
2.4 Top-10 features for manually-labeled dataset (Chi-square) . . . 27
3.1 Dataset Summary . . . 46
3.2 The distribution (percentage) of twelve categories that we have labeled for our user groups . . . 51
3.3 The rankings of the feature impact measured by Chi-Squared and Info Gain 58 4.1 Overview of BS-called tweets . . . 68
4.2 Classification performances (95% CIs) over four algorithms and five fea-ture sets . . . 89 5.1 The impact of different implicit footprints for learning user topical profiles. 114
1. INTRODUCTION
1.1 Motivation
The cornerstone of social media is user-generated behavioral activity. For example, users power these systems by sharing content, commenting, messaging, befriending, and engaging in among many other behaviors. This behavioral activity implicitly reveals user preferences, interests, and relationships (e.g., Youtube users vote “like” or “dislike” for a video; Twitter users retweet or mention other’s tweets), which can play an important role in a variety of applications. For example, for social media service providers, by understanding how their users behave in the system, they can improve their system’s per-sonalization module to enhance user experience. For online marketers, they can exploit user’s preference and interaction patterns to spread their content quickly and widely [1]. For Internet service providers, learning traffic patterns on social media websites can guide traffic optimization in their infrastructures [2].
While facilitating user’s self-expression and information spread like never before [3, 4], many social media platforms have also become major breeding grounds foruser mis-behavior. These misbehaviors lead to a big volume of misinformation on social media such as spam [5, 6], fraud [7, 8], and rumors [9, 10], which may result in several levels of damage to user experience and even society. For example, spammers on Facebook send victims unsolicited requests and messages many of which include links to commercial ads, phishing websites, or malware [6, 11, 12]. Fake accounts on Yelp purposely post deceptive reviews to mislead potential customers due to profit or fame [13, 14]. It has been observed that abusive behaviors on Twitter have considerable influence on the outcome of political campaigns [15, 16, 17]. And rumors that are deliberately spread during mass emergencies and disasters (e.g., Hurricane Sandy in 2012 and Boston Marathon bombing in 2013), can
cause anxiety, panic, and insecurity to the whole society [8, 9, 18].
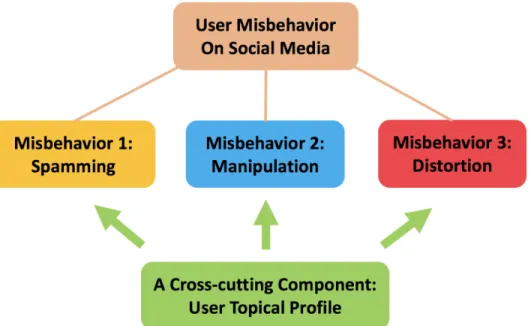
In this dissertation we focus on understanding and combating three specific threads of user misbehavior that widely exist on social media — spamming, manipulation, and distortion (see Figure 1.1). And toward combating these misbehaviors, we investigate one specific important application for each misbehavior as follows:
• Misbehavior 1: Spamming. First, we address the problem of detecting spam links (URLs). Link sharing is a core attraction of many existing social media systems like Twitter and Facebook. Recent studies find that around 25% of all status messages in these systems contain links [19, 20], amounting to millions of links shared per day. With this opportunity comes challenges, however, from malicious users who share spam links to promote ads, phishing, malware, and other low-quality content. Those spamming behaviors ultimately degrade the quality of information available in these systems. Several recent efforts have identified the problem of spam links on the Web [21, 22, 23], but it has not been fully explored particularly on social media.
• Misbehavior 2: Manipulation. Next, we take a step further from individual spam-ming behavior, and are interested in uncovering manipulated behavior of coordina-tion in link sharing. While some link sharing is organic, other sharing is strategically organized with a common (perhaps, nefarious) purpose, such as campaign-like ad-vertising and other adversarial propaganda. These manipulated campaigns conduct fraudulent activities, which can wreck havoc on business, politics, and social secu-rity [24, 25, 26, 27]. To purify and improve the information quality on social media, it becomes imperative that the service providers can detect those manipulated be-haviors of link sharing.
• Misbehavior 3: Distortion. Finally, we investigate one concrete distortion behavior that widely exists on social media — making bullshit (BS) statements. We follow the
concept of BS by philosopher Harry Frankfurt: BS is a statement that does not ad-dress facts, but rather distorts what the BS-er is up to [28, 29]. The current ecosystem of online social media has made it trivial to spread distorted information without ac-countability, accelerating the production of BS. Some BS statement on social media can increase stress and fear, which often leads to real-world violence [30]. More-over, it has been observed that BS has reached issues like politics and advertising where it can actually cause severe problems for BS-receivers [17, 31].
Figure 1.1: An overview of all problems studied in this dissertation
1.2 Research Challenges
While investigating these three types of user behavior is important, there are significant research gaps toward modeling and solving them efficiently and effectively. Here, we identify several main research challenges:
• Defining Misbehavior: Detecting user misbehavior on social media has not been fully explored so that many relevant problems are not clearly formulated. For exam-ple, when studying manipulation in link sharing, the definition of organized behav-ioral pattern is unsettled, e.g., how to mathematically define organic behavior and organized behavior in the context of link sharing? This issue becomes even more obvious in the problem of BS detection. How to adapt the concept of bullshit in phi-losophy or linguistics and properly define BS within the scope of social media? How to formulate a model of automatic BS detection in social media? All the problem formulations need to be resolved before solutions are figured out.
• Distinguishing Misbehavior from Legitimate Behavior: Considering the massive noise on social media, it becomes extremely challenging to clearly distinguish the trails of user misbehavior, even for human judgment. For example, to evaluate the distortion in a post, we need to find out whether the poster cares if his post is true or not. Yet, it is unrealistic to fully mine a user’s intent of distortion — we will never truly know what a user thinks when he posts. In the problem of detecting manipulated link sharing, the difference between the two extremes — organic and organized — is often not a simple distinction. Those “good intriguers” try hard to disguise themselves, which makes effectively differentiating them a tricky job.
• Uncovering Behavioral Signals: Behavioral signals have historically been difficult to collect. Many online social media systems provide restricted (or even no) re-search access (like public API) to posts published on them, such as Facebook and Instagram. Even for those systems that do provide a sample of its posts (like Twit-ter), it is still hard to collect fine-grained behavioral signals. For instance, in the problem of spam link detection, we do not know how those links posted on social media are actually received by the users via clicks. As a result, much insight into
be-havioral patterns of link sharing has been limited to proprietary and non-repeatable studies.
1.3 Contributions of This Dissertation
Keeping those research challenges in mind, in this dissertation we aim for developing novel computational models towarddiscovering,formulating,modeling, andsolvingthose problems introduced in Section 1.1. In particular, we first turn in this section to describe our contributions toward each of those three misbehavior-related applications. Then, we introduce a fourth problem we are going to study, serving as a cross-cuttingcomponent that supports better understandings of the other three tasks shown in Figure 1.1.
1.3.1 Detecting Spam Links via Behavioral Analysis
We investigate the potential of behavioral analysis for uncovering which links are spam and which are not. By behavioral signals, we are interested both in the aggregate behavior of who is posting these links in social systems and who is clicking on these links once they have been posted. These behavioral signals offer the potential of rich contextual evidence about each link that goes beyond traditional spam detection methods that rely on blacklists, the content of the link, its in-links, or other link-related metadata.
Concretely, we propose and evaluate fifteen click and posting-based behavioral fea-tures, including: for postings — how often the link is posted, the frequency dispersion of when the link is posted (e.g., is it posted only on a single day in a burst? or is it diffusely posted over a long period?), and the social network of the posters themselves; and for clicks — we model the click dynamics of each link (e.g., does it rapidly rise in popular-ity? are there multiple spikes in popularpopular-ity?) and consider several click-related statistics about each link, including the total number of clicks accumulated and the average clicks per day that a link was actually clicked. We accommodate these behavioral signals into a classification model to automatically detect spam links.
Through extensive experimental study over a dataset of 7 million Bitly-shortened links posted to Twitter, we find that these behavioral signals provide overlapping but fundamen-tally different perspectives on links. Through this purely behavioral approach for spam link detection, we can achieve high precision (0.86), recall (0.86), and area-under-the-curve (0.92). Compared to many existing methods that focus on either the content of social media posts or the destination page — which may be easily manipulated by spammers to evade detection — this behavior-based approach suggests the potential of leveraging these newly-available behavioral cues for robust, on-going spam detection.
1.3.2 Revealing Organized Link Sharing Behavior
In the context of manipulated link sharing on social media, we investigate a method to automatically (i) identify user groups in terms of similar link sharing behaviors; and (ii) differentiate strategically organized and genuinely organic user groups, through the development of a link sharing behavior based model. The key insight is that the publicly available link sharing information can help model users with similar behaviors of link sharing, and that some group-level behavioral signals can help characterize whether the behaviors of a group of users are organic or organized.
Concretely, we propose a four-step approach. We first formulate the behavior of link sharing based on its three key factors: user, link, and the posting activity. Based upon such a model, we design a similarity measurement of user behaviors in link sharing. Then, given the pairwise similarity function, we build a user graph model from which we iden-tify user groups each of which contains users with similar link sharing behaviors. Next, on the group level, we characterize the organic and organized user groups based on the link posting behaviors of their members. Finally, we embed those characteristics into a classi-fication framework to systematically distinguish organic and organized groups of users.
performs well in terms of precision, recall, F-measure, and ROC area. Random Forest algorithm works best with 0.921 ROC. Our experimental analysis demonstrated the capa-bility of our approach for (i) understanding users with similar link sharing behaviors; and (ii) distinguishing the level of manipulated user misbehaviors in link sharing.
1.3.3 Identifying BS on Social Media
We seek for footprints of human judgments left by other social media users to help locate potential BS posts, and we focus on the replying behavior as the evidence of a “BS call”. BS can originate from anywhere (i.e. many users post BS; no user posts onlyBS), which makes it very difficult to identify. The volume of potential BS and other noise on social media make this problem even trickier. We choose replying behavior because replies can help us easily trackwhoandwhathave been called BS. Also, replies are often topically motivated, meaning repliers care about the content of the post as opposed to other factors (e.g. author of the post) [32].
Instead of diving into the extremely nuanced task of detecting “actual” BS, we build a model that can automatically determine what social media posts are likely to becalledBS. There is a gap between BS-called posts and actualBS posts — we have observed many real examples showing identifying BS is a challenging task, even for humans. We focus on the audience’s perception of BS. We do this by mining how the audience perceives poster’s intent of BS-ing through signals from the post itself. Our work can serve as a stepping-stone to the ultimate goal of BS detection. For instance, our results can be used to filter posts that are unlikely to be BS from the vast social media stream. This could provide a more narrow search-space to develop a true BS identification method.
In concrete, we first prepare a curated crowd-sourced collection of BS-called tweets gathered over a sequence of 100 consecutive days. Next, we identify four factors within a post that influence a reader’s perception: attitude, sentiment, sincerity, andcontent. This
characterization leads to a classification model to differentiate between posts that are more likely to be called BS and posts that are less likely to be called BS. Finally, we conduct a series of experiments showing our model is capable of leveraging linguistic cues for identifying posts are likely to be called BS, suggesting the great potential of a preliminary BS auto-filter on social media.
1.3.4 A Cross-cutting Component: Learning User Topical Profile
Each of those three applications mentioned above has its own scope in the context of user misbehavior, but they all connect to the user who is the cross-cuttingsubject. This triggers an important question — who are those users? Answering this question can shed light into what subjects each user is associated with, which can serve as an important cross-cutting component toward better understanding the mutual relationship between users and the misbehaviors they commit. For example, we can analyze a user’s “morality” on so-cial media based on his behaviors; and judging a user “good” or “bad” can guide further investigations on this user’s behaviors on social media.
Therefore, we study a fourth task of learning social media user’stopical profile— top-ical interests (i.e., what she likes) or expertise (i.e., what she is known for). On the one hand, those users who are learned to have “problematic” topical profiles are suspicious targets of misbehaviors. On the other hand, those who associate with “high-profiles” (like experts with enormous reputation in certain domain) tend to keep distance from noxious behavior. For instance, if we find a group of Twitter accounts whose topical profiles are highly similar and all associate with spam, it becomes wary that these accounts are likely to conduct manipulated spamming behaviors. If a Facebook user posts extensively on topics that are distant from the domain of his real expertise (e.g., a sports journalist makes volu-minous claims on politics), it hints that this user is probably BS-ing. Besides, in general, the problem of learning a user’s topical profile also has its own important applications in
many domains. It can improve user experience and powering important applications like personalized web search [33], recommendation system [34, 35], expert mining [36], and community detection [37].
We propose to exploit heterogeneous footprints (e.g., tags, friends, interests, behavior) for intelligently learning user topical profiles. Based on a small set of explicit user tags, our goal is to extend this known set to the wider space of users who have no explicit tags. The key intuition is to identify “similar” users in terms of their topical profiles by exploiting their similarity in afootprint space. For instance, Twitter users who post similar hashtags may have similar interests, and YouTube users who upvote the same videos may have similar preferences. Such evidence of homophily has been widely studied in the sociological literature [38] and repeatedly observed in online social media, e.g., [39, 40, 41, 42, 43].
In a summary, we make four main contributions toward learning user topical profile on social media. First, we formulate the problem of learning user topical profiles in social media, with a focus on leveraging heterogeneous footprints. Second, we demonstrate how to model different footprints (e.g., like interests, social, and behavioral footprints) under this framework, and we present a unified 2-D factorization model in which we simultane-ously consider all of these footprints. Third, we then extend this initial approach through a generalized model that integrates the pairwise relations across all potential footprints via a tensor-based model, which provides a more robust framework for user profile learning. Finally, through extensive experiments, we find the proposed model is capable of learning high-quality user topical profiles, and leads to a 10-15% improvement in precision and mean average error versus a state-of-the-art baseline. We find that behavioral footprints are the single strongest factor, but that intelligent integration of multiple footprints leads to the best overall performance.
1.4 Structure of This Dissertation
The remainder of this dissertation is organized as follows:
• Section 2 — we explore the problem of detecting spam links via behavioral analy-sis. We first give the problem statement and setup. Then we provide posting-based features and click-based features toward building a classification model of spam link detection. Finally we present extensive experiment results.
• Section 3 — we investigate the problem of revealing organized link sharing behav-ior. We present our four-stage approach step by step: (1) modeling the behavior of link sharing, (2) extracting user groups with similar behavioral patterns, (3) charac-terizing organic and organized groups based on group-level behavioral signals, and (4) embedding extracted features into a classification framework.
• Section 4 — we look into the problem identifying BS on social media. We first introduce our motivation and methodology of data collection. We then formulate the problem and explain four factors impacting the likelihood a post gets called BS. In the end we present experiment analysis on our dataset and a classification model detecting social media posts that are likely called BS.
• Section 5 — we propose a generalized framework for learning user topical profiles. After providing preliminaries including all notations and problem definition, we first identify multiple implicit footprints and demonstrate how to model them. We then introduce a matrix-factorization-based approach, before extending this version to a more general tensor-based approach.
• Section 6 — We conclude with a summary of contributions made by this dissertation research. We discuss several potential directions of future extension to the results presented in this dissertation.
2. COMBATING SPAMMING: DETECTING SPAM LINKS VIA BEHAVIORAL ANALYSIS∗
In this section we explore the problem of detecting spam links via behavioral analysis, as a specific application toward tackling the first misbehavior — spamming. We begin with the introduction and related work, followed by problem setup and details of our so-lution. In the end we report a series of experiments designed to evaluate the quality of the proposed solution.
2.1 Introduction
Link sharing is one of the key functions in most existing social media systems. In the early days of Twitter in 2007, Java et al. already saw that about 13% of a collection of 1.3 million tweets included a link [44]. Recent studies have confirmed the ongoing popularity of link sharing on Twitter. In 2010, Boyd et al. found 22% of a sample of 720,000 tweets included a link [45]. And in 2011, Rodrigues et al. found that nearly a quarter of 1.7 billion tweets contained links [19].
With the popularity of link sharing comes challenges, however, from malicious user behaviors of spreading phishing, malware, and other spam content. Indeed, several recent efforts have identified the problem of spam links in social media [46, 22, 23, 47], which ultimately deteriorates the information quality in these systems. Defending social media systems from spam links is important for shielding unsuspecting social media users from these threats.
Our goal is to investigate the potential of behavioral analysis for uncovering which
∗Part of this section is reprinted with permission from "Detecting Spam URLs in Social Media via
Be-havioral Analysis" by Cao C., Caverlee J. (2015) In: Hanbury A., Kazai G., Rauber A., Fuhr N. (eds) Advances in Information Retrieval. ECIR 2015. Lecture Notes in Computer Science, vol 9022. Springer, Cham. Copyright 2015 by Springer.
links are spam and which are not. By behavioral signals, we are interested both in the aggregate behavior of who is postingthese links on social media and who is clicking on these links once they have been posted. These behavioral signals offer the potential of rich contextual evidence about each link that goes beyond traditional detection methods that rely on blacklists, the content in the link, its in-links, or other link-related metadata.
Unfortunately, it has historically been difficult to investigate behavioral patterns of posts and clicks. First, many social media platforms provide restricted (or even no) access to posts, like Facebook. Second, even for those systems that do provide research access to a sample of its posts (like Twitter), it has been difficult to assess how these links are actually received by the users of the system via clicks. As a result, much insight into behavioral patterns of link sharing has been limited to proprietary and non-repeatable studies.
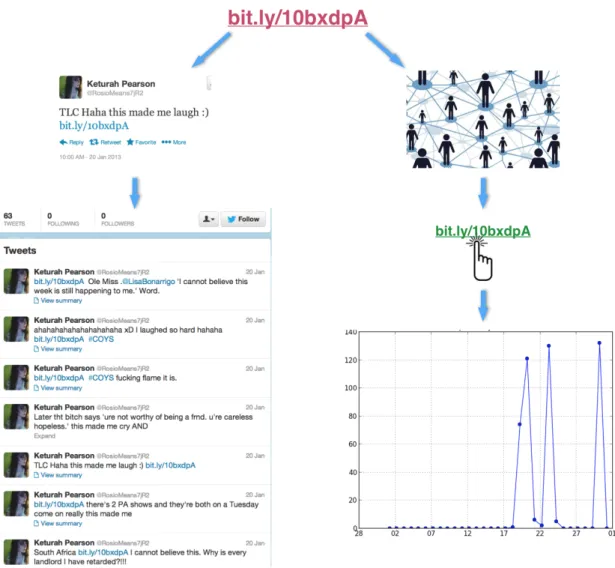
Hence, we begin a behavioral examination of spam link detection through two dis-tinct perspectives (see Figure 2.1): (i) the first is via a study of how these links are posted through publicly-accessible Twitter data; (ii) the second is via a study of how these links are received by measuring their click patterns through the publicly-accessible Bitly click API. Concretely, we propose and evaluate fifteen click-based and posting-based behav-ioral features. For posting we are interested in how often a link is posted, the frequency dispersion of when the link is posted (e.g., is it posted only on a single day in a burst? or is it diffusely posted over a long period?), and the social network of the posters themselves. And for click, we model the click dynamics of each link (e.g., does it rapidly rise in popu-larity? are there multiple spikes in popupopu-larity?) and consider several click-related statistics about each link — including the total number of clicks accumulated and the average clicks per day that a link was actually clicked.
Through extensive experimental study over a dataset of 7 million Bitly-shortened links posted to Twitter, we find that these behavioral signals provide overlapping but fundamen-tally different perspectives on links. Through this purely behavioral approach for spam
Figure 2.1: Studying spam link detection in social media from two perspectives: (i) Post-ing behavior (left); (ii) Click behavior (right)
link detection, we can achieve high precision (0.86), recall (0.86), and area-under-the-curve (0.92). Compared to many existing methods that focus on either the content of social media posts or the destination page – which may be easily manipulated by spammers to evade detection – this behavior-based approach suggests the potential of leveraging these newly-available behavioral cues for robust, on-going spam detection.
2.2 Related Work
Links (and in particular, shortened links) have been widely shared on social media systems in recent years. Antoniades et al. [46] conducted the first comprehensive analysis of short links in which they investigated usage-related properties such as life span. With the rising concern of short links as a way to conceal untrustworthy web destinations, there have been a series of studies focused on security concerns of these links, including: a study of phishing attacks through short links [22], geographical analysis of spam short links via usage logs [23], an examination of security and privacy risks introduced in shortening services [47], and a long-term observation of shortening services on security threats [48].
Separately, Twitter spam detection has been widely studied in recent years. In general, three types of approaches have been proposed: user profile based, content based, and network relation based. User profile based methods [49, 50, 51] build classifiers using features extracted from account profiles, e.g., profile longevity. Content-based features [52, 51] focus on the posting text. Network-based features [53, 54, 55] are those extracted from the social graph such as clustering coefficient. A couple of detection systems of suspicious links on Web have been developed. Some of these [56, 57, 58, 59] directly use URL’s lexical features, redirecting patterns, and link’s metadata such as IP and DNS information. Some [60, 61] consider features extracted from the HTML content of the landing page. Additionally, several dynamic spam link filtering systems have also been developed [62, 63, 64].
Several recent works have used clicks extracted from the Bitly API, typically to study the properties of known spam links. For example, Grier et al. [52] recovered clicking statistics of blacklisted Bitly links, with the aim of measuring the success of those spam links on Twitter. Maggi et al. [48] submitted malicious long links to the Bitly API in order to examine the performance in terms of spam pre-filtering. Chhabra et al. [22] shortened a
set of known phishing long links and analyzed factors like the referrer and location. There recently has been some research on using proprietary server-side click log data to defend against some types of spam (e.g., [65, 66]). In contrast, our aim is to investigate how large-scale publicly-available click-based information may be used as behavioral signals in the context of spam link detection on social media.
2.3 Behavior-based Spam Link Detection
In this section, we investigate a series of behavioral-based features for determining whether a link shared in social media is spam or not. We view this problem as a binary classification problem. For both the posting-based and click-based perspectives, we are interested to explore questions like: What meaningful patterns can we extract from these publicly-available resources? Are posting or click-based features more helpful for spam link detection? And which specific features are most informative?
2.3.1 Problem Statement and Setup
Given a link v that has been shared on a social media platform, the behavior-based spam link detection problem is to predict whether v is a spam link through a classifier c:v → {spam, benign}, based only on behavioral features. We consider two types of be-havioral features associated with each link – a set of posting-related bebe-havioral featuresFp and a set of click-based behavioral features Fc. Such a behavior-based approach requires both a collection of links that have been shared, as well as the clicks associated with each link. Since many social media platforms (like Facebook) place fairly stringent limits on crawling, we targeted Bitly-shortened links.
(a) Postings
(b) Clicks
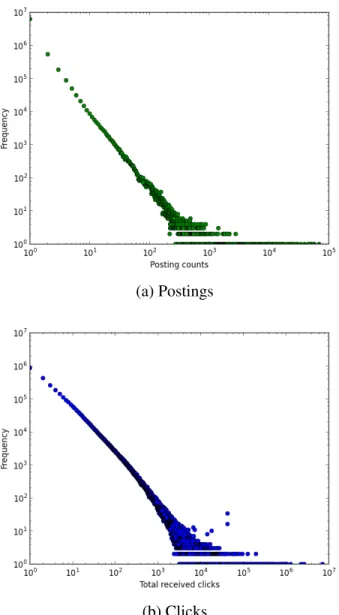
Figure 2.2: Distribution of postings and clicks for the sampled dataset.
Postings. Concretely, we first used the Twitter public streaming API to sample tweets during January 2013. We collected only tweets containing at least one Bitly link (that is, a complete link that had been shortened using the Bitly link shortening service). In total, we collected 13.7 million tweets containing 7.29 million unique Bitly-shortened links. We see in Figure 2.2a the typical “long tail” distribution: a few links have been posted upwards of
100,000 times, whereas most have been posted once or twice.
Clicks. We accessed the Bitly API to gather fine-grained click data about each of the 7.29 million links. For example, we can extract the number of clicks per time unit (e.g., minute, hour, day, month) and by country of origin. In total, we find that nearly all – 7.27 million out of 7.29 million – of the links have valid click information, and that 3.6 million (49.5%) of the links were clicked at least once during our study focus (January 2013). As in the case of postings, we find a “long tail” distribution in clicks, as seen in Figure 2.2b.
2.3.2 Posting-based Features
In the first perspective, we aim to study the links through the posting behaviors as-sociated with them. For example, some links are posted by a single account and at a single time. Others may be posted frequently by a single account, or by many accounts. Similarly, links may be temporally “bursty” in their posting times are spread more evenly across time. Our goal in this section is to highlight several features that may describe each link based on its posting behavior.
Posting Count. The first feature of posting behavior is the total number of times a link has been posted on Twitter during our study window. Our intuition is that this count can provide an implicit signal of the topic of the link destination as well as the intent of the sharer: e.g., links that are posted only a few times may indicate more personal, or localized interest. We formulate this feature asposting count, denoted asP ostCount(u) given a short linku.
Posting Standard Deviation. A Weather Channel link and a CNN breaking news link may have a similar posting counton Twitter. However, the Weather Channel link may be posted every day of the month (linking to a routine daily forecast), whereas a breaking news link may be posted in a burst of activity in a single day. To capture this posting concentration, we consider the standard deviation of the days in which a link is posted.
Concretely, for each linkuwe have a list of days whenuwas posted. We refer to this list asu’sposting days, denoted byP ostDays(u). We define theposting standard deviation of a linkuas the standard deviation of all elements in P ostDays(u), denoted asstd(u). For example, if a linkuwas posted 10 times on January 22nd and not tweeted on any other day, we havestd(u) = 0. On the contrary, a linkushared once per day will have a much largerstd(u).
Posting Intensity. The posting standard deviation gives insight into how concentrated a link has been posted, but it does not capture the total intensity of the posting. For example, two links both of which have only one single posting day will have the same posting standard deviation, even if one was posted thousands of times while the other appeared only once. To capture this difference, we introduceposting intensityto capture how intense the posting behaviors of a link are. Given a linku, we calculateu’s “intensity score” via:
intensity(u) = P ostCount(u)
(std(u)∗ |set(P ostDays(u))|) + 1
where |set(P ostDays(u))|is the number of distinct posting days of u. For those links whose scores are the highest, they have high posting frequency, but also a low intensity of posting days. To illustrate, we find in our dataset that the link with the highest intensity score was posted nearly 30,000 times on a single day.
Posting User Network. The sharer’s personal network and reputation have certain con-nection with what and why she posts. A typical example is the comparison between celebrities and spammers. Spammers whose networks commonly are sparse tend to post spam links to advertise, whereas a celebrity may not share such low-quality links. Thus, for each link we consider features capturing the poster’s personal network. Here, we use the counts of followers and friends as simple proxies for user popularity, and take the medianamong all posters.
2.3.3 Click-based Features
Now we turn our attention to how links are received in social media by considering the clicks that are associated with each link in our dataset. We consider two kinds of click-ing patterns: clicking timelinefeatures that consider the temporal series of daily received clicks, andclicking statisticsfeatures that capture overall statistics of the clicks.
For the first kind of clicking pattern, we have every short link’s fine-grained daily clicking data – which we can plot as itsclicking timeline. We adopt three features extracted from this clicking timeline curve:
Rises + Falls. The first question we are interested is: how to capture the overall shape of a link’s clicks – do some go up continuously? Or do some periodically go up and down? To measure these changes, let ni denote the number of clicks on the ith day. We define a riseif there exists anisuch that ni+1−ni > α∗ni where αis a threshold. We set it to be 0.1, ensuring the change is non-trivial. Based on this criteria, we observe eight rises in Figure 2.3b (some are quite small). Similarly, letni denote the number of clicks on the ith day. We define afall if there exists anisuch that ni −ni−1 > β ∗ni−1 whereβ is a threshold value (set to 0.1 in our experiments). We observe eleven falls in Figure 2.3b. Spikes + Troughs. In Figure 2.3b, we observe that while there are eight rises, there are only five spikes of interest. So rather than capturing consecutive monotonic changes (as in the rises and falls), we additionally measure the degree of fluctuation of a link through its spikesandtroughs. That is, if there is anisuch thatni−1 < ni > ni+1 we call it aspike. If there exists anisatisfyingni−1 > ni < ni+1, then we define it is atrough. To illustrate, Figure 2.3b has 5 spikes and 3 troughs.
Peak Difference.Naturally, there is a relationship between how and when a link is posted and the clicks the link receives. For example, Figure 2.3a illustrates a close relationship be-tween posting and clicking for a link. In contrast, Figure 2.3b demonstrates a much looser
(a)
(b)
Figure 2.3: The click and post timelines for two links. In (a), post and click behaviors are tightly coupled. In (b), the relationship is more relaxed.
connection, indicating some external interest in the link beyond just its Twitter postings (in this case, the link refers to a university website which attracts attention from many sources beyond Bitly-shortened links on Twitter). To capture the extent to which posting behaviors influence clicks, we define thepeak difference. For each link, we identify itsclicking peak as the day it received the most clicks. Similarly, we identify itsposting peak as the day it was posted the most. Note that a link may have more than one posting peak and clicking peak. Here we define thepeak difference as the minimum difference between two peaks among all pairs. The range of peak difference is from 0 to 30. In this way, peak difference can represent the level of tightness between clicking and posting.
We augment these timeline-based features with several click statistics:
Total Clicks. The first statistic is the total clicks a link received in the period of study, which is a clear indicator of the popularity of a link.
Average Clicks. Given a link’s total clicks and posting count, we can measure itsaverage clicks per posting. By intuition more exposures bring more clicking traffic, but the aver-age clicks is not necessarily large. Compared to total clicks, averaver-age clicks has a starker representation of popularity: many clicks via few postings suggest highly popular.
Clicking Days. Next, we measure the number of clicking daysin which a link received clicks. This feature captures the consistency of attention on a link.
Max Clicks. Max clicksis the maximum daily clicks. Unlike total clicks, this statistic can distinguish links that receive a burst of attention.
Effective Average Clicks. For those links with great total clicks, we observe some have a large number of clicking days while some have only one clicking day but thousands of clicks. Since average clicks considers only the relationship between total clicks and posting count, here we introduceeffective average clicksdefined as clicking daystotal clicks
time-lines, now we consider a feature for the fluctuation of daily clicks given that we have specific sequence of daily clicks. We can calculate the standard deviation of daily clicks, defined asclick standard deviation. Note that we fix a month as our time window of study. So, for each short link we have a sequence of daily clicks and we can compute the standard deviation.
Mean Median Ratio. Finally, given 31 daily clicks of a linku, we can calculate its mean and median daily clicks, denoted asmean(u)andmedian(u)respectively. Now suppose we have a link obtaining thousands of clicks on a day but very few on other days. It may have a considerable mean value but a low median. To build a connection between mean and median, we definemean median ratioofuas the following: mean median ratio (u)=
mean(u) median(u)+1
2.4 Experiments
In this section, we report a series of experiments designed to investigate the capacity of these two behavioral perspectives – posting-based and click-based – on the effectiveness of spam link detection. Recall that our goal here is to examine the effectiveness ofbehavioral signals aloneon spam detection. The core intuition is that these signals are more difficult to manipulate than signals such as the content of a social media post or the content of the underlying destination page. Of course, by integrating additional features such as those studied in previous works – e.g., lexical features of tweet texts, features of user profiles, and so forth – we could enhance the classification performance. Since these traditional features may be more easily degraded by spammers, it is important to examine the capability of a behavioral detector alone.
2.4.1 Experimental Setup
We consider two different sources of spam labels:
community-maintained link-category website URLBlacklist (http://urlblacklist.com) that provides a list of millions of domains and their corresponding high-level category (e.g., “News”, “Sports”). Among these high-level categories are two that are clearly malicious: “Malware” and “Phishing”, and so we assign all links in our dataset that belong to one of these two categories asspam. We assign all links that belong to the category “Whitelist” as benign. It is important to note that many links belong to potentially dangerous categories like “Adult”, “Ads”, “Porn”, and “Hacking”; for this list-based method we make the con-servativeassumption that all of these links belong to theunknownclass. For all remaining links, we assume they areunknown. This labeling approach results in 8,851 spam links, 223 benign, and 1,009,238 unknown. Of these links, we identify all with at least 100 total clicks, resulting in 1,049 spam, 21 benign, and 60,012 unknown. To balance the datasets, we randomly select 1,028 links from the unknowns (but avoid those above-mentioned dan-gerous categories), and consider them as benign, leaving us with 1,049 spam and 1,049 benign links.
Spam Set 2: Manually Labeled. We augment the first spam set with this second collec-tion. We randomly pick and manually label 500 short links, each of which has been posted at least 30 times along with at least 5 original tweets (i.e., not a retweet, nor a reply tweet). We label a link as “spam” if its landing page satisfies one of the following conditions: (1) The browser client (Google Chrome in our work) or Bitly warns visitors that the final page is potentially dangerous before redirecting; (2) The page is judged as a typical phishing site; (3) After several redirectings, the final page is judged to be a typical “spam page”; (4) Apparent crowdturfing websites such as what were introduced in [67]. Finally, we end up with 124 manually-labeled malicious links: 79 spam ones, 30 irrelevant ads ones, and 15 pornographic ones. We also collect 214 benign links: 85 news ones, 70 blog ones, 49 video-audio ones, and 10 celebrity-related ones.
Table 2.1: Evaluation results for the list-based dataset
Set of features
Precision Recall F-Measure ROC area
All 15 features
0.742
0.737
0.736
0.802
Click-based only
0.647
0.647
0.647
0.705
Posting-based only
0.648
0.695
0.694
0.756
Clicking statistics only
0.622
0.622
0.622
0.679
For each dataset, we construct the five posting-based features and the ten click-based features for all of the links. Then, we adopt the Random Forest classification algorithm (which has shown strong results in a number of spam detection tasks, e.g., [68, 53, 51]), using 10-fold cross-validation. The output of the classifier is a label for each link, either spam orbenign. We evaluate the quality of the classifier using several standard metrics: average precision, recall, F-Measure and area under the ROC curve, equally-weighted for both classes.
2.4.2 Experimental Results
Classification on the List-labeled Dataset. For the first dataset, we report the evaluation results in Table 2.1. We find that using all features – both posting-based and click-based – leads to a 0.74 precision, recall, and F-Measure, and a ROC area of 0.802. These results are quite compelling, in that with no access to the content of the tweet nor the underlying web destination, spam links may be identified with good success using only behavioral patterns.
Next, we ask whether posting-based features or click-based features provide more power in detecting spam links. We first exclude the five posting-based features and re-port the Click-based only result in the table. We see even in this case we find a nearly 0.65 precision, recall, and F-Measure. When we drop click-based features in favor of a Posting-based only, we see a similar result. These results show that individually the two
Table 2.2: Top-10 features for list-labeled dataset (Chi-square)
Rank
Features
Score
Category
1
Median friends
277.43
Posting
2
Average clicks
199.11 Clicking
3
Median followers
159.53
Posting
4
Effective average clicks 150.72 Clicking
5
Click standard deviation 141.62 Clicking
6
Mean median ratio
141.49 Clicking
7
Max clicks
137.38 Clicking
8
Total clicks
120.67 Clicking
9
Rise & Fall
78.18
Clicking
10
Score function
66.50
Posting
feature sets have reasonable distinguishing power, but that in combination the two reveal complementary views of links leading to even better classification success.
We additionally consider the very restricted case ofclicking statistics only(recall that our click-based features include both clicking statistics and clicking timeline features). Us-ing only the seven click statistics, we observe only a slight degradation in quality relative to all click-based features.
To provide more insights into the impact of each feature, we use the Chi-square filter to evaluate the importance of features to the classification result. The top 10 features are shown in Table 2.2. Median friends and average clicks are the most two important features. Generally speaking, click-based features tend to play more important roles than posting-based features. Recall that our list-labeled dataset are those links with abundant clicks received, but it is not guaranteed that they have adequate posting counts, which may explain the ranking. For instance, if most links, either malicious or benign, have only one or two posting days and posting counts is less than 5, their posting counts and posting standard deviations will tend to be similar.
Table 2.3: Evaluation results for the manually-labeled dataset
Set of features
Precision Recall F-Measure ROC area
All 15 features
0.860
0.861
0.859
0.921
Click-based only
0.828
0.828
0.828
0.888
Posting-based only
0.839
0.84
0.837
0.904
Clicking statistics only
0.842
0.843
0.841
0.875
Classification on the Manually-labeled Dataset. We repeat our experimental setup over the second dataset and report the results here in Table 2.3. When we use the complete 15 features, the precision, recall, and F-Measure are all even higher than in the list-labeled dataset case, around 0.86, with a ROC area of around 0.92. These results are encouraging. We attribute the increase in performance relative to the first dataset to the more expansive labeling procedure for the second dataset. In the list-labeled dataset, we only considered extremely “bad” links since we considered only the “Malware” and “Phishing” categories. This conservative assumption may lead to many spam-like links lurking in the set of benign links. In contrast, the manually-labeled dataset considers more broadly the context of what makes a spam link.
Continuing our experiments, we again consider subsets of features in the classification experiment. Again, we find that using only a single feature type – either Click patterns only or Posting patterns only – leads to fairly strong classification performance. But in combination, the two provide complementary views on links that can be used for more successful spam link detection.
Again, we use Chi-square filter to rank features, as shown in Table 2.4. Interestingly, the ranking is quite different from what we found in Table 2.2, though again we observe a mix of both posting and click-based features. We attribute some of this difference to the click data’s availableness in the manually-labeled dataset; most of the links in the
Table 2.4: Top-10 features for manually-labeled dataset (Chi-square)
Rank
Features
Score
Category
1
Average clicks
149.41 Clicking
2
Posting count
144.23
Posting
3
Median followers
123.24
Posting
4
Median friends
118.19
Posting
5
Score function
87.00
Posting
6
Posting standard deviation
63.66
Posting
7
Click standard deviation
59.27
Clicking
8
Max clicks
58.56
Clicking
9
Mean median ratio
54.17
Clicking
10
Clicking days
45.93
Clicking
manually-labeled dataset have abundant posting information and we can see that the post-ing behavior features play important roles in classification. On the contrary, most of the links in the manually-labeled dataset do not have very large clicking traffic to support clicking-based features. However, these two results – on the two disparate ground truth datasets – demonstrate the viability of integrating click-based features into spam link de-tection in social media, and the importance of integrating complementary perspectives (both posting-based and click-based) into such tasks.
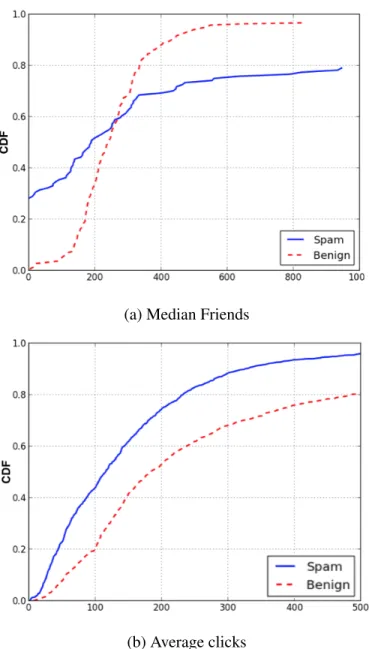
To further illustrate the significance of click and posting-based features, we consider two of the top-ranked features in both datasets (recall Table 2.2 and Table 2.4): median friends and average clicks. We compare the distributions of these two strongly correlated features for all spam links and benign links, in Figure 2.4. For links in the list-based dataset, as in Figure 2.4a, around 20% spam links are posted by users with a median friends count of 0, and yet around 20% have a median friends count that exceeds 1,000. These two types of posters could correspond to newly-registered accounts (0 friend) and “high-quality” accounts like those in a for-pay campaign. In contrast, legitimate accounts
(a) Median Friends
(b) Average clicks
who posted benign links have relatively “normal” distribution of median friends, that is, most have median friends less than 300 and almost none has a zero median. For links in manually-labeled dataset, as in Figure 2.4b, we see that spam links tend to have a lower average clicks. A potential reason is that malicious links require more exposure or other “abnormal means” to support consistent clicks, while legitimate links can survive longer due to their appealing contents. We find similar distributions for other click-based statistics, including the click standard deviation and the effective average clicks.
2.5 Summary
In summary, we investigate the potential of behavioral analysis aiding in uncovering spam links in social media. Purely by behavioral signals, we have considered two perspec-tives – (i) how links are posted through publicly-accessible Twitter data; and (ii) how links are received by measuring their click patterns through the publicly-accessible Bitly click API. The core intuition is that these signals are more difficult to manipulate than signals such as the content of a social media post or the content of the underlying destination page. Through an extensive experimental study over a dataset of 7 million Bitly-shortened links posted to Twitter, we find accuracy of up to 86% purely based on these behavioral signals. These results demonstrate the viability of integrating these publicly-available behavioral cues into spam link detection in social media.
3. COMBATING MANIPULATION: REVEALING ORGANIZED LINK SHARING BEHAVIOR∗
In the previous section we explored the problem of detecting spam links via behavioral analysis, as a concrete application toward combating the misbehavior of spamming on social media. In this section, we turn to our second user misbehavior — manipulation on social media. In particular, we investigate the task of revealing organized link sharing behavior on social media and present a four-step approach, as follows.
3.1 Introduction
Link sharing is one of the most popular avenues to share information on Twitter. Users can enrich their inherently limited length postings by inserting a link pointing to an exter-nal resource such as a blog, video, or image. By doing so, many different viewpoints and additional context can be expressed through link sharing.
While some link sharing is legitimate (i.e., “organic”), other sharing behaviors are strategically manipulated (i.e., “organized”) with a common purpose. And the boundary between these two extremes – organic and organized – is often not clear. Consider the following examples:
• Figure 3.1 shows three users who tweeted the same linkbit.ly/1dtous, linking to a YouTube webpage related to the boy band One Direction. They all express their affections for the band in their tweets. It seems very likely they are fans of One Direction, which explains that they spontaneously posted the same link. This common interest in a subject related to a link leads to the coincidence of multiple
∗Part of this section is reprinted with permission from "Organic or Organized?: Exploring URL Sharing
Behavior" by Cao C., Caverlee J., Lee K., Ge H., and Chuang J. In: Proceedings of the 24th ACM Inter-national on Conference on Information and Knowledge Management (CIKM ’15). ACM, New York, NY, USA, 513-522. Copyright 2015 by ACM.
organically posted links.
• Figure 3.2 shows four more users who posted the same One Direction YouTube link – bit.ly/1dtous. In this case, however, we can deduce that the users are participating in a voting campaign to attract the band to their hometown. The users are somewhat linked in this common desire.
• Continuing this theme, Figure 3.3 shows four additional users who have all tweeted a “vote” for Boston to attract One Direction. In this case, the voting behavior is sus-picious: the tweets have highly similar text, and the latter three tweets were posted on the same day and the accounts names are quite similar. Were they organized to post the same link? Are these accounts controlled by the same person? Is the first account “innocent”?
• Finally, Figure 3.4 highlights three users who engage in a clear example of a some-what sophisticated organized link spamming. Each user posts slightly different text and different appearing links, though ultimately all of the links redirect to the same destination link – an advertising webpage. This coordinated behavior of link sharing is fundamentally different from the first case of organic link sharing.†
These observations motivate us to investigate link sharing in social media. Our goal,in the context of link sharing, is to automatically (i) identifyuser groupsin terms of similar link sharing behaviors; and (ii) differentiate strategicallyorganizedand genuinelyorganic user groups, through the development of a link-posting behavior based model. The key insight motivating our work is that the publicly available link-posting information can help model users with similar behaviors of link sharing, and that group-level behavioral signals can characterize a group of users as organic or organized. To purify and improve
†These accounts have been alive for more than two years, which suggests the official Twitter spam policy
Figure 3.1: One example of three users who have organically posted the same link: bit.ly/1dtous
Figure 3.2: Four users seemingly post link for a voting campaign
Figure 3.4: Three users coordinate to post the same advertising link
the information quality on their platform, it becomes imperative that the service provider can detect those organized behaviors of link sharing, such as campaign-like advertising, spamming, and other adversarial propagandas.
Given a group of organized users, on the one hand, we expect those users – no matter whether managed by a command-and-control structure or not – post links toward a com-mon goal. We do not argue the goal has to be malicious, like the example in Figure 3.3. On the other hand, we focus ongroup-levelbehavioral evidence that can reflect their co-ordination. For instance, the users in Figure 3.2 were seemingly participating in the same “voting campaign”, but they actually have different goals (the targeting cities) and their tweet content are quite distant. Even the users in Figure 3.3 seem suspicious, we need more evidence and should design a systematic framework for detection.
Concretely, we propose a four-step approach. We first formulate link sharing based on its three key factors: user, link, and the posting activity. Based upon such a model, we design a similarity measurement of user behaviors in link sharing. Then, given the pairwise similarity function, we build a user graph model from which we identify user groups each of which contains users with similar link sharing behaviors. Next, on the group level, we characterize the organic and organized user groups based on the link sharing behaviors of
their members. Finally, we embed those characteristics into a classification framework to systematically distinguish organic and organized groups of users.
3.2 Related Work
Recent studies have started to investigate link sharing in social media, with different goals. One thread is about sharing intention, i.e., why people share links in social media. Suh et al. found that embedding links is one of the most important factors for increasing the retweetabilityof a tweet [69]. Smith et al. found that Twitter users add links to their tweets when discussing controversial topics, toward spreading information instead of conversing [70].
Another thread focuses on what people spread through links in social media, e.g., [15, 71, 72, 73]. These efforts have mainly focused on grouping similar messages or grouping users, such that the links provide additional context that may reflect the interests of the people posting these links.
Recently, several efforts have mentioned the dark side of link sharing in social media. Stringhini et al. examined spam campaigns on Twitter that posted messages with links pointing to the same site [74]. Grier et al. defined a spam campaign as the set of Twitter accounts that spammed at least one blacklisted link in common [75], and Gao et al. did similar things on Facebook [76]. Ghosh et al. studied the link farming on Twitter and found many participants are sybil accounts. Among those top link farmers, 79% have links pointing to their external webpages [7]. More recently, Nikiforakis et al. explored the ecosystem of ad-based URL shortening services, and the vulnerabilities made possible by these services [77].
Since 2006, there have been many social network-based sybil defense methods pro-posed such as SybilGuard [78], SybilLimit [79], and SybilInfer [80]. Viswanath et al. pointed out most of those approaches are essentially graph partitioningalgorithms [81].
They all made certain assumptions of the social network topology, used ground-truth in-formation of trusted users, ranked all users, and determined who are sybils based on some cutoff. Rather than exclusively focus on spammers or sybils, our interest is to reveal groups of strategically organized users who engage in link sharing with a purpose: some of the groups will post spam, but many others spread propaganda, aggressively promote products or services, and generally engage in coordinated manipulation. Unlike spamming or sub-verting reputation, the users we consider can be genuine and legitimate, as in Figure 3.3. Additionally, our problem is more general in the sense that our approach can detect those “link-posting based” sybils attacks or spam campaigns. We explicitly model and identify groups of users who have similar behaviors of link sharing, and differentiate the organized and organic groups via a group-level classification framework.
3.3 Methodology
In this section, we propose our approach to explore similar user behaviors in link shar-ing. In this context, our objective is to (i) formulate and collect user groups; and (ii) differentiate the organic and organized user groups. To tackle this problem, we formulate the concept of user group in the context of link sharing, and focus exclusively on behav-ioral signals. We are interested in answering the following questions: How do we model user in link sharing? How do we define and find user group? And how can we distinguish between organic and organized user group?
Toward answering these questions, our approach is structured in four steps. The main intuition is that the users from an organic group coincidently share similar interests on cer-tain subjects so that they have similar behaviors of link sharing. On the contrary, organized groups consist of users who plot to post links with a certain goal in common so that their behaviors conform to a notion ofcooperationorcoordination.